
Abstract
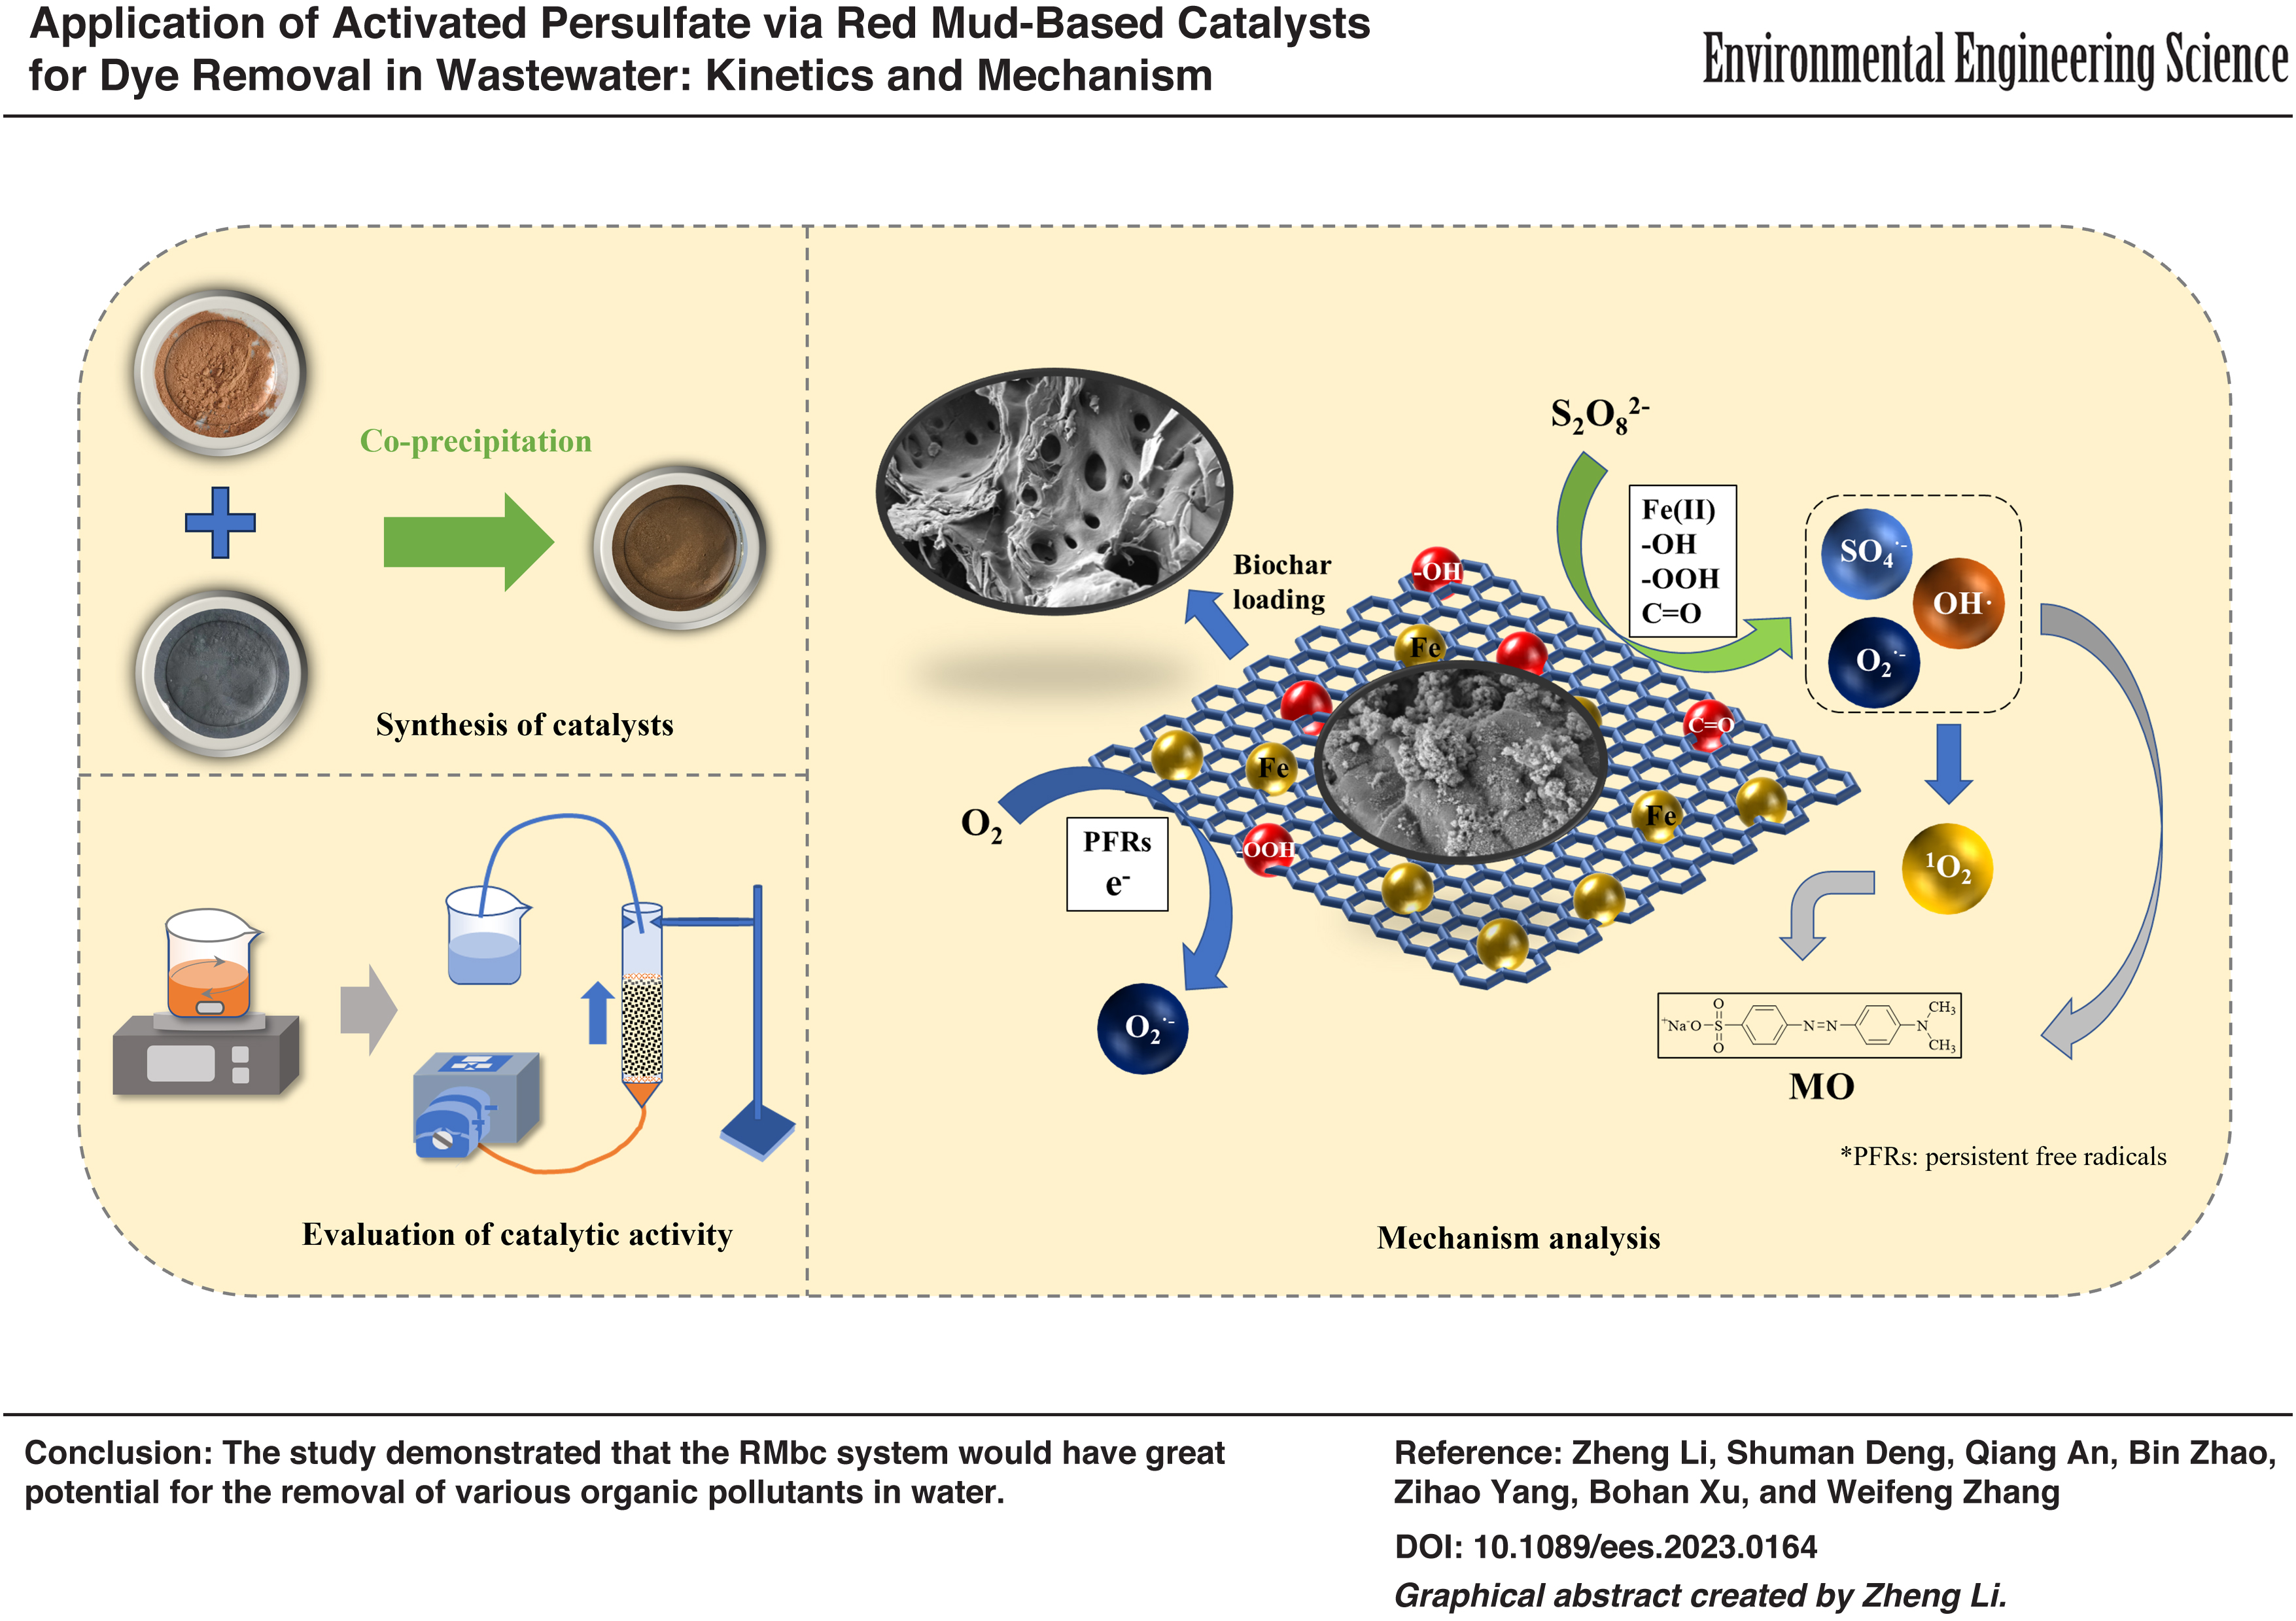
To alleviate the pollution problem of dye wastewater and the problem of resource utilization of red mud, a novel biochar-loaded red mud catalyst (RMbc) was synthesized using red mud and pomelo peel biochar by a low-cost coprecipitation method. Due to the high specific surface area and abundant oxygen-containing functional groups of RMbc, the synthesis process promoted the conversion of Fe2O3 to Fe3O4 and Fe0, which achieved higher catalytic activity. Moreover, the RMbc system showed better removal effects than raw red mud for methyl orange (MO) removal. Of the MO, 92.50% was removed within 60 min, and scanning electron microscope, X-ray powder diffractometer, fourier transform infrared spectrum, and X-ray photoelectron spectroscopy were applied to characterize the catalyst. The mechanism studies demonstrated that sodium persulfate was mainly activated by Fe0 and Fe(II) to produce reactive oxygen species O2•− and 1O2. The intermediate products of MO were identified, and a probable degradation pathway was proposed. Finally, the performance of RMbc for mixed dyes and coexisting pollutants was evaluated. The RMbc was low-cost and high catalytic activities, both showing good application prospects in experimental studies and further applications.
Introduction
The dyeing industry makes an important contribution to meeting human needs, but it is also one of the largest polluters. Previously statistics reveal that the textile industry used ∼70 kilotons of dyes per year, and of nearly 40% will eventually transform into pollutants, posing an environmental health hazard (Ismail and Sakai, 2022; Liu et al., 2021; Tanveer et al., 2023). Dyes are widely used in the textile industry, the carcinogenic, toxic, and the hard-to-degrade organic pollutant makes the treatment of dyes a major issue of current research (Zhou et al., 2019). Azo dyes are compounds containing azo groups (-N = N-) and are the most widely used type of dyes, accounting for about 70% of synthetic dyes, toxic and carcinogenic and have significant negative impacts on living organisms and human beings (Mahmood et al., 2016; Sen et al., 2016; Wang et al., 2023b; Zhang et al., 2021).
In recent years, advanced oxidation process (AOPs) technology has been advantageous in the field of dye wastewater treatment due to the ability of hydroxyl radicals (•OH) to react with most complex organic pollutants (Asghar et al., 2015). Compared to hydroxyl radicals, sulfate radicals (SO4•−) have the same or even higher redox potential (2.5–3.1 V), higher selectivity, and longer half-life, and persulfate-based AOPs is gaining increasing attention (Lutze et al., 2015; Wang et al., 2023a). Efficient activation of persulfate to produce SO4•− is the key to improving pollutant degradation performance, and studies have shown that persulfate can be activated by a variety of means, such as heat activation, UV activation, and ultrasonic activation (Wang et al., 2023b).
Fe has been shown to have great potential for activation of persulfates as a low toxicity and environmentally catalyst among transition metals (Sun et al., 2022; Wang et al., 2023a; Wang et al., 2022). At the same time, studies have shown that nonradical pathways may also occur in the persulfate system, which has great potential for the removal of contaminants.
Red mud was a solid waste generated during the industrial production of alumina, and the global production of red mud is expected to exceed 900 kt/a (Wang and Liu, 2012). The Fe element makes the potential performance of catalytic advanced oxidation reaction to degrade organic matter (Liu et al., 2023; Sun et al., 2022). Modification is one of the ways to improve the catalytic performance, but the energy consumption and the production yield limit the large-scale application (Wang et al., 2021b). Thus, developing an economical and energy-efficient technique that utilizes red mud's natural minerals to enhance its catalytic activity is highly important for efficient resource management (Liu et al., 2023).
Kim et al. (2020) used raw red mud to activate persulfate to degrade fluoroquinolone contaminants, providing new ideas for the application of raw red mud in advanced oxidation. On the contrary, biochar is featured with stable properties, large specific surface area, and abundant surface functional groups, and also has potential catalytic properties (An et al., 2022b; An et al., 2021; Li et al., 2023). There has been a great deal of attention paid to the activation of persulfates with biochar (Wang et al., 2021a).
In this article, the raw red mud catalyst (RM0) and the low-cost biochar-loaded red mud catalyst (RMbc) were fabricated by solid waste red mud and pomelo peel biochar. Then, (1) the physic-chemical properties of the materials before and after biochar loading were investigated, (2) the catalytic activity and reuse stability of RM0 and RMbc were assessed by using methyl orange (MO) as the target pollutant and sodium persulfate (PDS) as an oxidant, (3) the main reaction mechanisms of different systems were revealed, and (4) the performance of catalysts was evaluated to degrade simulated mixed dye wastewater in a fixed bed with continuous flow condition.
Materials and Methods
Chemicals
Details of the chemicals used in this experiment can be found in Supplementary Text S1 in Supplementary Data.
Synthesis of catalysts
The red mud was collected from a local alumina refinery in Chongqing city of China, after drying at 60°C and sieved through 100 mesh, the raw red mud powder got was defined as RM0. The pomelo peel was put into a pyrolysis furnace and the parameters were as follows: heated up to 250°C for 40 min, continued to be heated up to 450°C for 30 min, thermostatic at 450°C for 60 min, and finally cooled down to 200°C for 50 min. The resulting biochar was washed with ultrapure water and dried at 60°C, recorded as BC. The catalyst was prepared by the coprecipitation method.
The acid modification was applied to enhance the catalytic activity by promoting red mud distribution and enhancing the Fe(II) conversion (Guo et al., 2021; Ioannidi et al., 2020). First, added with the ratio of red mud:ultrapure water:nitric acid = 3 g:30 mL:1.5 mL under 300 r/min for 30 min. Second, BC was added to the beaker in the ratio of red mud:biochar = 3 g:1 g and stirred under 300 r/min for 20 min. Finally, the filtered part of mixed solution was dried at 60°C, which was recorded as RMbc.
Experimental procedure
Various conditions were used to evaluate the catalyst activity, and all of them were carried out at room temperature (25°C) apart from the experiment to investigate the effect of temperature. After the target concentration of MO contaminant solution was prepared, PDS and catalyst were added simultaneously to a beaker containing 250 mL of MO solution. The initial sample was taken before the start of the reaction (at 0 min), and then 3 mL of the reaction solution was collected at successive time intervals (1, 3, 5, 10, 20, 30, 40, 50, 60 min) and filtered through a 0.45 μm membrane and the MO concentration was determined by UV spectrophotometer (UV-1200; Mapada, China) at 464 nm (An et al., 2023). The MO removal rate was calculated by Equation (1) and the pseudo-second-order kinetic model Equation (2) was used to fit data (An et al., 2023; Li et al., 2014).
The effects of pH (3–11), catalyst dosage (0–1.3 g/L), MO concentration (50–150 mg/L), and PDS concentration (0–20 mM) were also investigated in the batch experiments. Besides, the effects of chloride (Cl−), nitrate (NO3−), carbonate (CO32−), hydrogen phosphate (HPO42−), and the temperature on the removal of pollutants were investigated under reaction conditions, which were [pH] = 6, [Catalyst] = 1.0 g/L, [PDS] = 20 mM, [MO] = 100 mg/L. The reactive oxygen species (ROS), including radicals and singlet oxygen, may have varying contributions to the process of the degradation process (Liu et al., 2022). To further identify the ROS for MO degradation, Methanol (MeOH) at 4 mM for quenching •OH and SO4•−, tert-butanol (TBA) at 2 mM for quenching •OH, 1,4-benzoquinone (1,4-BQ) at 20 mM for quenching of O2•− (Zou et al., 2020), and furfuryl alcohol at 20 mM for quenching of the nonradical singlet oxygen (1O2).
The reactive species formed during catalytic reactions were examined by Electron paramagnetic resonance techniques with adding DMPO and TEMP. All the experiments were carried out in duplicate. The intermediate degradation products were analyzed by QE Plus-MS.
Application performance of catalyst
Configure a mixed solution of AO7, MO, and RhB in equal amounts, defined as a combined dye wastewater with a concentration of 50 mg/L (Yu et al., 2022). EN ISO 7887-2011 (Aouni et al., 2012; Yu et al., 2022) and HJ 501-2009 were used for total organic carbon analyzer (TOC) determination, and different Cr(VI) concentrations (2, 5, 10 mg/L) and NH4+-N concentrations (5, 10, 20 mg/L) were evaluated (Li et al., 2020a; Shindhal et al., 2021). The colorimetric determination of combined dye wastewater, Cr(VI) concentrations, and NH4+-N concentrations were determined by UV spectrophotometry (UV-1200; Mapada), and the TOC determination was determined by TOC (TOC-L CPH; Shimadzu, Japan).
Results and Discussion
Characterization
Scanning electron microscope
Supplementary Figure S1a shows that the original red mud is dominated by mesoporous structure with rough surface morphology and the specific surface area was 21.022 m2/g (Table 1). The microstructure of BC is microporous (Supplementary Fig. S1b), with the surface area 622.630 m2/g. The attachment and distribution of red mud particles on the surface of biochar can be observed in SEM images of RMbc (Supplementary Fig. S1c–f), which was related to the results of acid modification (An et al., 2023; Luo et al., 2019). The red mud was randomly loaded on the biochar surface, and due to the large specific surface area of biochar, the red mud as a whole was well distributed on the catalyst. Meanwhile, the red mud also loaded into the internal pores of biochar, which has a high specific surface area (205.156 m2/g).
The Surface Area Parameters of RM0, BC, and RMbc
BC, Biochar; RM0, red mud catalyst; RMbc, biochar-loaded red mud catalyst.
X-ray fluorescence spectrometer
XRF analysis is commonly used to determine the main composition of red mud (Yoon et al., 2019). In the compositional analysis of RM0 (Supplementary Table S1), Fe, Al, Ca, Ti, and Si are sourced from bauxite, and Na is present mainly due to the use of NaOH in the bayer process (Maihatchi Ahamed et al., 2020). The Fe content in RMbc increased from 15.49% to 36.64% after biochar loading, corresponding to the reduction of Al content from 14.85% to 10.45% (Supplementary Table S2). The loading biochar could effectively increase the Fe content and create more active surface sites. This increase may be due to red mud impurities dissolving during the biochar loading under acidic conditions, along with the adsorption of Fe(II) and Fe(III) ions by biochar (Ioannidi et al., 2020).
X-ray powder diffractometer
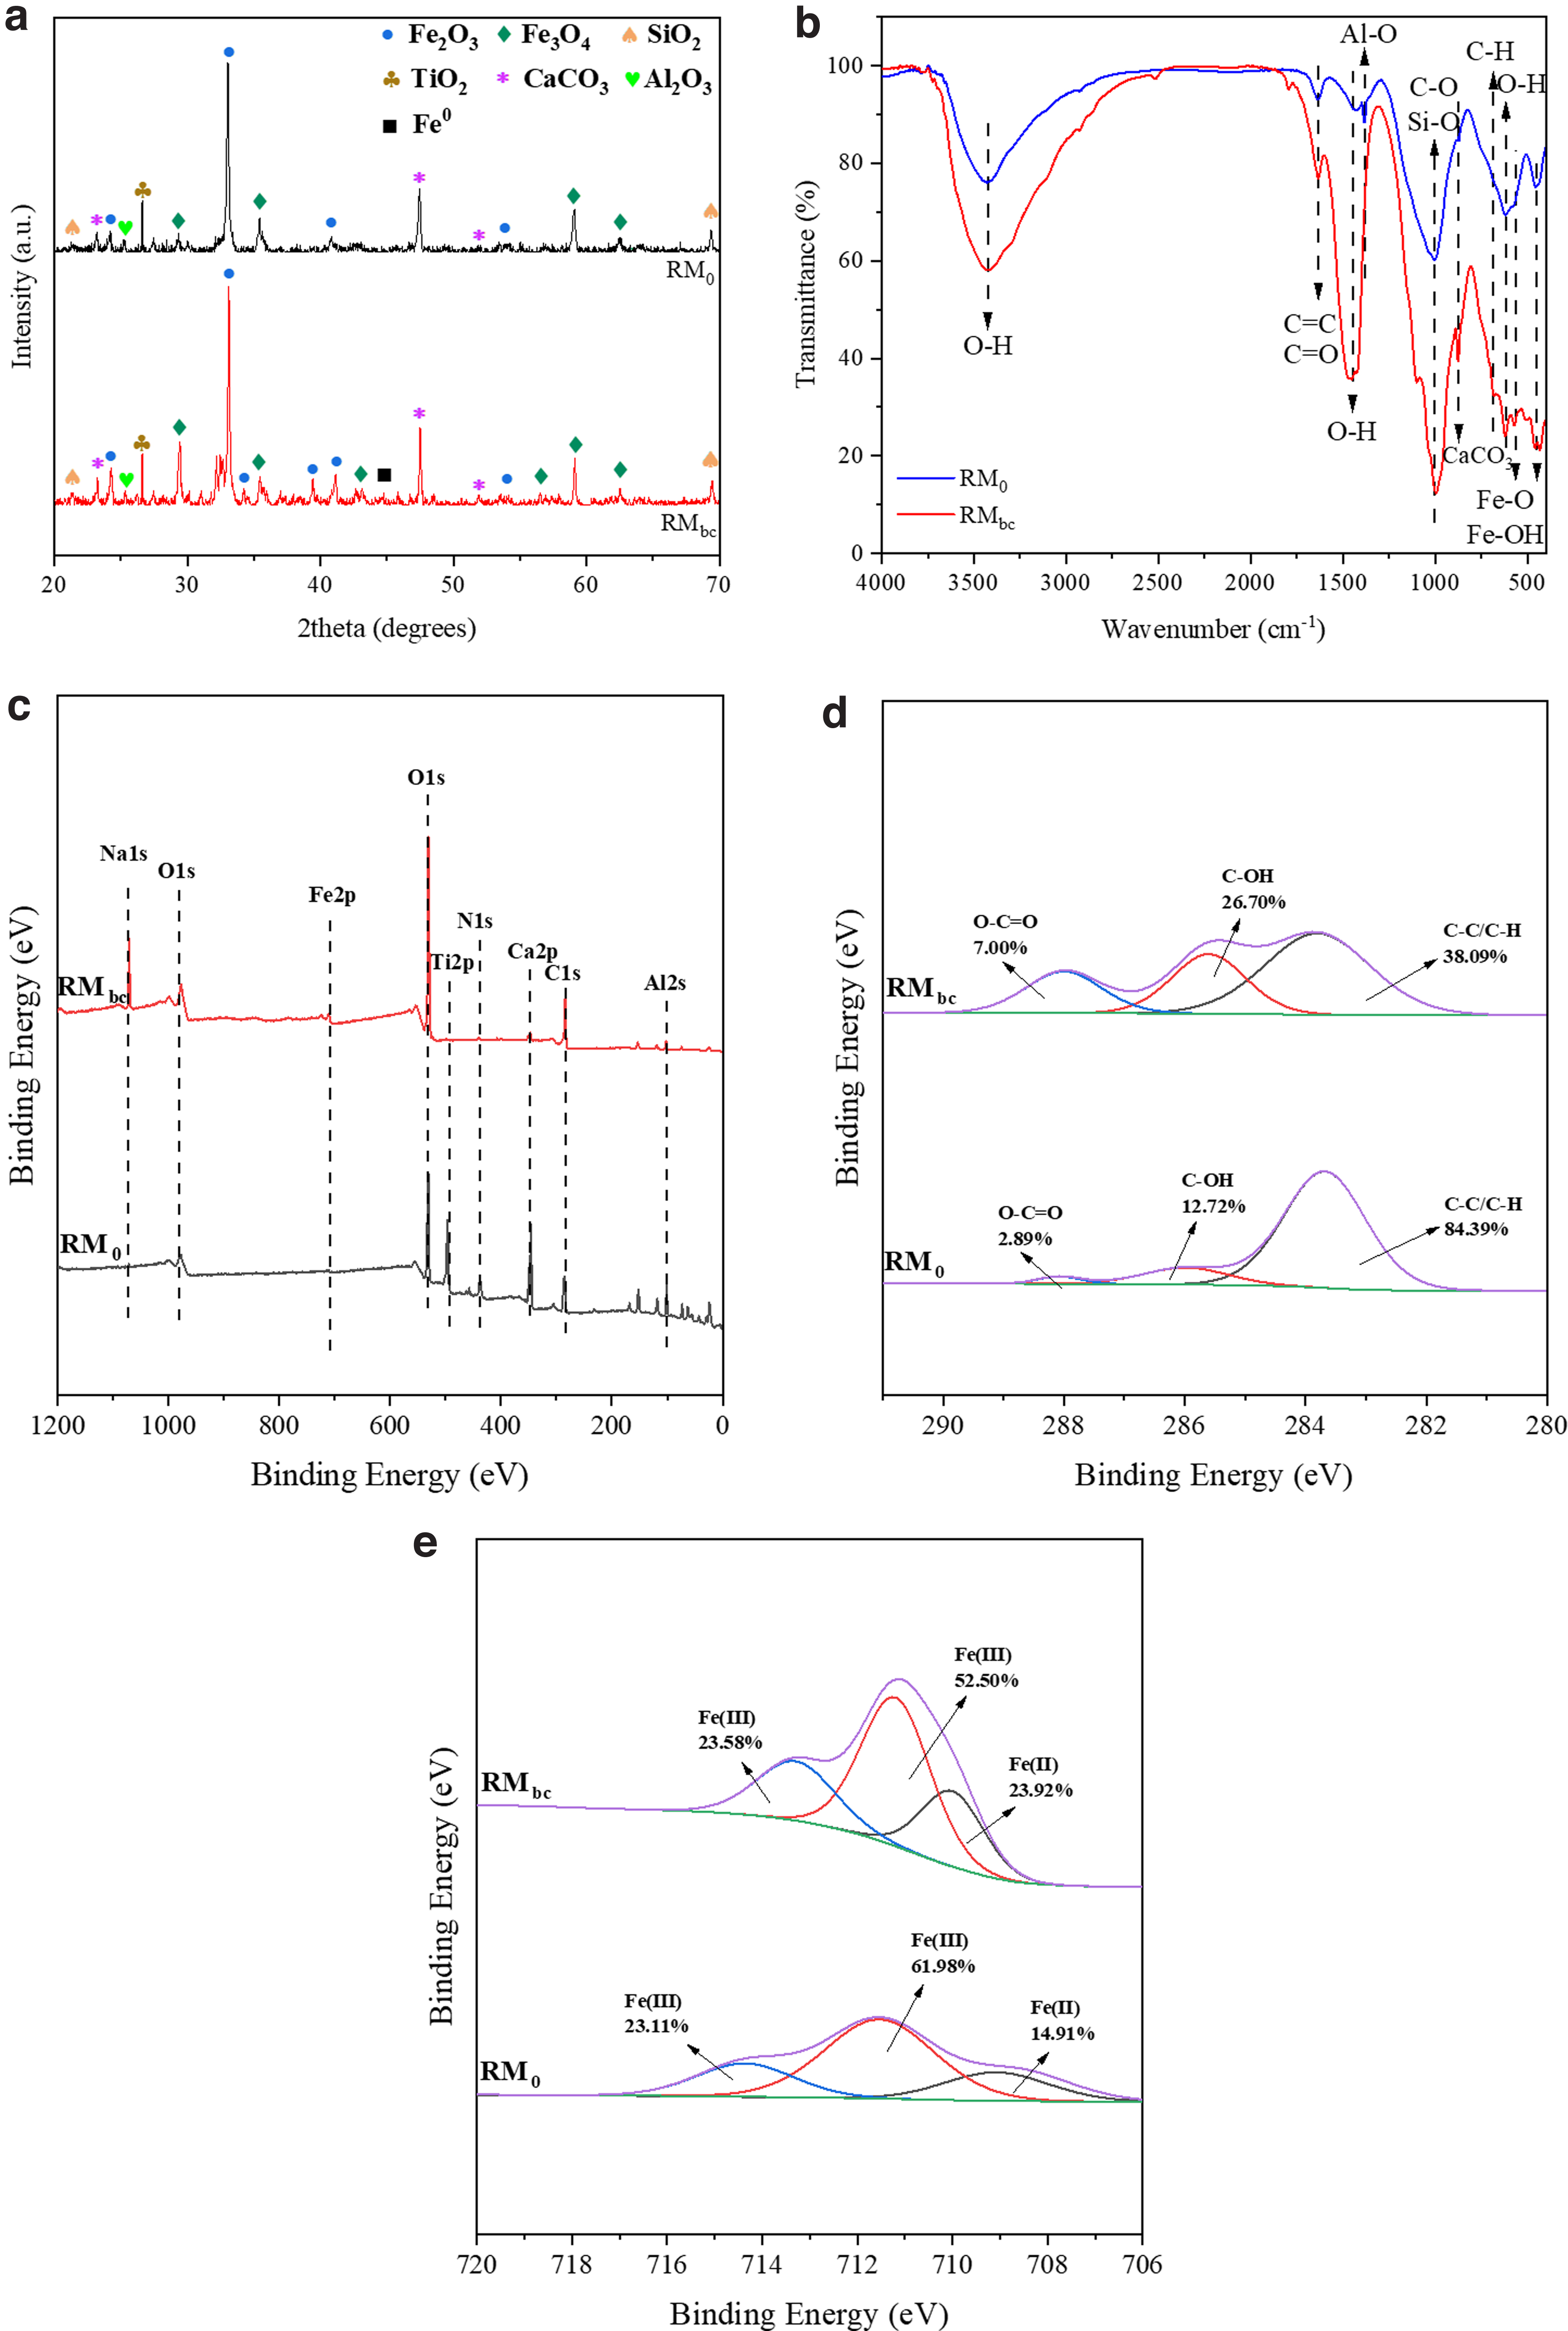
The distribution of Fe element-related phases was dominated by hematite (Fe2O3, JCPDS No. 33-0664) with peaks at 24.1°, 33.2°, 40.9°, and 54.1° (Fig. 1a). The peaks of magnetite (Fe3O4, JCPDS No. 19-0629) occur at 29.8°, 35.4°, and 59.1°, 62.5° (Xu et al., 2019; Yang et al., 2017). The Fe2O3 diffraction signals at 24.1°, 33.2°, and 40.9° in RMbc appear to be enhanced, and the intensity of Fe3O4 peaks at 29.8° and 59.1° increased. Meanwhile, new Fe3O4 diffraction peaks are found at 43.1° and 56.9°, indicating that the conversion of Fe(III) to Fe(II) is promoted by the loading of biochar.
The XRD pattern
In addition, a 44.6° diffraction peak representing Fe0 (JCPDS No. 06-0696) was found in RMbc. The conversion from Fe2O3 to Fe3O4 and Fe0 was attributed to the reducing functional groups on the surface of the biochar and the effect on the acid modification of the red mud, in agreement with the findings of the previous studies (An et al., 2023).
Fourier transform infrared spectrum
Figure 1b showed the signal peaks at 3,420 and 1,402 cm−1 originate from the stretching and deformation vibrations of O-H groups, the peak at 1,620 cm−1 belongs to the stretching vibrations of C = C, C = O (Ma et al., 2020), the vibration peaks near 1,010 cm−1 originates from the stretching of C-O, Si-O functional groups, 659–761 cm−1 is the out-of-plane bending of O-H, the signal peak at 700 cm−1 is associated with C-H functional groups (Yu et al., 2019), and the peaks at 570 and 464 cm−1 are thought to be from Fe-O and Fe-OH in Fe2O3 and Fe3O4.
The signal peak of RMbc at 3,420 cm−1 was significantly stronger than RM0, and the presence of a significant narrow O-H peak at 1,402 cm−1 indicated that the loading of biochar effectively increased the presence of oxygen-containing functional groups in the catalyst. The signal peak intensities of C-O, C = O, and C = C functional groups were also significantly enhanced with the introduction of the charcoal material.
X-ray photoelectron spectroscopy
The intensity of C1s and O1s on the catalyst was significantly increased in RMbc, and the peak of Fe2p was enhanced after loading biochar (Fig. 1c), The detailed spectra of C1s indicated that the biochar introduced a variety of functional groups such as C-OH, which enriched the type and content of functional groups on the catalyst surface (Fig. 1d). Meanwhile, Fe(II) and Fe(III) were present in both RM0 and RMbc, and the peak percentage of representative Fe(II) in RMbc increased from 14.91% to 23.92% (Fig. 1e), indicating the conversion of Fe(III) to Fe(II).
The reasons for the increase in Fe(II) content can be divided into two pathways: the overall increase of Fe content and the reduction of Fe(III). First, impurities present in the raw red mud were eliminated and the specific surface area of the biochar was broadened by acid modification and introducing of biochar, which promoted the enrichment of Fe (Ioannidi et al., 2020; Luo et al., 2019). Second, the formation of Fe(II) was attributed to the reducing functional groups on the surface of the biochar and the effect on the acid modification of the red mud (An et al., 2023). Mass fraction was used to evaluate the Fe content, the Fe(II) content were 2.30 w/w% for the original red mud, and 8.76 w/w % for the RMbc due to the XRF and XPS results.
Catalytic performance
Effects of degradation conditions
RMbc showed high removal reaction rate and good removal effect than RM0 (Supplementary Fig. S2). With the catalyst dosage increased from 0.3 to 1.0 g/L, the removal rate ranged from 73.4% to 92.5% (Fig. 2a). When the dosage was further increased to 1.3 g/L, the removal rate and reaction rate no longer increased, due to the excess of catalyst in the reaction system and the quenching of the generated radicals by each other [Eq. (4)] (Zhu et al., 2019), At the same time, the active sites such as Fe(II) at the reaction interface also trap the excess radicals, resulting in higher PDS consumption [Eq. (5)].

Catalytic performance of RMbc under different catalyst dosage
With the initial pH range from 9 to 11, the degradation rate of MO was significantly inhibited, and with the decrease of pH to acidic conditions (pH = 3–6), the degradation rate increased to 92.5% and 94.2%, respectively, indicating that the acidic conditions could enhance the catalytic activity and improve the catalytic efficiency (Fig. 2b). The acid treatment reduced the effect of NaOH in the red mud on the reaction pH by neutralizing the alkalinity to enhance the reaction performance. Under alkaline conditions, SO4•− reacts with OH− to form •OH [Eqs. (6–9)], which in turn affects the removal efficiency of MO under alkaline conditions (Sun et al., 2021).
Figure 2c showed that the MO removal rate and reaction rate increase gradually with the increase of PDS dosage, and the adsorption capacities of RM0, BC, and RMbc for MO removal was low (Supplementary Fig. S3). The increase of PDS dosage has less effect on the final removal rate of the reaction, due to the free radicals are quenched by the equations [Eqs. (10–12)] reacts with PDS. With the initial concentration of pollutants increases (Fig. 2d), the accumulation of excess pollutants leads to the accumulation and competition of intermediates, which eventually affects the removal effect (Guo et al., 2021; Wang et al., 2019).
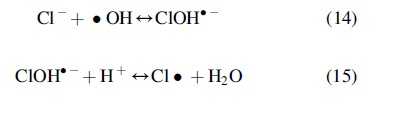
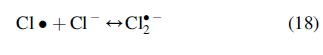
Thermal activation has a less facilitating effect on the RMbc/PDS system (Fig. 2e). Due to the low adsorption capacity of RMbc, the removal of MO was less affected by adsorption, and therefore there is no competition for adsorption with anions. The coexistence of Cl− promoted the removal effect, due to the Cl− facilitated the reaction by reacting with SO4•− based on the following reaction equations [Eqs. (13–18)] (Gu et al., 2019; Xu et al., 2017). CO32– exhibited an inhibitory effect on the removal of pollutants due to the ability of CO32– and HCO3– [Eqs. (19–22)] (Xu et al., 2021). The coexistence of NO3− has less effect on pollutant removal, HPO42– reduces the performance by reacting with SO4•− and •OH to form HPO4•− [Eqs. (23) and (24)].
Reusability of catalyst
The reusability of the catalyst was evaluated by five recycling experiments. Supplementary Figure S5b showed the MO removal performance of the RMbc/PDS system at different cycle times, with MO removal rates of 92.50% and 84.35% in the first and second cycles, respectively. The degradation efficiency gradually decreased with the number of cycles, and finally reached 66.50% of MO removal after the fifth cycle. RMbc has good reusability than RM0, which was only 34.77% removal ratio during the fifth cycle, indicating that the catalyst reuse performance enhanced under biochar loading. Supplementary Figure S5c shows that the dissolution of Fe was only 0.046 mg/L after the first cycle and eventually stabilized at about 0.031 mg/L after the fifth cycle, indicating less dissolution of Fe in the reaction.
Supplementary Figure S5d shows that the loading of BC improved the recycling ability of the catalyst, with about 0.18 g of catalyst recycled mass remaining after several cycles.
Catalytic mechanism
Identification of ROS
The quenching experimental results of the RM0/PDS showed that the degradation of MO was mainly affected by the combined effect of SO4•−, •OH, and O2•− (Supplementary Fig. S6a). But in the RMbc/PDS system, the main reactive radicals of the reaction were O2•− and 1O2 (Fig. 3a), indicating that the loading of biochar had a greater effect on the removal of MO, and its oxidation pathway changed from a free radical pathway to combine radical and nonradical pathways (Li et al., 2020b). On the contrary, typical O2•− and 1O2 were found at RMbc/PDS system (Fig. 3), which indicated that MO is mainly removed by the radical pathway by RM0/PDS system, and the coexistence of radical and nonradical pathways as major ROS in the RMbc/PDS system.

Quenching experiments
Possible mechanism of PDS activation
XRD analysis in Supplementary Fig. S5b shows that Fe(II) is involved in the catalytic reaction, which produces SO4•− by activating PDS (Huang et al., 2022b), and (Fig. 4) showed that the mechanism of RMbc/PDS system. SO4•− production is mainly through the activation of PDS by Fe(II) [Eq. (25)], the XPS spectra of Fe2p also indicated the role of Fe(II) (Supplementary Fig. S7h) (Sun et al., 2022). In contrast, SO4•− can react with OH− and convert to •OH [Eq. (26)], which was the main pathway of •OH production (Huang et al., 2022b).
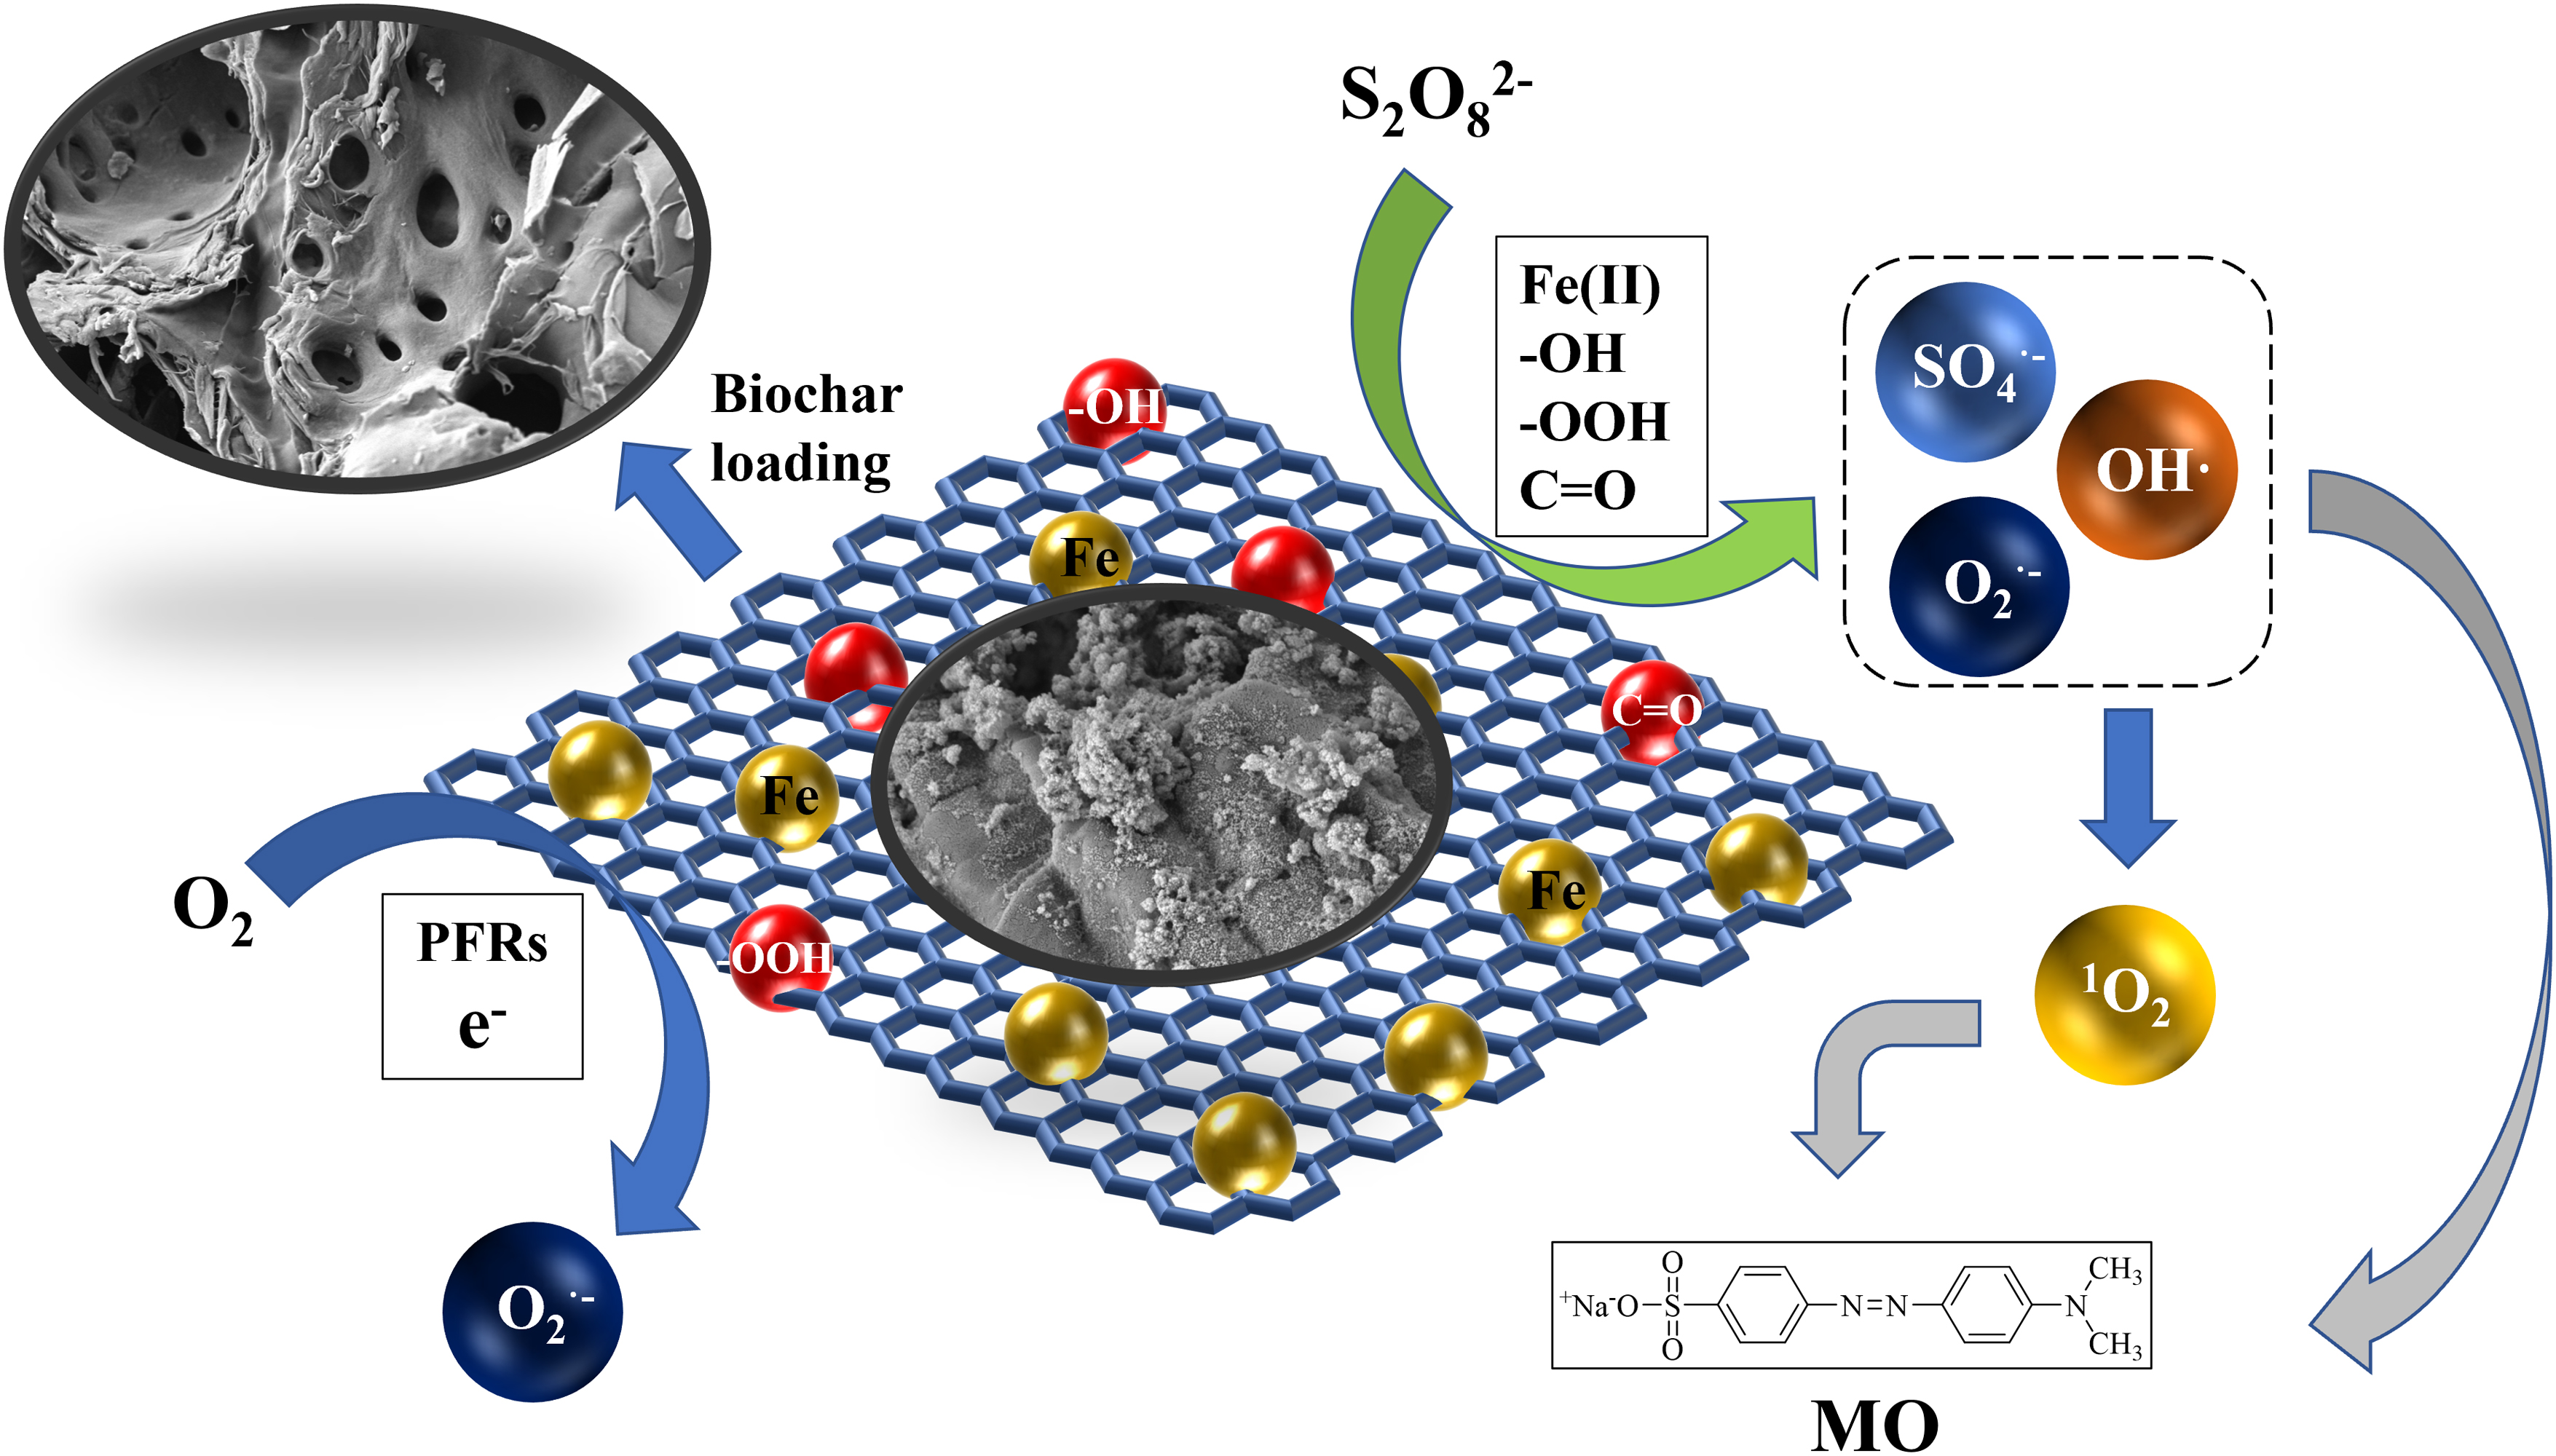
The mechanism of RMbc/PDS system.
The biochar acted as an electron donor and passes to the surface adsorbed PDS to generate SO4•− [Eq. (27)] (Ren et al., 2022). The -OH and -COOH on RMbc surface can also be involved in the activation of PDS as active sites (Zhou et al., 2021), The intensity of O-H, C-O, and C = O peaks observed in FTIR decreased after the reaction (Supplementary Fig. S7d), and the large changes in the ratio of O-C = O and C-OH before and after the reaction were found in the XPS analysis (Supplementary Fig. S7), proving the involvement of -OH and -COOH in the reaction [Eqs. (28) and (29)] (An et al., 2022a). The absence of C-N and N = N in the FTIR spectra is due to poor adsorption of MO by RMbc.
Meanwhile, the persistent free radicals (PFRs) on the catalyst surface are usually manifested as a stable binding to the external or internal surface of solid particles (Luo et al., 2021b), PFRs on the RMbc surface produce •OH through [Eq. (30)]. Fe0 enhanced the reaction efficiency and reproducibility by directly activating PDS and reducing Fe(III) to Fe(II) [Eqs. (31–33)] (Luo et al., 2021a; Ren et al., 2022). The abundant presence of functional groups such as C = O promoted the production of 1O2 [Eqs. (35–40)].

Possible pathway of MO degradation
The intermediates of MO degradation were determined by QE-Plus, and the corresponding intermediates measured are shown in Supplementary Table S4, and their possible degradation pathways in this study system are shown in Supplementary Fig. S8. MO degradation mainly include continuous deamidation and direct cleavage of azo bonds. As the intermediates were more toxic than the primary contaminant, the Toxicity Estimation Software Tool by EPA prediction was used to evaluate the acute toxicity, bioaccumulation factor, developmental toxicity, and mutagenicity of MO and its degradation intermediates (Xia et al., 2023). As shown in Supplementary Fig. S10, degradation of MO is generally a process of reduced biotoxicity, except for a few products.
The application of RMbc in integrated dye wastewater
Removal performance of RMbc for mixed dyes and coexisting pollutants
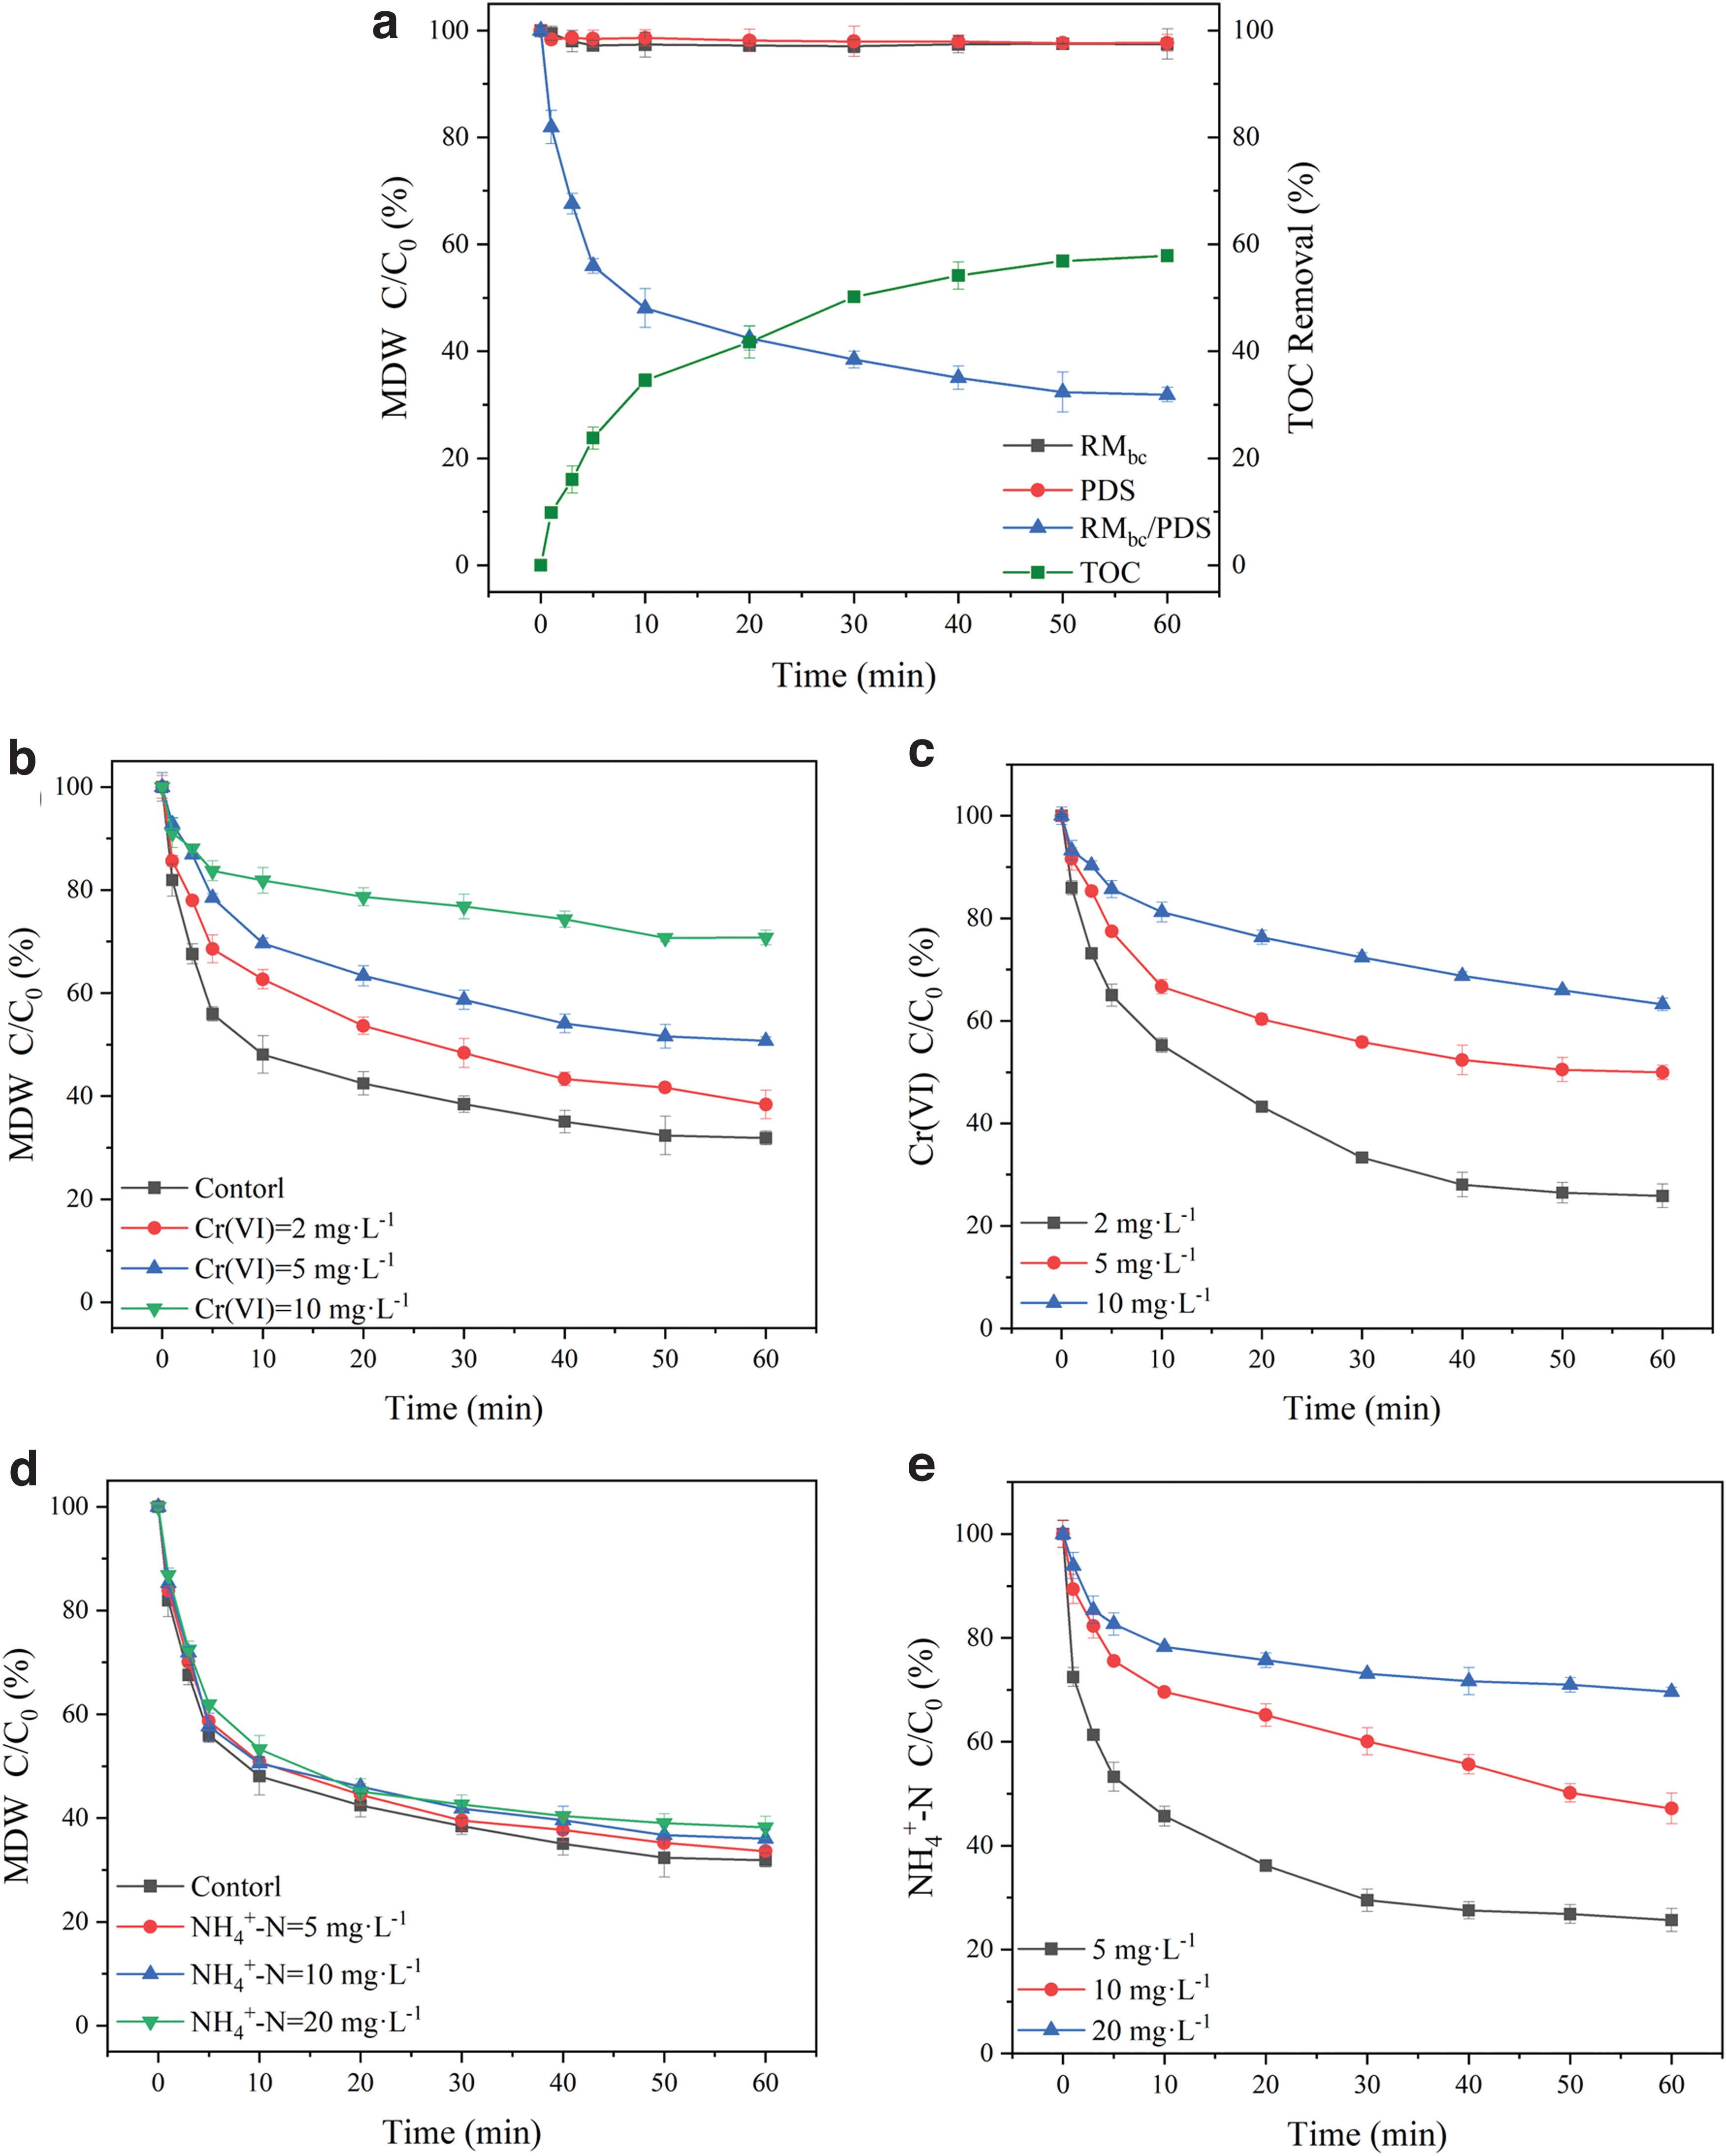
Dye wastewater typically contains multiple dyes simultaneously. Since various dyes may relate to different removal characteristics, studying only a single dye to explore the value of the catalyst application is limited. Figure 5a shows that the adsorption on mixed dye wastewater is weak due to the complexity of pollutant types in the mixed wastewater and the loading of red mud occupied the specific surface area of BC. The removal rate of RMbc/PDS system reached 68.1% in 60 min (Fig. 5a). The coexistence of Cr(VI) had a significant effect on the removal performance which may be attributed to the competition of Cr(VI) for O2•− [Eq. (41)]. The effect of different concentrations of NH4+-N coexistence on the removal of combined dye wastewater was less due to the SO4•−reaction with NH4+-N to form NH2− [Eqs. (42) and (43)].
Removal performance for MDW
Performance of RMbc in continuous flow fixed bed applications
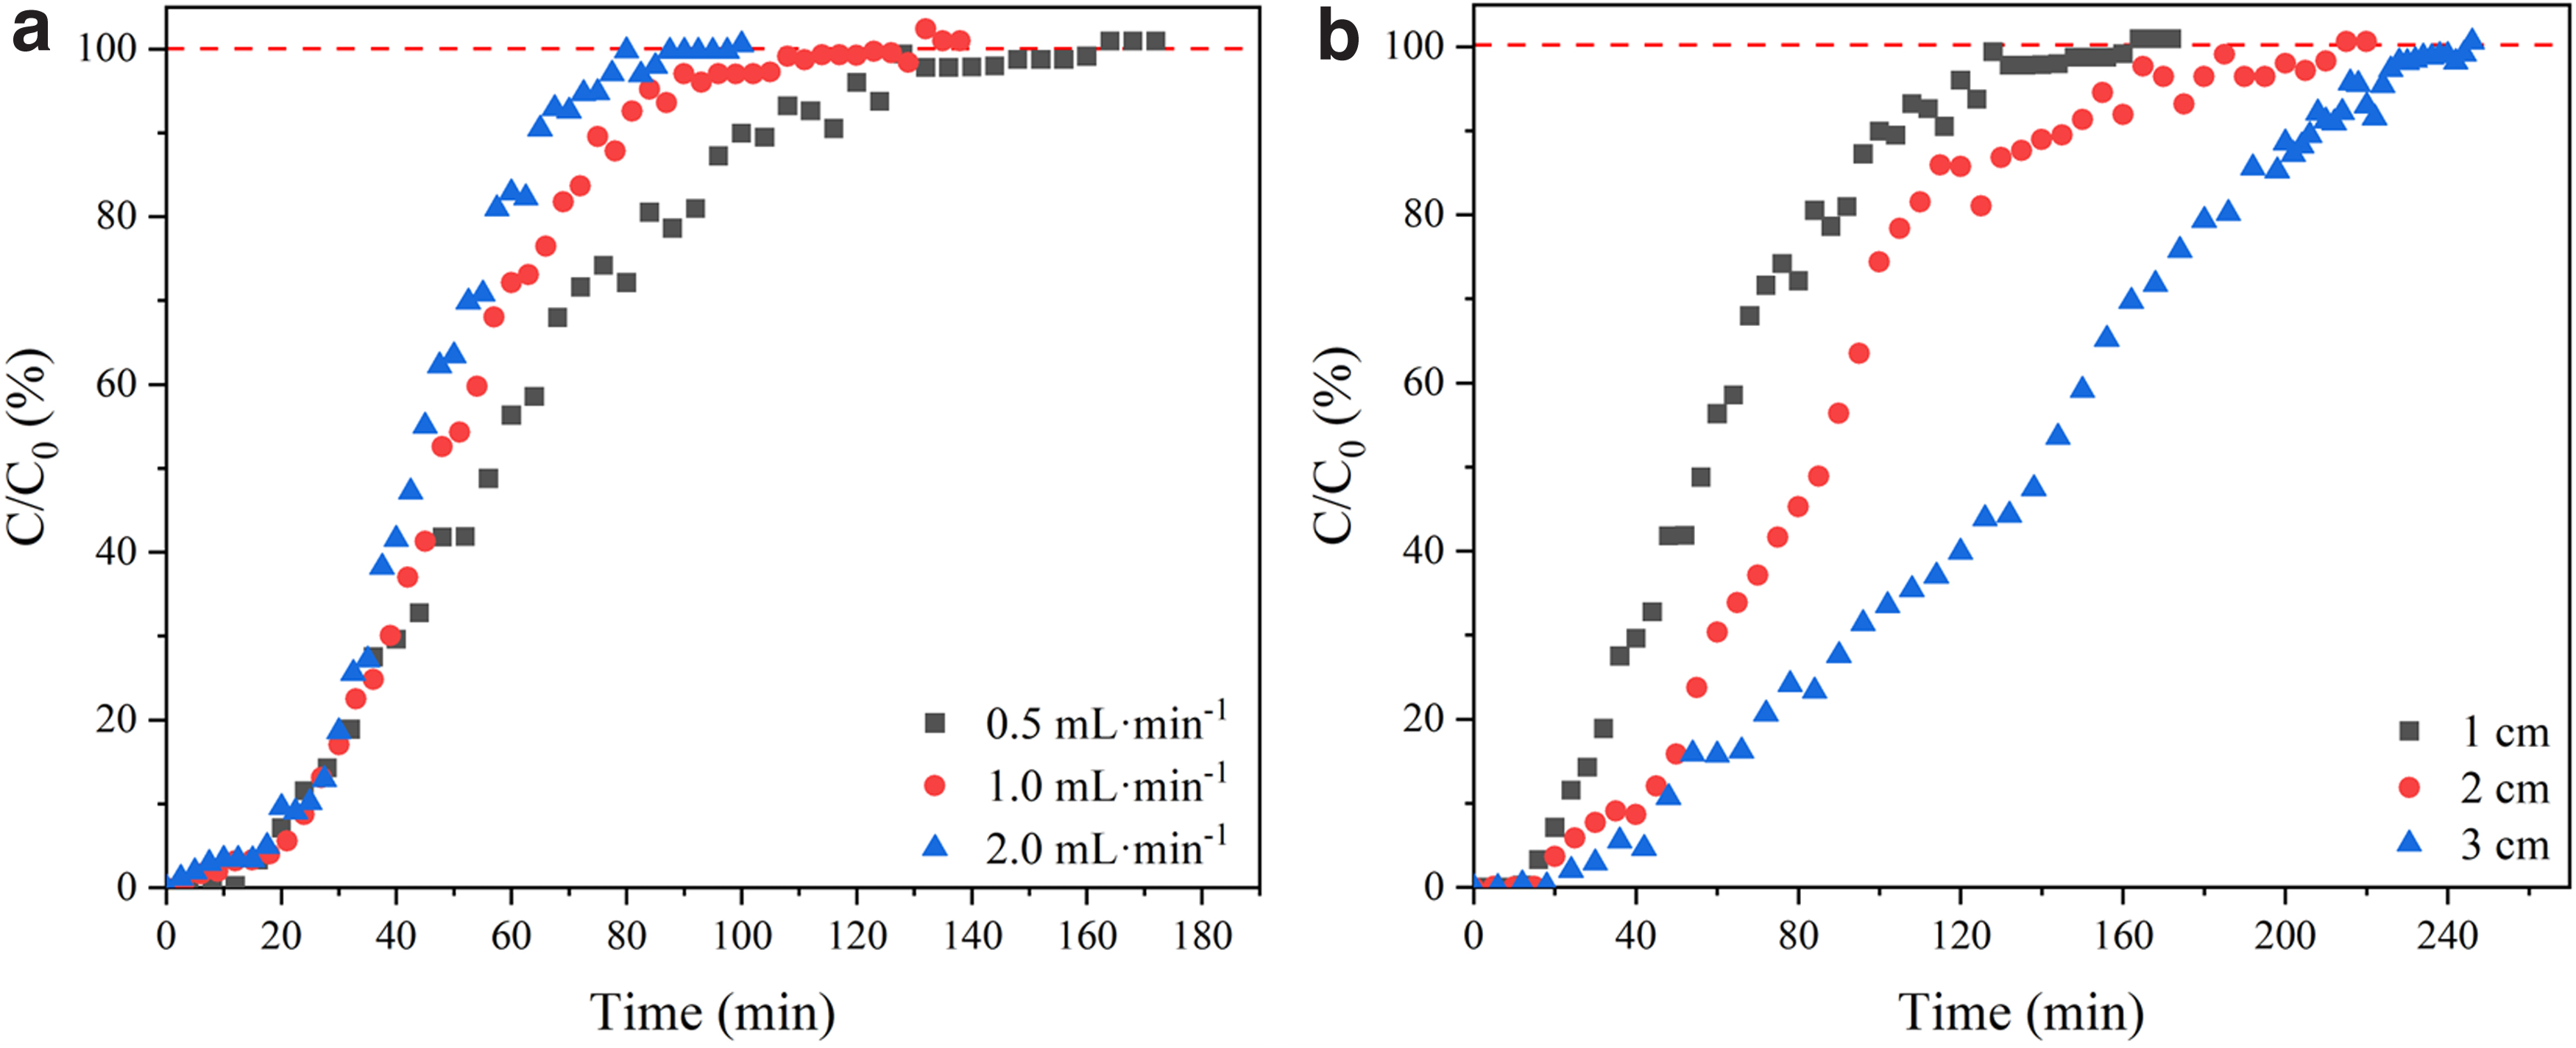
The RMbc/PDS system showed good potential for application in fixed-bed experiments (Fig. 6). The Yoon-Nelson model was widely used to simulate penetration curve (Huang et al., 2022a). The Yoon-Nelson model curves and parameters of RMbc for mixed dye wastewater treatment under different flow rates and layer heights are shown in Table 2 and Supplementary Fig. S11. The Yoon-Nelson model fitted the penetration curves of the fixed-bed experiments well (R2 > 0.95) and the RMbc exhibited good removal capacity for mixed dye wastewater and showed potential application prospects.
The application of RMbc for MDW treatment under different flow rates
Parameters of Yoon-Nelson Model for RMbc/PDS System at Different Conditions
PDS, sodium persulfate.
Conclusions
A novel heterogeneous catalyst RMbc was successfully synthesized by red mud biochar. SEM showed that RMbc was porous and red mud was successfully loaded on biochar. XRD analysis revealed that Fe2O3 in RM was reduced to Fe0 and Fe3O4. The RMbc exhibited excellent PDS activation ability and nearly 92.5% of MO removal was achieved within 60 min at reaction conditions of 20 mM PDS, 100 mg/L MO, and 1.3 g/L RMbc. The mechanism studies demonstrated that PDS was mainly activated by Fe0 and Fe(II) in RMbc to produce 1O2 and O2•−. The possible removal mechanism and degradation path of MO were also proposed. In the end, this study demonstrated that this RMbc system would have great potential for the removal of various organic pollutants in water.
Footnotes
Acknowledgments
We sincerely thank the College of Environment and Ecology of Chongqing University for its research facilities, as well as the editors and anonymous reviewers for their valuable comments.
Authors' Contributions
Z.L.: Conceptualization, Methodology, Validation, Formal analysis, and Writing-original draft. S.D.: Investigation, Formal analysis, and Writing-original draft. Q.A.: Formal analysis, Validation, Supervision. B.Z.: Formal analysis, and Data Curation. Z.Y.: Resources, Visualization, and Writing-Review and Editing. B.X.: Visualization Writing-Review and Editing, and Resources. W.Z.: Writing-Review and Editing, Resources.
Author Disclosure Statement
No competing financial interests exist.
Funding Information
This work was supported by the National Natural Science Foundation of China (Grant No.51209240) and Technology Innovation and Application Demonstration of Chongqing Science and Technology Planning Project (Project No. cstc2018jscx-msybX0308).
References
Supplementary Material
Please find the following supplemental material available below.
For Open Access articles published under a Creative Commons License, all supplemental material carries the same license as the article it is associated with.
For non-Open Access articles published, all supplemental material carries a non-exclusive license, and permission requests for re-use of supplemental material or any part of supplemental material shall be sent directly to the copyright owner as specified in the copyright notice associated with the article.