
Abstract
A calcium phosphate solid formed as an unintended consequence of a novel high-pH orthophosphate lead corrosion control strategy in Providence, RI, resulting in some consumer complaints and clogged plumbing. Investigations were carried out at pH levels of 8.9–10.4, at temperatures of 5–60°C, and with orthophosphate concentrations ranging from 0 to 4.0 mg/L as orthophosphate (PO4) to examine this phenomenon. During field testing, the calcium phosphate initially precipitated at orthophosphate doses above about 2 mg/L as PO4, and the extent of precipitation increased with water age and higher temperature. Laboratory-scale tests confirmed that doses above about 2 mg/L as PO4 were required to form the precipitate in the absence of preexisting calcium phosphate solids and that the solid formed quickly at 60°C (upper range for hot water heaters) and tended to dissolve at lower pH. Solubility studies and solids characterization indicate that the particles are a mixture of noncrystalline compounds containing calcium and phosphate. For water systems currently practicing a high pH/low alkalinity corrosion control strategy, orthophosphate dosing can enhance plumbosolvency control without the risk of pH reduction, but formation of this solid can place an upper limit on the maximum orthophosphate residual level in the distribution system.
Introduction
In 2005, Providence Water decreased their finished water pH from about 10.4 down to about 9.7 after modeling studies predicted that reducing the pH could minimize the lead solubility. These modeling studies were conducted as a proactive measure to reduce lead levels in Providence, RI. Prior to 2005, the 90th percentile lead levels for Lead and Copper Rule (LCR) monitoring in Providence were close to, but still below, the U.S. Environmental Protection Agency (EPA) LCR action level of 15 µg/L Pb (Masters and Edwards, 2015). Although dissolved lead seemed to decrease as predicted, later research suggested that it was likely that this well-intentioned strategy may have undermined iron corrosion control and inadvertently increased the release of particulate and total lead (Masters and Edwards, 2015). In 2006, Providence exceeded the U.S. EPA LCR action level and has been working to optimize corrosion control ever since (Masters and Edwards, 2015).
A consent order issued by the Rhode Island Department of Health required an advisory panel to evaluate corrosion control strategies that could be effective in Providence’s unique situation of very high pH, low alkalinity, and low hardness water (Supplementary Table S1) with extensive unlined iron water mains and lead service lines (LSLs) [Rhode Island Department of Health (RI DOH, 2012)]. From March 2014 to January 2016, Providence Water conducted lead pipe loop testing to examine the efficiency of orthophosphate as a lead corrosion inhibitor at pH 10.3, which is far above the pH 7.2–7.8 range of normal utility experiences for optimal lead corrosion control by orthophosphate dosing (Schock, 1989; Schock et al., 1996). Previous work investigated the efficacy of using orthophosphate above the typical predicted optimal pH range (up to pH 9) for a small range of dissolved inorganic carbon (DIC) and a very low concentration of calcium (0.7 mg/L Ca) (Miller, 2014; Schock et al., 2008; Welter et al., 2015).
The pipe loop results showed promise for the high pH plus orthophosphate strategy in controlling lead better than the pH/DIC optimization approach (Bae et al., 2020; Masters et al., 2016). Given the prior problems arising from slightly reducing pH down to 9.7, it was considered unwise to attempt greater reductions to the much lower pH range that orthophosphate is normally used, owing to concerns about lead solubility (Schock et al., 1996) and the release of preexisting scale with associated contaminants (Masters and Edwards, 2015; Schock, 2005).
There were concerns about a white calcium phosphate solid formed in the high pH water. In a simulation using a phosphate dose of 3.0 mg/L as PO4 at pH 10.3, Bae et al. (2020) concluded that the vast majority of the precipitation occurred in the water held in lead pipes and did not significantly occur in the bulk water, in which case the formation of the precipitate would not be a problem at the treatment plant or during transport through the water main distribution system. However, during partial system testing in 2018, a few consumers started to report white precipitates in the water heater and fixture clogging, prompting the utility to investigate this issue further. Dosing of phosphate normally reduces such consumer complaints because orthophosphate is an effective antiscalant (Lin and Singer 2006; Lin and Singer, 2005). In this unique case, phosphate could be acting as a scalant, causing issues such as inefficient heating and/or potential heating element burnout in water heaters (Devine et al., 2021), clogged pipes, and aesthetic issues for consumers. Moreover, there were concerns that if precipitation removed enough of the phosphate residual, it could undermine the novel phosphate–high-pH strategy for lead corrosion control for Providence and analogous systems.
Although there are no previously reported full-scale studies on the effects of phosphate addition to high-pH drinking water sources, there have been some laboratory- and pilot-scale studies (Bae et al., 2020; Schock et al., 1996) and many studies on calcium phosphate precipitation in wastewater for phosphate removal (Albertson and Sherwood, 1969; Lei et al., 2018; Lei et al., 2017; Menar and Jenkins, 1972). Very high pH (above 10.5) is typically required to achieve calcium phosphate precipitation (Menar and Jenkins, 1972), but precipitation can occur at lower pH if preexisting solids are present (Albertson and Sherwood, 1969; Menar and Jenkins, 1972).
Here we explore the kinetics, equilibrium, and identity of the calcium phosphate precipitate by doing the following: (1) examining the nature of the problem at both partial system (where water treated with orthophosphate was only distributed to part of the Providence Water distribution system) and full scale, (2) replicating and exploring the practical nature of the problem at bench scale in hot and cold water, and (3) identifying the type of solid precipitates that are forming.
Materials and Methods
Providence Water partial system test of orthophosphate
In the partial system test, treated water from the Providence Treatment Plant was dosed with orthophosphate (using phosphoric acid) at the Fruit Hill Pump Station (FHPS). The pH of the water was adjusted using sodium hydroxide (NaOH) immediately after the phosphoric acid addition to adjust the pH back up to the target pH of 10.4 (Supplementary Fig. S1). The orthophosphate was started at a dose of 0.5 mg/L as PO4 in January 2018 and gradually increased to 3.7 mg/L as PO4 by April 2018. The phosphate dose was reduced to 3.0 mg/L as PO4 in December 2018, to 2.15 mg/L as PO4 in July 2020, and then to 2.0 mg/L as PO4 in September 2020.
Water samples for orthophosphate were collected regularly at the FHPS just downstream of the orthophosphate and NaOH addition, as well as at the water storage tank 2–3 h downstream of the pump station (Supplementary Fig. S1), and analyzed using the Hach Method 8048. Orthophosphate concentrations were measured for water samples collected from seven sampling stations within this partial system test zone with detention times ranging from 0.75 h to 96 h downstream of the FHPS.
Testing of solids from consumers and filter test at FHPS
A sample of a white solid collected from a clogged aerator was sent to Virginia Tech’s laboratory in 2019. In October 2020, after the orthophosphate dose was reduced to 2.0 mg/L as PO4 in the partial system test, an experiment was conducted to determine whether a calcium phosphate solid was forming at the FHPS between the point of addition of orthophosphate/NaOH and a sampling point approximately 5 min downstream. Four liters of this water were passed through a 0.45 µm pore size filter. These samples were analyzed for metal (calcium and phosphorus) concentrations using a Thermo Electron iCAP-RQ inductively coupled plasma mass spectrometer (ICP-MS) per Standard Method 3125-B (Clesceri et al., 1998). Samples and calibration standards were prepared in a matrix of 2% nitric acid by volume. The minimum reporting levels (MRLs) for calcium and phosphorus are 50 ppb and 2 ppb, respectively.
Solubility and temperature interactions (bench-scale testing)
Bench-scale testing was designed to examine the controlling role of pH, temperature, and preexisting solids in calcium phosphate precipitation. It was speculated that precipitation could be occurring at higher rates in residential hot water heaters based on the relationship between temperature and loss of phosphate observed in the drinking water distribution system.
Water with preexisting particles
Nineteen liters of water from Providence were dosed with orthophosphate at a concentration of 5 mg/L as PO4 (using phosphoric acid) and then NaOH to increase the pH back up to the target of 10.4. After mixing at a low speed for 4 h, the white solids settled to the bottom of the container and were concentrated by decanting.
This standard preexisting particle solution had a dissolved orthophosphate concentration of 1.6 mg/L as PO4 and a total orthophosphate concentration of 10.1 mg/L as PO4. A dozen homogenized aliquots were adjusted to pH 9.8, 10.1, or 10.4 (36 samples in total). At each pH, triplicate samples were adjusted to a target temperature of 5°C, 20°C (room temperature), 48°C, or 60°C. The 5°C samples were placed in an ice bath to drop their temperature, and the samples at the two higher temperatures were placed in temperature-controlled water baths (Fisher model 220-4) set to 48°C and 60°C, respectively. All samples were maintained in a closed system for 4 h of shaking at a low speed before determining soluble and total concentrations after filtration through a 0.4 µm pore size, hydrophilic polycarbonate membrane (47 mm in diameter), vacuum filter. To maintain a closed system, pH and temperature were only measured at the end of the 4-h period at their respective temperatures. Results from these experiments were used to determine the solubility product constant Ksp of calcium phosphate (Supplementary Table S2).
Water without preexisting particles
Two-liter batches of water from Providence were adjusted to target orthophosphate concentrations of 1.0, 2.0, 2.3, 2.8, 3.0, and 4.0 mg/L as PO4, and each batch was brought to pH 10.4 using NaOH. After 5 min of mixing, a sample of each solution was filtered through a 0.45 µm pore size syringe filter to measure the soluble orthophosphate concentration to determine whether solids were present immediately after the orthophosphate addition. Aliquots of each target orthophosphate condition were then heated to 48°C for 2 h. After being held at 48°C for 2 h, the pH and temperature of each aliquot were measured, and a sample was filtered through a 0.45 µm pore size syringe filter to measure the soluble orthophosphate concentration (Supplementary Table S3). Aliquots at orthophosphate conditions of 2.0, 2.3, 2.8, and 3.0 mg/L as PO4 were also held at room temperature for 24 h and then heated to 48°C for 2 h. The pH, temperature, and dissolved PO4 concentrations were recorded for each condition (Supplementary Tables S4 and S5).
Analysis methodologies
pH and temperature
Temperature and pH of all water samples produced in the laboratory were measured using a Fisherbrand accumet AP110 portable pH meter with automatic temperature correction at the start of the experiment (before temperature adjustment) and after 4 h at the selected temperatures (before filtration).
Inductively coupled plasma mass spectrometry
As mentioned previously, the water samples were analyzed for metals (calcium and phosphorus) concentrations using a Thermo Electron iCAP-RQ ICP-MS per Standard Method 3125-B (Clesceri et al., 1998). Samples and calibration standards were prepared in a matrix of 2% nitric acid by volume. The MRLs for calcium and phosphorus are 50 ppb and 2 ppb, respectively.
Precipitate concentration and Ca:P molar ratio
In routine experiments, the precipitated calcium and phosphate for each condition were calculated by subtracting the dissolved concentration (filtered sample) from the total concentration. In a few cases, the precipitated calcium and phosphate were collected on a filter paper that had a known fixed volume of water, dissolved in strong acid, and then measured on the ICP-MS.
Solid analysis
Samples from the Providence Water system were sent to the EPA’s Andrew W. Breidenbach Environmental Research Center in Cincinnati, OH, from 2016 to 2019 for solids analysis (Harmon et al., 2022). This included two LSLs associated with Providence’s experimental pipe loop testing (Pipe Loop 1 and Pipe Loop 2) exposed to phosphate doses of 1–3 mg/L as PO4 between March 2014 and January 2016. Three samples were collected from the Providence partial system test, including a solid that was collected just downstream of the orthophosphate feed at the FHPS. The EPA also received two LSLs that had been exposed to the partial system test orthophosphate treatment for approximately 18 months, both of which were removed from the system in June 2019 (Service Line 1 and Service Line 2).
For this study, the outermost layer of the service line scales containing the white solid precipitate was carefully isolated and removed using a variety of brushes, metal picks, and tweezers. This layer was relatively thin and fragile, and some of the material consisting of lead pipe corrosion solids directly beneath the white solid precipitate was incorporated into the final subsample. The lead corrosion solids identified may be sampling artifacts not present in the white solid precipitate.
These samples were crushed with an agate mortar and pestle and then passed through a 75 µm sieve prior to powder X-ray diffraction (PXRD) analysis for crystalline compounds identification. Samples were analyzed using a PANalytical X’Pert Pro theta-/theta powder diffractometer using Cu Kα radiation generated at 1.8 kW (45 kV, 40 mA) and an X’celerator Real Time Multiple Strip detector. Samples were spun at 1 revolution/s to improve particle statistics. Patterns were collected in continuous scan mode, from 5° to 89.994° 2θ at a scan speed of 0.017684°/s or 0.01181°/s, with data binned into 0.0167113° steps. Diffraction patterns were analyzed using Jade+ version 9.8 software and the 2020 International Centre for Diffraction Data Powder Diffraction File (ICDD PDF-4+) database.
Epoxy cross sections of the LSLs were also made to be analyzed using scanning electron microscopy/energy dispersive spectroscopy (SEM/EDS) (Harmon et al., 2022). SEM images of cross-sectional areas of interest and elemental maps were collected on the SEM at high vacuum, 20 kV, and in secondary (SE) and back-scatter detection mode (BSD). In addition, some material from each sample (prior to being crushed and sieved) was affixed to carbon adhesive tabs on aluminum SEM stubs and coated with a layer of carbon to improve conductivity. This method of preparation allowed for the analysis of the surface characteristics of the material. SEM images were captured in both high and low (20 Pa) vacuum mode, at 10 kV, and in BSD mode.
Elemental characterization of the FHPS precipitate was carried out using X-ray fluorescence spectroscopy. A fused glass bead (0.140 g of sample with a lithium borate to lithium bromide flux [49.75% Lithium borate (Li2B4O7), 49.75% Lithium metaborate (LiBO2), 0.50% Lithium bromide (LiBr)]) was analyzed on a Panalytical Axios Advanced PW4400, with the resultant spectra analyzed via SuperQ software. For total inorganic carbon (TIC) of the FHPS sample, 17.14 mg of solid was dissolved in 2% perchloric acid to convert solid carbonate to CO2 and then analyzed for TIC by a UIC Inc. Model CM5017 CO2 coulometer.
Results and Discussion
Providence Water partial system test of orthophosphate
During the increase of the orthophosphate dose from 0.6 to 2.4 mg/L as PO4 (January 2018 to March 2018), there was very little difference in phosphate concentration between the FHPS and the most distant sampling location at Rimwood (calculated detention time of 96 h downstream). However, after doses reached 3.7 mg/L as PO4 in April 2018, the amount of phosphate loss occurring during travel to Rimwood began to steadily increase. By fall of 2018 and again in summer-fall of 2019, very high losses of phosphate (up to 2.7 mg/L as PO4) occurred between the FHPS and the Rimwood sampling point (Fig. 1, red arrow).
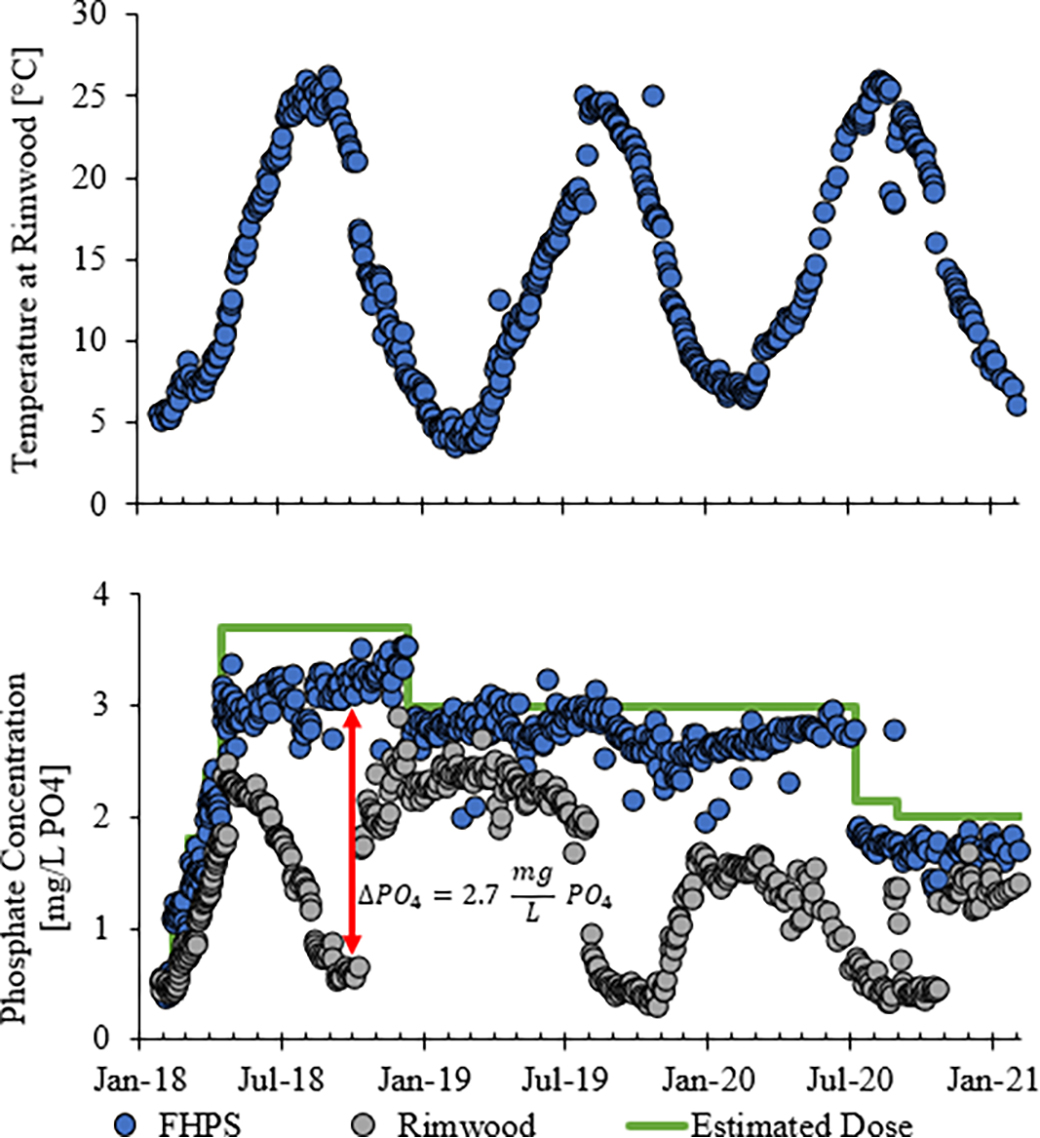
The phosphate concentration results (Fig. 1) appeared to be dependent on temperature. In June 2018, after temperatures rose above 20°C, the loss in phosphate between the FHPS and Rimwood sampling point was greater than 1 mg/L as PO4. Once the temperature dropped below 20°C in October 2018, the loss in PO4 began to steadily decrease to about 0.5 mg/L PO4 by January 2019. A similar trend occurred in July 2019 when the temperature rose above 20°C; however even after the temperature dropped below 20°C in October 2019, the loss of PO4 remained greater than 1 mg/L PO4.
For the first two years of the partial system test (2018 and 2019), when the initial dose of orthophosphate was above 3.0 mg/L as PO4, orthophosphate loss followed one linear trend line from April to August when the temperature was increasing (blue solid circle in Fig. 2) and a different trendline from August to January when the temperature was decreasing (orange solid square in Fig. 2). When the phosphate dose was dropped down to 2.2 mg/L as PO4 in July 2020 to reduce the driving force for precipitation, more than 1 mg/L of orthophosphate was still lost. We speculate that the gradual accumulation of solids in the water distribution system when the water warmed in late spring and summer of 2018 and 2019 maintained higher than normal kinetics of precipitation, compared with water without preexisting particles, when the water cooled in the fall and winter of 2018 and 2019.

Loss of phosphate from FHPS to Rimwood sampling location vs. temperature, when temperature is increasing (blue circle) and when temperature is decreasing (orange square). Note: dose of 2.15 mg/L PO4 began in July 2020 therefore there was limited data for decreasing temperature for that condition. FHPS, Fruit Hill Pump Station.
The losses of orthophosphate from the FHPS to sampling points that were at 0.75, 1.5, 5, 9, 10, and 96 h travel distance in the distribution system were calculated. During the initial dose increase in early 2018, at distribution system sampling points up to 1.5 h from the FHPS, if the dose was below 2 mg/L as PO4, there was insignificant loss of phosphate. However, at much higher doses (up to 3.7 mg/L as PO4), the losses could be as high as 1.8 mg/L as PO4. In contrast, for sampling points at 9 h travel distance in the distribution system, the loss of phosphate was significant. Losses exceeding 0.25 mg/L as PO4 occurred at doses as low as 1.1 mg/L as PO4 (Fig. 3).

Calculated loss in orthophosphate within the system vs. concentration of phosphate leaving the FHPS at sampling locations 1.5 h (green), 9 h (orange), and 96 h (blue) from FHPS. Circles without fill are samples from 2020 after the dose was dropped to 2.2 mg/L. Note that the concentration leaving the FHPS (x-axis) was lower than the initial orthophosphate dose. FHPS, Fruit Hill Pump Station.
However, in July 2020, after the dose was dropped to 2.2 mg/L as PO4, the loss of orthophosphate was anomalously high relative to prior experience. More than 0.25 mg/L as PO4 was lost from a quarter of the samples collected at the location 1.5 h travel distance from the FHPS (unfilled green circle in Fig. 3), and 100% of the samples collected at 9 and 96 h (unfilled orange and blue circle in Fig. 3) had a loss of orthophosphate greater than 0.25 mg/L as PO4. The higher losses in 2020 versus prior years was believed to be due to the solids accumulated over the years in the distribution system.
It is important to note that the concentration leaving the FHPS (plotted in Fig. 3) was lower than the initial orthophosphate concentration, indicating that some precipitation occurred immediately after dosing. Plumbing fixtures downstream of the PO4 pump were clogged and had to be removed for cleaning in June 2020 and again in August 2020 (Supplementary Fig. S2).
Testing of solids from consumers and filter test at FHPS
A white precipitate was collected from a clogged consumer aerator in summer 2019. ICP-MS analysis of the precipitate found that it was comprised of calcium and phosphate in a Ca:P molar ratio of about 1.5:1. More intensive testing was conducted at the FHPS just 5 min after the caustic and phosphate dosing, when it was noted that the 0.45 µm pore size filter clogged up multiple times during filtration of a 4-L sample. Elemental analysis of the filtered solids showed a total of 0.37 mg/L of PO4, and 0.24 mg/L of Ca had precipitated in this sample just 5 min after the point of phosphate and caustic addition. The solid filtered from the FHPS was also found to have a calcium to phosphate (Ca:P) molar ratio in the captured solid of about 1.5:1. This investigative sample showed that calcium phosphate was precipitating well before the residential plumbing. A portion of the filtrate from the FHPS was sent to EPA for further characterization (detailed in “Solid analysis” section below).
Solubility and temperature interactions (bench-scale testing)
Water with preexisting particles
At 20°C (room temperature), with an excess of the preexisting calcium phosphate solids formed at pH 10.4 (Fig. 4), soluble phosphate dissolved as a roughly linear function of pH 10.3 down to pH 9.6. Similar results were observed at 5°C (data not shown). However, when the temperature was raised to 48°C, corresponding to the lower recommended temperature range for water heaters, the phosphate precipitated from its initial soluble value of 1.6 mg/L as PO4 at final pH 9.6 to 9.8 but dissolved at lower pH (8.8–9.4). The relationship between soluble phosphate and pH was again roughly linear (Fig. 4). However, at 60°C, which is in the higher range for water heaters, all but one sample had a soluble phosphate concentration below 0.25 mg/L as PO4 at final pHs 8.9–9.6 (Fig. 4).
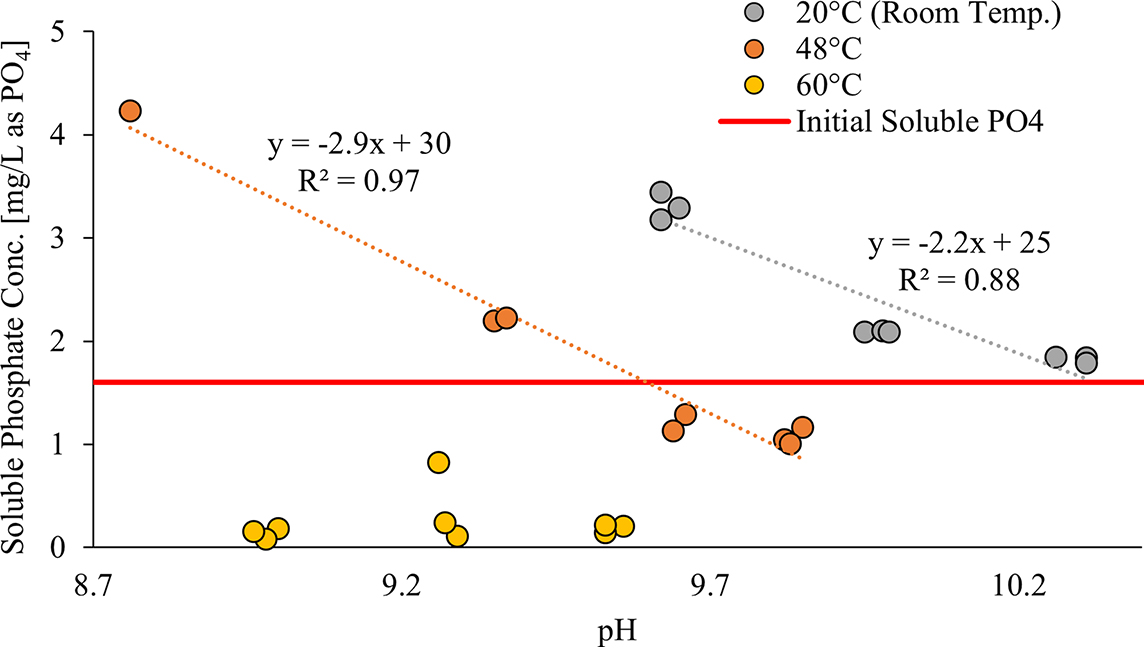
Soluble phosphate concentration vs. pH at 20°C (room temperature) (gray), 48°C (orange), and 60°C (yellow) for conditions with excess of preexisting solids. The horizontal line indicates the initial level of soluble phosphate before lowering the pH or raising the temperature. Note: the pH of the sample is the pH after being held at the selected temperature for 4 h. pH measurements were taken before the sample was filtered.
The fact that the phosphate was removed quickly and had a ratio of around 1.7:1 calcium to phosphate for solids removed by a filter was considered conclusive evidence that the loss was chemical precipitation rather than microbiological uptake.
Determining a practical solubility constant (Ksp) applicable in the Providence system
An attempt was made to determine whether a practical solubility constant could describe experimental observations. We determined that the calcium to phosphate ratio ([Ca]/[P]) in the solid was about 1.7 (Ca:P = 5:3) at temperatures 5°C, 20°C, and 48°C. This ratio was roughly consistent with a hydroxyapatite [i.e., Ca5(PO4)3(OH)], which has a Ca:P ratio of 5:3 (1.7:1). To develop a predictive model, we then calculated the effective Ksp (Supplementary Table S2) for this solid for each type of samples. Unfortunately, we found that the calculated practical Ksp assuming the achievement of equilibrium varied by 2–5 logs at each temperature to fit the data (Table 1).
Calculated KSP/PKSP Range for each Temperature Condition
There are many explanations as to why the Ksp values could not explain trends in the data. They include the possibility that none of these systems were at equilibrium, that there is more than one solid present, or that each of the solids present can have a range of Ksp values dependent on its age and crystallinity. Prior work in other fields have shown that experimental methods for measuring Ksp often produce different values, resulting in a wide variation in published Ksp values (Mañas et al, 2012; Pan and Darvell, 2009). Regardless of the cause, it was clear that no simple solubility model could be developed to accurately predict precipitation of calcium phosphate observed in this research.
Water without preexisting particles
In the absence of preexisting particulates, the inception of precipitation (i.e., nucleation) often requires a large degree of supersaturation. Thus, it was not surprising that phosphate doses up to 2 mg/L as PO4 at room temperature did not form detectable precipitate after 5 min or even after 24 h at room temperature at pH 10.4 (Fig. 5). Phosphate doses above about 2 mg/L as PO4 did cause some precipitation at room temperature, and the extent of the precipitation increased with time. For instance, at an initial dose of 3.1 mg/L as PO4, 0.3 mg/L as PO4 precipitated after 5 min and 1.0 mg/L as PO4 precipitated after 24 h at room temperature.
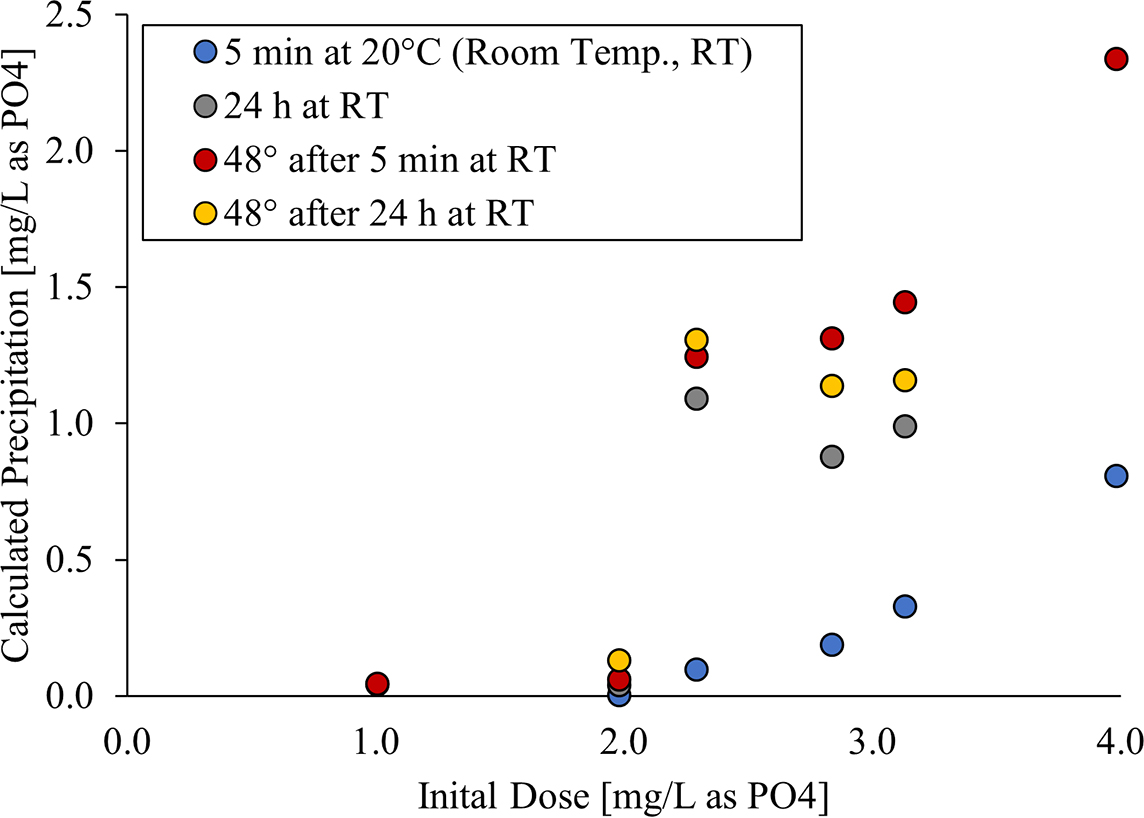
Calculated phosphate precipitation, for experiments without preexisting particles, after 5 min at room temperature (blue), 24 h at room temperature (gray), 2 h at 48°C after 5 min at room temperature (red), and 2 h at 48°C after 24 h at room temperature (yellow) vs initial dose at pH 10.4.
There were also several experiments illustrating that, once precipitation had occurred, the level of soluble phosphate could drop well below 2 mg/L as PO4, confirming an ironic practical result that dosing of less phosphate produced a higher net soluble residual available for corrosion control than dosing of higher phosphate. For example, when we dosed 2.3 mg/L as PO4 to the water, the final dissolved phosphate concentration at room temperature was 1.2 mg/L as PO4 after 24 h, and after heating the water to 48°C for only 2 h to simulate a water heater, it dropped to 0.99 mg/L as PO4. In contrast, dosing phosphate at the threshold of 2 mg/L as PO4 caused no precipitation at either temperature, and the phosphate residual remained constant at 2 mg/L as PO4.
Solids analysis
The solids analysis focused on white particles from (1) the FHPS, which precipitated in the absence of a LSL substrate; (2) Lead Pipe Loops 1 and 2; and (3) LSLs 1 and 2.
The precipitate collected from the FHPS was a white-colored solid deposited in 200–300-µm-thick dendritic masses of platy crystals (Supplementary Fig. S3). In the lead pipe loops, the uppermost layer removed from the scales (Pipe Loop 1 and Pipe Loop 2) consisted of a white material that coated almost the entire surface of the pipe (Supplementary Fig. S4A, B). The material was very finely crystalline and formed a semitransparent crust that allowed for the lower layers to still be visible in the photographs. Similarly, the uppermost layer removed from the partial system test service lines (Service Line 1 and Service Line 2) was a white crystalline material that provided a consistent coating along the length of both received pipe sections (Supplementary Fig. S4C, D). Two distinct morphologies of this material were noted, platy rosettes and botryoidal masses (rounded forms). The platy rosettes are easily visible in (Supplementary Figure S4) as the discrete white spots noted by the black arrows, and the botryoidal masses exist below and around the rosettes and are not easily visible in the photographs but are identifiable in the SEM (Supplementary Fig. S5).
The PXRD pattern of the FHPS precipitate had many peaks (Fig. 6). The intense peak at ∼8.4° 2θ (d-spacing =10.49 Å) may be enhanced by preferred orientation owing to the platy habit of the component crystals. Elemental analysis showed that the FHPS precipitate was composed of predominately Ca and P (Table 2). The total inorganic carbon is very low, indicating the solid is not a carbonate. The calcium to phosphate (Ca:P) ratio in the solid is about 1.6:1 on an atomic % basis. This ratio is close to the Ca:P ratio calculated from the filter test for the FHPS (1.5:1). However, despite the simple chemical makeup of the material, the pattern is not readily explained by any single simple Ca-, P-, O-, H-containing phase in the 2020 ICDD PDF-4+ database or even a combination of such phases.
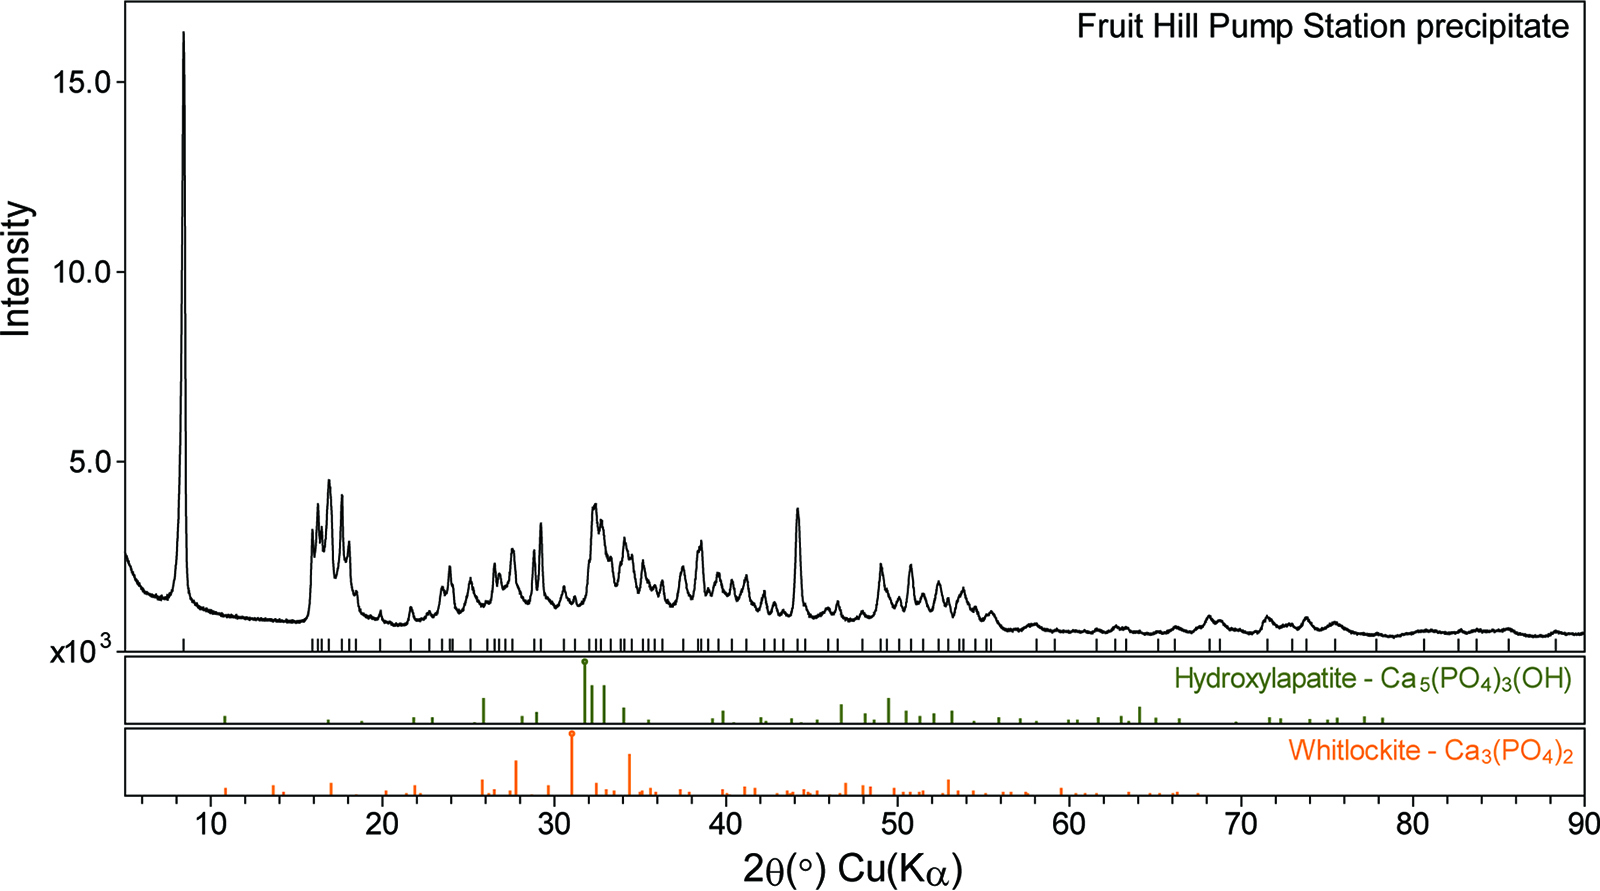
PXRD pattern of calcium phosphate precipitate collected from the Fruit Hill Pump Station.
Elemental Analysis of FHPS Precipitate
Note. Owing to limited material, a complete elemental analysis from all the samples was not possible. FHPS, Fruit Hill Pump Station; TIC, total inorganic carbon.
PXRD analysis of the upper scale layer from the pipe loop and partial system test service line samples shows that in all cases, the white-colored crystalline material is very similar to that of the FHPS precipitate (Supplementary Table S6). The prominent peak at ∼8.4° 2θ and a set of seven distinct peaks between 15° and 18° 2θ (Supplementary Fig. S6) are particularly diagnostic, as they are not obscured by diffraction peaks of underlying lead corrosion solids (hydrocerussite and others) picked up during sampling (Supplementary Table S6).
SEM/EDS analysis of the pipe scale cross-sections (Pipe Loops 1 and 2 and Service Lines 1 and 2) also showed Ca, P, and O as the main elements present in the uppermost layer of the pipe scale materials. There were other elements detected (Fe, Mn, Si, and Pb), but those were associated with lower scale layers (Supplementary Fig. S7 and S8). Although the phase or phases of this material remain unknown, the consistency among the PXRD patterns for all the materials analyzed (FHPS, Pipe Loops 1 and 2, and Service Lines 1 and 2) suggests that this unknown material remains roughly the same regardless of when or where the material was formed within Providence’s system.
Conclusions
In the Providence system, calcium phosphate precipitation increased with higher phosphate doses, higher temperatures, and the presence of preexisting solids, as expected based on chemical modeling, bench-scale experiments, and prior research in wastewater treatment plants. The Ca:P ratio ranged from 1.5:1 to 1.7:1, likely due to evolution of the solid as a function of temperature, water chemistry differences, and aging. The inability for the solids analysis to identify a specific crystalline structure for the isolated calcium phosphate solids, combined with a wide range of Ksp values, indicates that there is most likely more than one solid phase present. In the Providence system, formation of this precipitate effectively limited the dose of phosphate for corrosion control to 2 mg/L PO4 or lower.
Since January 2021, Providence Water has been dosing orthophosphate system-wide. The dose was incrementally increased from 0.5 to 1.5 mg/L as PO4 over the course of about 2 months beginning in January 2021 and has remained at 1.5 mg/L as PO4 since. The dose of the partial system was also reduced to 1.5 mg/L as PO4 at this time. The issue of calcium phosphate solids formation has continued at a level of under 18 consumer complaints each year out of approximately 80,000 service locations.
Some utilities seeking to improve corrosion control under the revised LCR or other regulatory rules may be considering dosing of orthophosphate at higher pHs, as well as recommending higher water heater set points as is commonly recommended to control Legionella in premise hot water lines (Richards et al., 2018). These changes increase the likelihood of calcium phosphate precipitation in water mains or in premise plumbing. When calcium phosphate precipitation occurs, higher doses of phosphate can actually produce lower doses of soluble orthophosphate residual for corrosion control, while also creating consumer concerns associated with clogging and discoloration from the resulting solids. It is hypothetically possible that calcium phosphate could coat LSLs and protect it from corrosion, but this was not proven in this research.
Using bench-, pilot-, and full-scale studies, stakeholders should proactively anticipate the aforementioned possible secondary impacts of calcium phosphate precipitation if water is distributed at higher pHs. Future research to better predict formation of the solid(s) would need to study the effects of temperature, preexisting solids, and the interplay between calcium, pH, and orthophosphate on solubility.
Footnotes
Acknowledgments
The authors thank Kristin Jameson for her assistance with the experimental work. A previous version of this article was included in Dr. Christina Devine’s dissertation (Devine, 2021).
Notice
The research described in this article has been funded in part by the U.S. EPA. It has been subjected to review by the Office of Research and Development and approved for publication. Approval does not signify that the contents reflect the views of the Agency, nor does mention of trade names or commercial products constitute endorsement or recommendation for use.
Authors’ Contributions
C.D.: executed the project, conducted the experiments, and led the write up for this article. K.M.: provided all of the utility data used in this paper and help coauthors understand how the partial system test was conducted. J.T., M.D., and M.S.: analyzed the solid samples described in this article and were responsible for writing the methods and results/discussion for the solid analysis. M.E.: conceived the laboratory and field experiments, advised C.D. on the work as a Virginia Tech PhD student, and coauthored the work.
Author Disclosure Statement
No competing financial interests exist.
Funding Information
This study was funded through the Technical Assistance Project (TAP) grant from Providence Water and was also partly funded under grants awarded by Spring Point Partners LLC to Virginia Tech. The opinions expressed in this report are those of the author(s) and do not necessarily represent the official position of Spring Point Partners LLC.
References
Supplementary Material
Please find the following supplemental material available below.
For Open Access articles published under a Creative Commons License, all supplemental material carries the same license as the article it is associated with.
For non-Open Access articles published, all supplemental material carries a non-exclusive license, and permission requests for re-use of supplemental material or any part of supplemental material shall be sent directly to the copyright owner as specified in the copyright notice associated with the article.