




Abstract
Recovery of carbon, nitrogen, and phosphorus resources can be accomplished through treatment of the anaerobic fermentation supernatant from waste activated sludge (WAS). However, the anaerobic fermentation process is significantly influenced by pH values. In this article, thickened sludge from a secondary sedimentation tank of a wastewater treatment facility in Zhengzhou was used to conduct a batch test to examine the effect of pH values between 5.0 and 11.0 on the recovery efficiency of carbon, nitrogen, and phosphorus in sludge fermentation liquid. The results showed that the production of volatile fatty acids and the total suspended solids degradation rate of sludge reached the highest levels at pH 10.0, with 2481.35 mg/L and 54.11%, respectively, which was 1.45 times higher than the results of the unadjusted pH group. The highest efficiency of nitrogen and phosphorus recovery in the supernatant of anaerobic fermentation was achieved at pH 10.0, with the mole ratio of Mg2+/NH4+-N of 1.5 and the mole ratio of PO43−/ NH4+-N of 1.0, yielding 96.55%. The actualization of sludge resource usage and the recovery of carbon, nitrogen, and phosphorus resources from WAS could be achieved simultaneously in this study.
Introduction
Huge production of municipal sewage and waste activated sludge (WAS) in wastewater treatment plants (WWTPs) has become a serious problem owing to the significant increase in urban population. In addition, it is estimated that global WAS production will reach 103 million tons/year of WAS produced worldwide in 2025, which would have significant negative environmental impacts (Xu et al., 2021). Sludge has a substantial quantity of recyclable resources like carbon, nitrogen, and phosphorus, while it may also contain heavy metals, parasites, pathogens, and poisonous organic compounds, which are difficult to degrade (Khursheed and Kazmi, 2011). Therefore, it is significant to seek a WAS treatment method of reduction, utilization, and decontamination.
It has been widely recognized that excessive discharge of nitrogen and phosphorus into water bodies can cause eutrophication (Kumar and Pal, 2015). Readily biodegradable carbon sources, such as volatile fatty acids (VFAs) produced during sludge hydrolysis and acidification, are required for both nitrogen and phosphorus biological removal in WWTPs (Longo et al., 2015). According to reports, 6–9 mg of VFAs are needed to remove 1 mg of phosphorus (Comeau, 1989; Yan et al., 2021; Yuan et al., 2006). However, anaerobic fermentation of sludge to create VFAs is required to achieve the purpose of satisfactory carbon recycling and biological removal efficiency of nitrogen and phosphorus. The sludge anaerobic digestion process consists of the following three stages: hydrolysis fermentation, hydrogen production, and acetic acid production and methane production (Luo et al., 2019). By controlling the operational conditions, it is possible to retain sludge anaerobic digestion at the acidogenic stage and prevent methanogenic bacteria from using VFAs and increase the production of VFAs.
One of the most crucial variables influencing the anaerobic digestion of sludge is pH (Fang et al., 2020). Research indicates that the hydrolysis–acidification effect of sludge is optimal under alkaline conditions (Cassini et al., 2006; Shao et al., 2012). At the same time, the production of protein, carbohydrate, and total organic carbon (TOC) is higher (Hart et al., 2022). The rate-limiting phase in the three stages is hydrolysis, and as the rate of hydrolysis rises, so does the overall rate of anaerobic digestion. As a result, many experts and academics have suggested various pretreatment methods, such as thermal treatment, mechanical, chemical, biological, thermal phase graded anaerobic digestion (TPAD), microwave pretreatment, etc., to improve the biodegradability of sludge (Rani et al., 2012).
It is known from the findings of Saerens et al. (2021) that the recycling of nitrogen and phosphorus resources in the form of struvite from excess activated sludge has good economic and environmental benefits. This can help avoid secondary pollution. The key variables influencing the formation of struvite, according to relevant research, are pH, Mg/N (mole ratio of Mg2+/NH4+-N) and P/N (mole ratio of PO43−/ NH4+-N) (Zhang and Chen, 2009). Struvite can exist steadily in only an alkaline environment, and its theoretical molar ratios of 1:1:1 for NH4+, PO43−, and Mg2+. After sludge fermentation, the concentrations of NH4+ and PO43− in the fermentation broth were determined. By adding just enough PO43− and Mg2+ to the anaerobic fermentation broth to get its molar ratio up to the required level for the experiment, struvite was produced. The following is the reaction equation for the production of struvite:
This process improved the separation efficiency of sludge and fermentation broth while recovering nitrogen and phosphorus. Struvite is a great slow-release nitrogen and phosphorus fertilizer with good financial advantages. This approach has a high rate of nitrogen and phosphorus removal compared with conventional methods, as well as fast reaction rates, rapid filtration rates (Zhang and Chen, 2009), and reduced sludge volume.
The nitrogen and phosphorus resources in WAS were recovered in this study, using alkaline anaerobic fermentation technology and the struvite precipitation method. First, the effects of pH on the production of VFAs by anaerobic fermentation of WAS were investigated in a series of batch experiments, from pH 5.0 to 11.0, for optimal pH selection. Subsequently, the optimal pH condition was applied in examining the influence of different fermentation times on the production of VFAs. Afterward, the effect of precipitation method on the recovery of liquid nitrogen and phosphorus in sludge fermentation was investigated under the condition of different nitrogen and phosphorus ratios. The ideal recovery parameters for nitrogen and phosphorus were finally determined.
Materials and Methods
Source of WAS and sludge fermentation liquid
The WAS used for alkaline fermentation in this study was obtained from the thickened sludge of the secondary sedimentation tank of a WWTPs in Zhengzhou, China. The sludge was concentrated at room temperature for 24 h and its supernatant was discharged and stored (Zhang and Chen, 2009). The characteristics of WAS are shown in Table 1. Nitrogen and phosphorus were recovered from the fermentation liquid of WAS. The parameters of the fermentation liquid are listed in Table 2.
Characteristics of Concentrated Sludge
BOD5, biochemical oxygen demand; NH3-N, ammonia nitrogen; TOC, total organic carbon; TP, total phosphorus; TSS, total suspended solids; VSS, volatile suspended solids.
Basic Properties of Mixed Fermentation Broth
TOC, total organic carbon.
Effect of pH on sludge fermentation
Eight identical batch reactors, each containing 80 mL of WAS, were used to conduct batch tests at room temperature (20–22°C). The total suspended solid (TSS) and volatile suspended solid (VSS) of WAS were 1.7150 g/L and 1.0672 g/L, respectively, and these were then distributed equally to the eight reactors. For reactors 1, 2, 3, 4, 5, 6, to 7, the pH was controlled at 5.0, 6.0, 7.0, 8.0, 9.0, 10.0, and 11.0, respectively, by adding 2 M sodium hydroxide (NaOH) or 2 M hydrochloric acid (HCl) and adding an appropriate amount of buffer solution. The amount of buffer reagent added is shown in Table 3. The pH in reactor 8 was not adjusted and used as a blank control. Each reactor was mechanically stirred in a shaker at a speed of 120 rpm (revolutions per minute). Each set of experiments was repeated twice. After every 48 h, the supernatant was collected, and the polysaccharide, protein, and TOC contents of the fermentation broth were measured. The sludge degradation rate was measured after the completion of fermentation. The sludge degradation rate is measured after the completion of sludge fermentation to find the optimal pH value. The second sludge anaerobic digestion experiment was performed with this pH to determine the total yield of VFAs and the content of each component at different fermentation times.
The Amount of Buffer Reagent Added to Each Group
Nitrogen and phosphorus recovery
The experiment was conducted using the orthogonal experimental method in a beaker. The orthogonal experiment table is shown in Table 4. The orthogonal experimental design was 3 factors and 3 levels. These three factors were pH, Mg/N, and P/N. The pH levels were 8.0, 9.0, and 10.0. Mg/N was taken as 1.0, 1.5, and 1.9, and P:N was taken as 1.0, 1.2, and 1.4. The three factors of the experimental design are shown in Table 5. One of the reasons for designing the Mg/N and P/N ratios greater than 1:1 is that some soluble chemical oxygen demand (SCOD) compounds like proteins may bind to magnesium ions and not participate in the precipitation reaction (Zhang and Chen, 2009).
Orthogonal Experiment Table
Experimental Design
First, the initial nitrogen and phosphorus content of fermentation liquid were measured. Nine identical beakers, each containing 10 mL fermentation liquid, were used to conduct batch tests, and the volume of fermentation liquid was adjusted to 50 mL by adding distilled water. Second, the pH was adjusted with 2M NaOH or 2M HCl as required, and a certain amount of potassium dihydrogen phosphate (KH2PO4) solution and magnesium chloride hexahydrate (MgCl2 · 6H2O) solution were added. The dissolution rate of phosphate is slow, and this directly affects the reaction. So, it should be put into phosphate and magnesium salt first according to the ratio specified in the experiment, and the reaction process should be fully stirred. Third, after complete dissolution of the reagent, the reaction was stirred at a speed of 200 rpm. After 5 min of reaction, a portion of the solution was removed. It was then centrifuged in a centrifuge (10,000 rpm, 10 min), and the clear supernatant was poured out. The precipitate obtained was enriched with struvite. The clear supernatant was analyzed to determine the content of nitrogen and phosphorus. Compared with before the reaction, the nitrogen and phosphorus recovery rates were obtained.
Analytical methods
The pH was measured by using a meter (ZD-2, Shanghai, China). The WAS was centrifuged at 10,000 rpm for 10 min, the SCOD content (mg/L) was measured in a COD-measuring instrument. TSS and VSS were analyzed according to standard methods (Clescerl, 1998). The TOC was measured by a TOC meter. The biochemical oxygen demand (BOD) was measured by a BOD meter. The protein content was measured using the Komas Brilliant Blue method (Bradford, 1976). The polysaccharide content was measured using the phenol–sulfuric acid method (Zhang et al., 2020). The ammonia content was determined using the nano-reagent spectrophotometric method (HJ535-2009). The total phosphorus content was determined by ammonium molybdate spectrophotometry (GB11893-89).
The VFAs were measured by high performance liquid chromatography. Among them, the column (model Agilent 5 TC-C18; 250 × 4.6 mm) had a column temperature of 25°C, and a detection wavelength of 210 nm. The mobile phase consisted of 20 mmol/L−1 phosphate buffer at pH 2.20, with a flow-rate of 1.0 mL/min−1 at room temperature (Mortera et al., 2018). To determine the retention time and standard curve of each VFA component, a standard solution of each component was initially injected. Subsequently, the fermentation supernatant was added, and the peak area was used to calculate the concentration of each component in the resulting VFAs.
Results and Discussion
Effect of different pH and fermentation time on sludge fermentation products
The effects of pH and fermentation time on the TOC concentration are shown in Figure 1(a). During the initial 4 days of fermentation, the mass concentration of TOC was as follows: pH 11.0 (3998.085 mg/L) > pH 10.0 (2386.125 mg/L) > pH 6.0 (1863.050 mg/L) > pH 7.0 (1463.800 mg/L) > pH 9.0 (878.875 mg/L) > pH 8.0 (663.620 mg/L) > pH 5.0 (503.750 mg/L) > blank test (417.950 mg/L). The results indicate that the mass concentration of TOC could be significantly improved and maintained stable by controlling fermentation pH at 6.0, 10.0, and 11.0. The remaining groups did not differ much from the control group. TOC reached a maximum around day 3 at pH 6.0, 10, and 11. The TOC concentration at pH 10 remained essentially constant after reaching a maximum value with increasing fermentation time. This may be due to the fact that the amount of nutrients consumed by microorganisms at this pH is essentially the same as the amount of VFAs produced. At pH 11.0, the TOC yield reaches a maximum and then decreases immediately. TOC production was elevated again at day 12, probably due to the fact that anaerobic microorganisms consume more nutrients in a strongly alkaline environment but die more easily. The leaching of intracellular material after the death of anaerobic microorganisms resulted in TOC leaching. TOC production at pH 6 gradually increased after day 8.
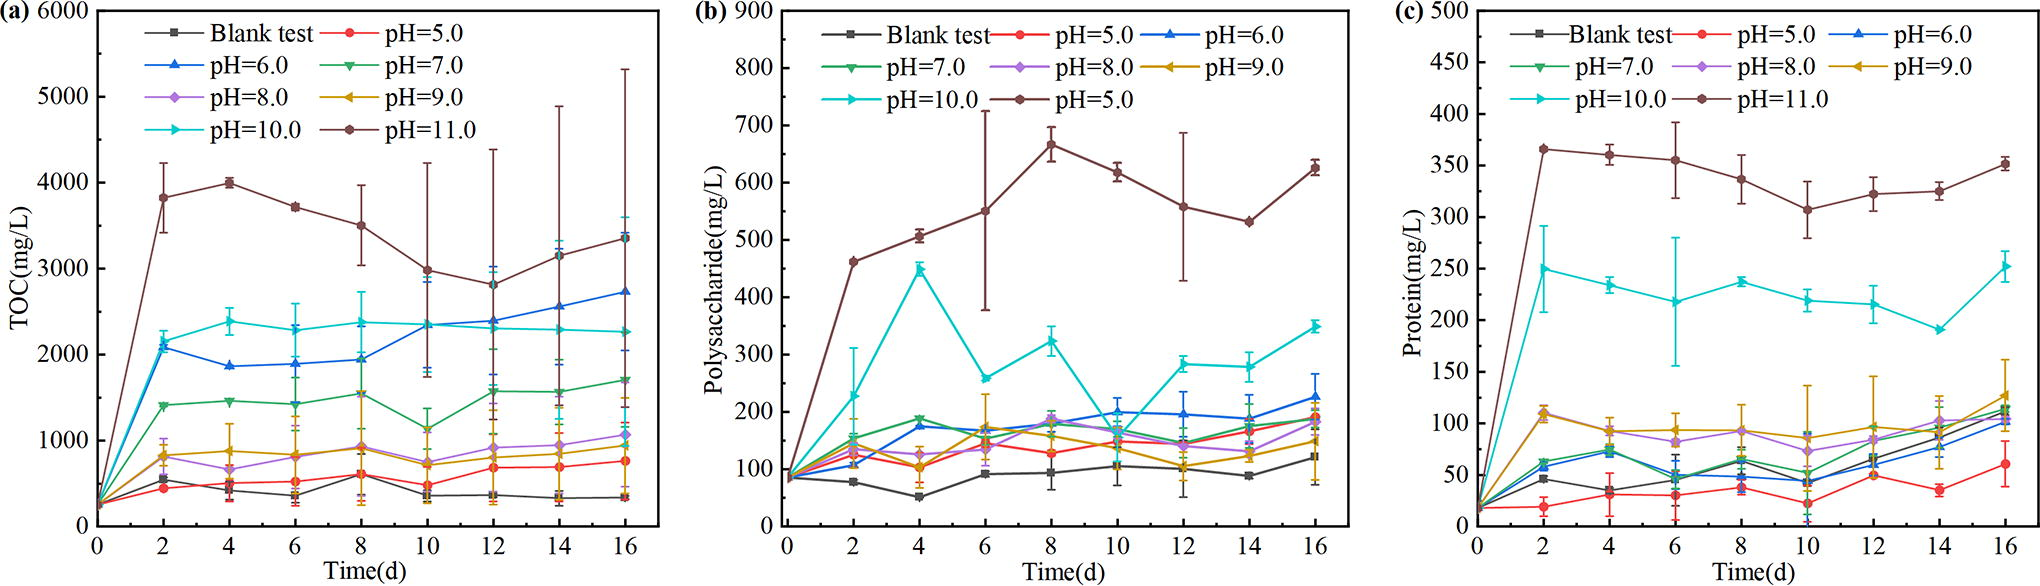
Effect of different pH and fermentation time on
The organic matter contained in the excess sludge is mainly polysaccharides and proteins. Both can be used as fermentation substrates for acid-producing microorganisms during anaerobic fermentation and finally converted to VFAs. The effects of pH and fermentation time on the polysaccharide concentration are shown in Figure 1(b). It can be seen that polysaccharide leaching was more at pH 10.0 and 11.0 compared with the other groups. Polysaccharide solubilization at pH 10.0 reached a maximum on day 4 and then basically remained at ∼600 mg/L. Similarly, polysaccharide solubilization at pH 11.0 peaked at day 8 and then declined. Polysaccharide solubilization increased in both groups by day 14. This may be due to the depletion of nutrients in the sludge, leading to microbial death.
The effects of pH and fermentation time on the protein mass concentration are shown in Figure 1(c). During the initial 2 days of fermentation, the mass concentration of protein was as follows: pH 11.0 > pH 10.0 > pH 9.0 ≈ pH 8.0 ≈ blank test > pH 7.0 > pH 6.0 > pH 5.0. With the increase in fermentation time to 16 days, protein concentrations increased at all pH values. In particular, the significantly increase was at pH 10.0 and 11.0. At pH 10.0 and 11.0, proteolysis reached a maximum on day 2 and remained essentially constant thereafter. The relatively small amount of protein leached compared with polysac charides indicates that the nutrients during anaerobic fermentation of microorganisms are mainly proteins.
The substrates that increase the TOC content in the sludge fermentation broth include VFAs in addition to proteins and polysaccharides. The highest amounts of TOC, polysaccharides, and proteins were dissolved at pH 10.0 and 11.0. However, at pH 11.0, more NaOH is consumed in the experiment with the buffer solution. Therefore, considering the economic benefits of large-scale application, pH 10.0 was chosen as the optimal pH condition for anaerobic fermentation of sludge to produce VFAs in this experiment. This is consistent with the findings of Huang et al. (2018) that the optimal conditions for VFA production by sludge fermentation are at pH 10.0; the VFA yield is also relatively high at this pH. Xiong et al. (2013) showed that at pH 10.0, sludge fermentation significantly reduced the number of methanogenic bacteria, thus reducing the consumption of SCFAs.
Effect of different pH and fermentation time on the degradation rate of sludge
The degradation rate of the sludge can reflect the magnitude of microbial activity in the sludge under different conditions, thus indirectly indicating whether the selected optimal pH is accurate. The degradation rates of sludge TSS and VSS are shown in Table 6. The effects of pH on the degradation rate of sludge TSS are shown in Figure 2. The degradation rate of sludge TSS was as follows: pH 10.0 (54.11%) > pH 11.0 (51.10%) > pH 9.0 (49.33%) > pH 5.0 (46.82%) > pH 6.0 (40.73%) ≈ pH 8.0 (40.73%) > pH 7.0 (39.18%) > blank test (37.25%). The effects of pH on the degradation rate of sludge VSS are shown in Figure 3. The degradation rate of sludge VSS was as follows: pH 11.0 (67.44%) > pH 10.0 (63.56%) > pH 9.0 (57.65%) > pH 8.0 (54.76%) ≈ pH 7.0 (54.76%) > pH 5.0 (53.73%) > pH 6.0 (50.02%) > blank test (44.02%). The above results show that the degradation rate of sludge could be significantly improved by controlling fermentation pH at 10.0 or 11.0. WAS is more prone to hydrolysis in alkaline environments because the acidic groups in the extracellular polymer are separated under alkaline conditions, leading to an increase in the negative charge of the extracellular polymer on the sludge surface. These negatively charged groups repel each other, resulting in a large release of substances such as proteins and sugars (Cassini et al., 2006).
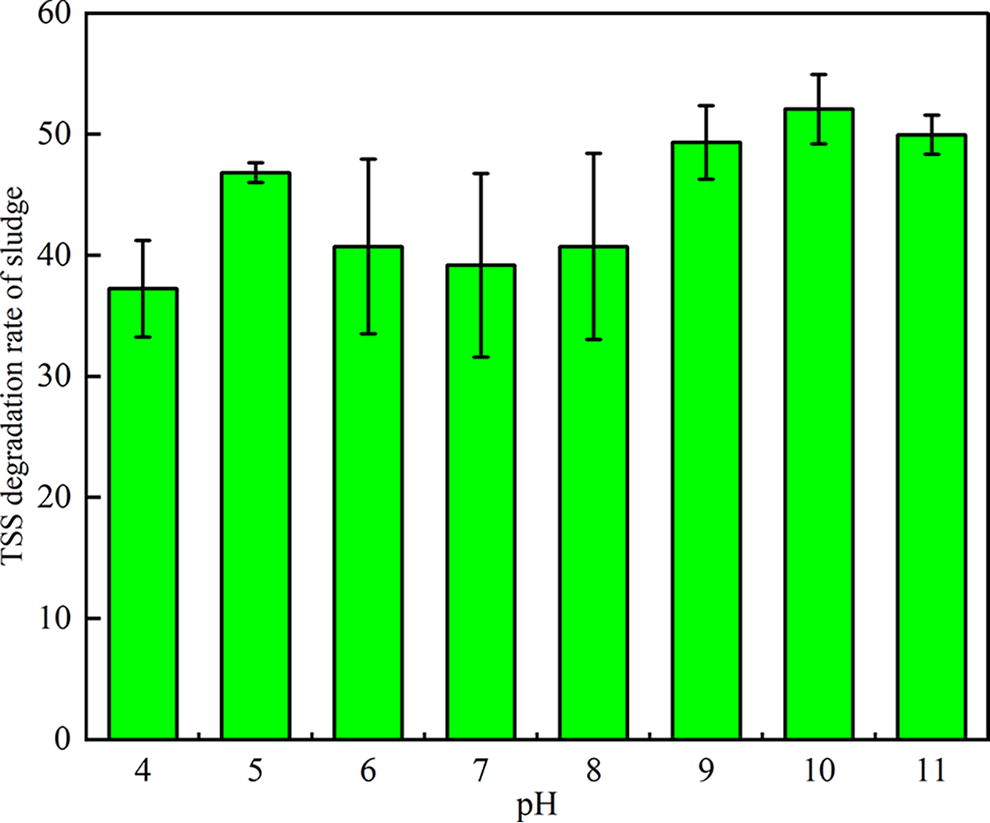
Effect of different pH on the degradation rate of sludge TSS. TSS, total suspended solids.
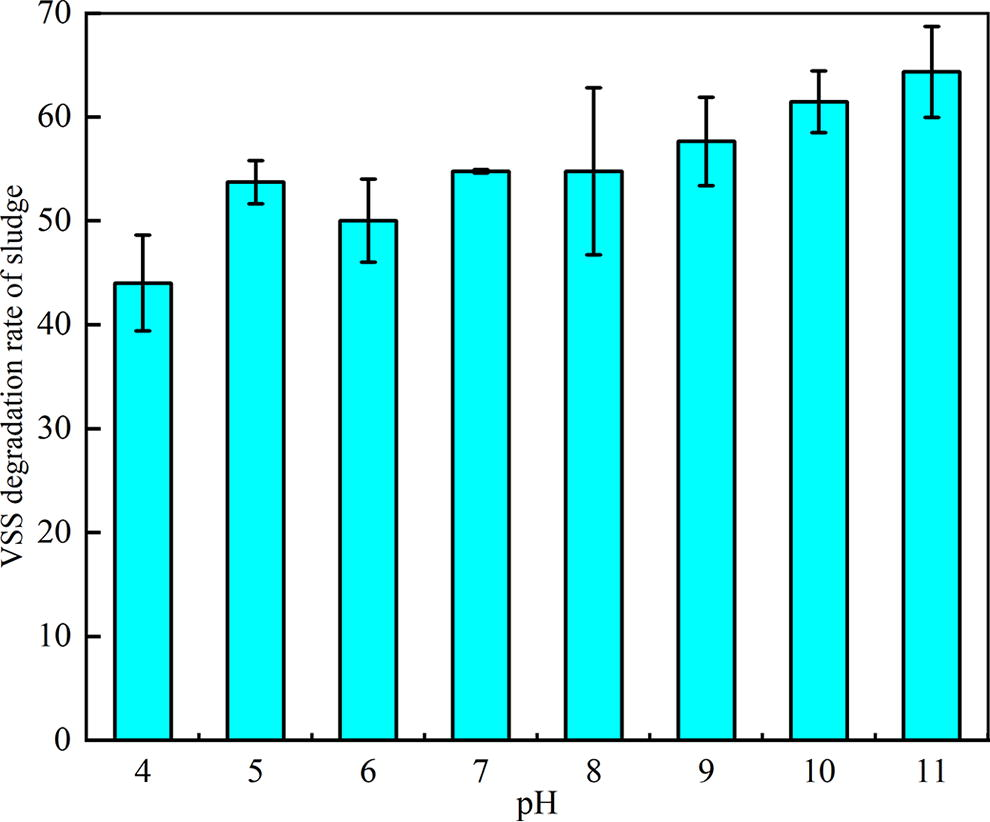
Effect of different pH on the degradation rate of sludge VSS. VSS, volatile suspended solids.
Sludge Degradation Rate after Fermentation
TSS, total suspended solids; VSS, volatile suspended solids.
Among them, the TSS degradation rate was higher at pH 10.0, whereas the VSS degradation rate was higher at pH 11.0. This indicates that anaerobic microorganisms exhibit greater activity under alkaline conditions compared with acidic ones. At the same time, the above choice could also be verified. This is consistent with several researchers who demonstrated that the initial pH at 10.0 was the optimum condition for sludge hydrolysis (Pang et al., 2023; Shao et al., 2012; Tulun and Bilgin, 2019). Consequently, pH 10.0 was selected as the most favorable condition for sludge degradation in this study.
Effect of different fermentation times at optimal pH on the total yield of VFAs and each component
The results obtained are shown in Figure 4. As can be seen from Figure 4, the total production of VFAs increased with increasing fermentation time at pH 10.0, reaching a maximum of 2481.35 mg/L on day 6, and then decreasing to about 800 mg/L and remaining basically unchanged. The rapid increase in total VFA production in the first four days of fermentation was due to the rapid hydrolysis of the long-chain fatty acids contained in the fermentation broth itself. The slow increase in the longer period afterwards might be due to the further conversion of some of the dissolved organic matter into VFAs. The decline in VFA production in the later period was due to the following reasons: first, the VFAs were consumed by the domesticated microorganisms; second, the longer fermentation time might have caused the methanogenic bacteria present in the system to use the VFAs and produce methane. The time at which VFAs reached the maximum with TOC, polysaccharides, and proteins was different, probably because VFAs were not only being produced at the beginning of the reaction but were also being consumed. As the reaction system stabilized, anaerobic microorganisms no longer used VFAs for growth and reproduction.
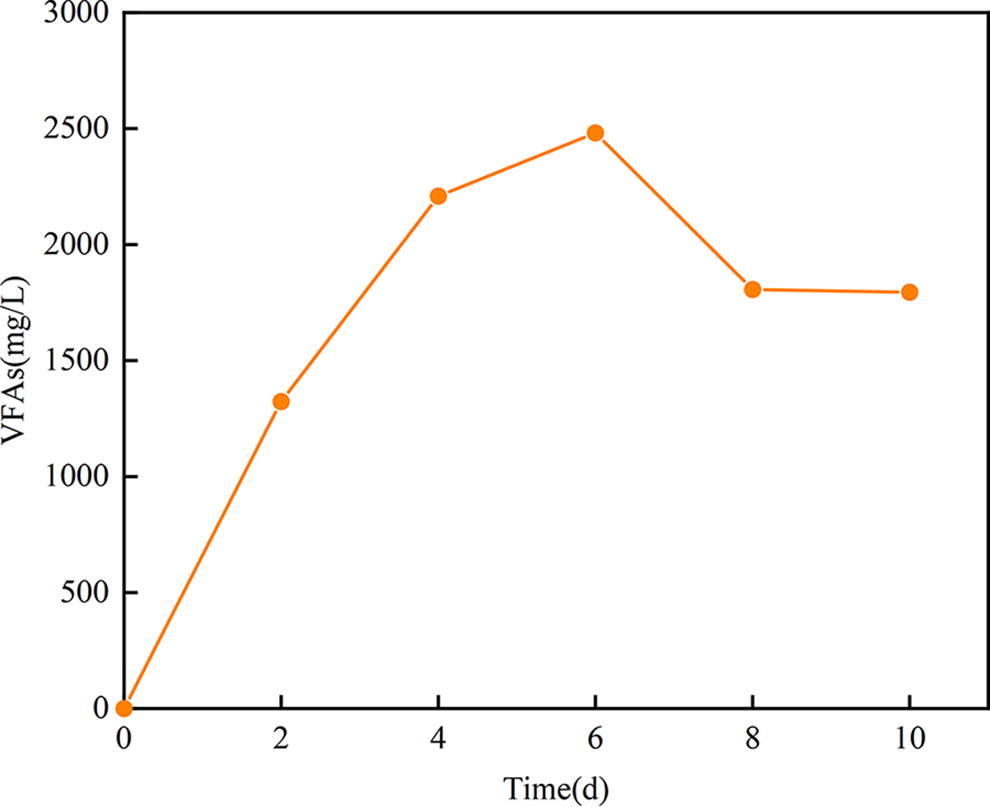
Total VFA yield at different fermentation days at pH = 10.0. VFA, volatile fatty acids.
The detectable VFAs produced from WAS mainly include formic acid, acetic acid, lactic acid, propionic acid, iso-butyric, and n-butyric in pH-controlled (pH 10.0) experiments. At pH 10.0, the distribution of individual VFAs in the fermentation system is as shown in Figure 5. Acetic acid was the most common product during the first two days of fermentation. As the fermentation time increased, the percentage of lactic acid became larger. Its production increased significantly from 0 on day 2 to 1852.02 mg/L on day 4, while there was only a slight increase in lactic acid production with further increasing fermentation time (1852.02 and 1946.06 mg/L, respectively, on days 4 and 6). On day 6, the percentage of lactic acid reached 78.43%, acetic acid 10.51%, and propionic acid 11.06%.

Yield of each VFA component at different fermentation days at pH 10.0. VFA, volatile fatty acids.
The VFAs produced by sludge fermentation were basically only lactic acid and acetic acid from days 8–10 of the experiment. This is different from the experimental results of other researchers. The results of other studies showed that acetic acid accounted for a larger proportion of the VFAs produced by the sludge fermentation broth, while lactic acid accounted for a larger proportion in the prefermentation phase of this experiment. This may be due to differences in the type of sludge selected for the experiments or that the selected wastewater treatment plant added special agents at a certain stage of the purification of the effluent, thus inhibiting the production of acetic acid and allowing an increase in the production of lactic acid. However, the acetic acid content was also relatively high in the late stage of fermentation in this experiment, which is consistent with the results of Shi et al. (2022), where acetic acid was predominant in alkaline fermentation. Liu et al. (2018) also demonstrated that alkaline fermentation above pH 10.0 was a key factor in the production of VFA from sludge and that acetic acid was always the main component of the alkaline fermentation broth.
The recovery of nitrogen and phosphorus under different conditions
Struvite (Mg NH4PO4-6H2O) is rarely found in nature and will precipitate when Mg2+, NH4+ and PO43− are present in the solution and the ions are saturated to form struvite (Sena et al., 2021). To optimize phosphorus and nitrogen recovery efficiency from wastewater, researchers have focused on optimizing struvite formation conditions, including pH and the molar ratio of Mg/P (Yesigat et al., 2022). pH plays a pivotal role in struvite crystallization, with struvite being more soluble at lower pH levels and precipitating at higher pH levels (Guan et al., 2023). The supernatant of sludge fermentation was selected under optimal degradation conditions at pH 10.0, and the mass of phosphate in the supernatant was determined. The recovery experiments were conducted by controlling the molar ratio of Mg/N and the molar ratio of P/N, and the recovery rates of nitrogen and phosphorus were measured to examine the recovery effect of the guano crystallization method. The obtained 10 mL of sludge fermentation solution was tested to contain 7.4 mg of ammonia nitrogen and 16.3 mg of total phosphorus, with a molar ratio of 1:1 between the two. Therefore, to achieve a magnesium to nitrogen ratio of 1.0, 1.5, and 1.9, 63.8 mg, 95.7 mg, and 121.2 mg of magnesium sulfate anhydrous, respectively, were required to be added to the fermentation broth. To achieve a P/N ratio of 1.2 and 1.4, 86.6 mg and 101.0 mg of potassium dihydrogen phosphate, respectively, were added.
As can be seen from Table 7, the nitrogen and phosphorus recovery were higher when the pH value was larger. The recovery rates of nitrogen and phosphorus for Mg/N ratios of 1.9 and P/N ratios of 1.4 at pH 8 were 37.12% and 44.75%, respectively. In addition, the recovery rates of nitrogen and phosphorus for Mg/N ratios of 1.9 and P/N ratios of 1.0 at pH 9.0 were higher, at 79.29% and 80.10%, respectively. The highest nitrogen recoveries of 96.55% were obtained at pH 10.0 for both Mg/N ratios of 1.5 and 1.9 and P/N ratios of 1.0 and 1.2. However, the phosphorus recovery was higher in the group of 8 experiments, thus the experimental conditions in group 8 were selected as the best conditions for nitrogen and phosphorus recovery. This suggests that struvite is more likely to remain stable in a more alkaline environment.
Recovery of Nitrogen and Phosphorus
The solubility of struvite is minimal at pH values between 8.90 and 9.25 (Nelson et al., 2003). Therefore, increasing the pH of the solution properly is beneficial to the synthesis of struvite (Tansel et al., 2018). At the same time, the pH value in the sludge fermentation broth has a large effect on the leaching of nitrogen and phosphorus, which is mainly due to the ability to destroy the cell walls and cell membranes of microorganisms under high pH conditions, leading to cell cracking and the effective dissolution and release of proteins and polysaccharides from extracellular polymers into the system. Therefore, the system chose pH 10 as the best condition for nitrogen and phosphorus leaching for the reaction. This finding is consistent with the results of Pang et al. (2023). By alkaline pretreatment of WAS, pH 10.0 was obtained as the optimal condition for catalytic sludge hydrolysis, under which the release of dissolved organic matter from the sludge fermentation broth was efficient and hydrolysis was accelerated, thus improving the efficiency of anaerobic digestion.
Conclusion
The present article studied the effect of pH values on the recovery of carbon, nitrogen, and phosphorus from WAS. The sludge was treated by alkaline anaerobic fermentation. It was seen that the sludge fermentation produced the most VFAs at pH 10.0, of which lactic acid accounted for a relatively large proportion, reaching 78.43% on day 6. Nitrogen and phosphorus in the sludge were recovered by struvite precipitation, and the highest recovery of nitrogen and phosphorus was achieved at pH 10.0, with an Mg/N ratio of 1.5 and a P/N ratio of 1.0. The recovery of nitrogen and phosphorus from sludge in the form of struvite is an effective way for resource utilization of WAS. It can reduce sludge production and obtain slow-release fertilizer struvite with high economic value, which has a broad application prospect. The sludge fermentation liquid obtained from this experiment is rich in VFAs, especially in lactic acid, and it is suggested that the generated VFAs can be applied to municipal WWTPs and biological desulfurization processes. In addition, this experimental method can also be tried to be applied in WWTPs to treat the waste sludge. This experiment is a small-scale experiment, and further engineering-scale pilot experiments can be conducted.
Footnotes
Acknowledgments
The work was supported by the China Postdoctoral Science Foundation (2019M662582). The authors appreciate College of Ecology and Environment, Zhengzhou University for their support during the experiment.
Authors’ Contributions
T.Z.: Methodology, Investigation, Formal analysis, Writing-original draft. J.Z.: Methodology, Writing-review & editing. W.W.: Data curation. G.Z.: Writing—review & editing, Resources. X.W.: Writing—review & editing.
Author Disclosure Statement
The authors declare that they have no known competing financial interests or personal relationships that could have influenced the work reported in this article.
Funding Information
No funding was received for this article.