
Abstract
Environmental academic conferences synergize efforts to protect people and the planet. However, in-person gatherings result in notable greenhouse gas emissions (usually quantified by global warming potential [GWP] indicator) and other environmental impacts. A hybrid, comprehensive environmental life cycle assessment (LCA) was conducted for the three-day 2022 AEESP Research and Education Conference: Environmental Engineering at the Confluence in St. Louis, MO. The LCA used primary data collected from conference participants and planners, employing four approaches based on changes to transportation and accommodation modeling assumptions to determine a range of impacts. The assessment found that attending the three-day conference resulted in 428 kg CO2eq per person, which is between three and four times the emissions associated with the activities of a United States resident during three routine days. A total of 783 conference attendees traveled approximately two million cumulative miles across different intercity transportation methods. Intercity transportation contributed approximately two-thirds to the overall GWP associated with conference execution and exhibited a similar magnitude in many other impact categories. Accommodation, food, and conference venue building electricity also contributed notably to environmental burdens. The analysis allowed for the examination of particular conference decisions aimed at reducing environmental impacts. The study found that effective reduction methods include offering accommodation in university residence halls, enabling intercity bus transportation, encouraging carpooling and use of local public transportation, selecting accessible host locations, and serving plant-forward menus.
Introduction
The Association of Environmental Engineering and Science Professors (AEESP) has held 19 conferences in its over half-century history, bringing together thousands of individuals to foster collaboration among teaching and research professionals in environmental fields. Although a theme of these conferences is anthropogenic climate change, a considerable contributor to humans’ environmental footprint is hosting events (Toniolo et al., 2017), including international conferences. Historically, the environmental impacts of in-person conferencing have been overlooked (Holden et al., 2017). However, the COVID-19 pandemic drove in-person meetings online, including the 2021 AEESP Research and Education Conference, which was transformed into an online “appetizer” event in anticipation of an in-person 2022 conference. The shift in modality—in addition to escalating criticisms of the environmental burdens of scientific meetings (Booth and Stevens, 2021)—amplified our awareness of the resource intensity of in-person events, encouraging investigation into the environmental impacts of academic conferencing.
Academic conferences intend to foster collaboration, expand knowledge, and advance careers. Although virtual and hybrid conferencing have substantially lower global warming potential (GWP, an indicator to quantify the climate impact of greenhouse gas emissions) and offer capacity for increased participation (Foramitti et al., 2021; Parncutt et al., 2021; Raby and Madden, 2021; Yates et al., 2022), these modes of conferencing exhibit professional drawbacks compared with the traditional in-person conference model (Burtscher et al., 2020; Periyasamy et al., 2022; Tao et al., 2021; Yates et al., 2022). Individuals attending virtual conferences describe dissatisfaction with the quality of networking opportunities (Bousema et al., 2020; Chou and Camerlink, 2021; Stefanoudis et al., 2021) and difficulty remaining engaged with virtual programming (Foramitti et al., 2021). Similarly, hybrid conferencing can alienate virtual participants (Parncutt et al., 2021). Although there are benefits to alternate forms of conferencing, the in-person model is likely to persist (Abbott, 2020).
Previous studies found that transportation—particularly air transport—overwhelmingly contributes to the GWP of an academic conference (Kay et al., 2023; Klöwer et al., 2020; Nevrly et al., 2020). United States higher education institutions comprise approximately two percent of the nation’s annual GWP, and academic conference-related air travel can contribute approximately one-third of a university’s emissions (Bart et al., 2016; Sinha et al., 2010). Although less impactful than transportation, existing literature indicates that food and energy processes also have considerable environmental burdens (Sanz-Cobena et al., 2020; Toniolo et al., 2017).
Most previous studies only examined GWP in relation to academic conferencing, but the few studies that address further ecological and human health outcomes also found travel activities to be a major contributor to most impact categories (Cavallin Toscani et al., 2023; Hischier and Hilty, 2002; Neugebauer et al., 2020; Tao et al., 2021). Nevertheless, further investigation is warranted into the comprehensive impacts associated with an actual international conference with a broad system boundary, as many of these studies have limited system boundaries or are based on theoretical scenarios. Hischier and Hilty (2002) excluded accommodation and conference spaces from their system boundary. Neugebauer et al. (2020) based their assumptions on an existing conference series, but the assessed conference had not occurred at the time of the study. Thus, the study assumed the location of origin for each attendee and excluded transport to and from the airport at their origin from the system boundary. Tao et al. (2021) also employed a theoretical conference to assess impact reduction potential across many categories. This study aims to add to existing findings on the environmental impacts of academic conferencing by utilizing primary data collected from 2022 AEESP conference participants and planners.
Materials and Methods
The assessment method for the 2022 AEESP conference is a hybrid environmental life cycle assessment (LCA). An LCA is a systems-level, standardized tool utilized to quantify the environmental impact of a product or service over its lifetime (Jolliet, 2016). Goal and scope definition, life cycle inventory (LCI), life cycle impact assessment (LCIA), and interpretation of results were conducted in accordance with ISO 14040 and 14044 (ISO, 2006a; ISO, 2006b).
Goal and scope definition
The objective of this study is to conduct an LCA of the 2022 AEESP conference and quantitatively evaluate mitigation methods employed. The assessment can serve as a guide for academic conference organizers aiming to reduce environmental impacts while preserving the benefits of in-person conferencing.
Functional unit
The functional unit is defined as one attendee participating fully for three days at the 2022 AEESP Research and Education Conference: Environmental Engineering at the Confluence. Participating fully entails attending at least one conference-sponsored activity each day, attending all catered meals, and remaining in an accommodation for three nights. The in-person conference was held from June 28–30, 2022, in St. Louis, MO.
System boundary
Conference execution entails both individualized and conference-wide decision making. Individual choices include accommodation, dietary preference, and method of transport. Processes that do not vary based on individual decisions were considered on an organizational level, not accounting for individual variation. All upstream production processes were linked in OpenLCA, producing cradle-to-grave impacts, which account for transportation between manufacturing steps. Further details on the inclusions to these subcategories can be seen in the cradle-to-grave system boundary depiction (Fig. 1).
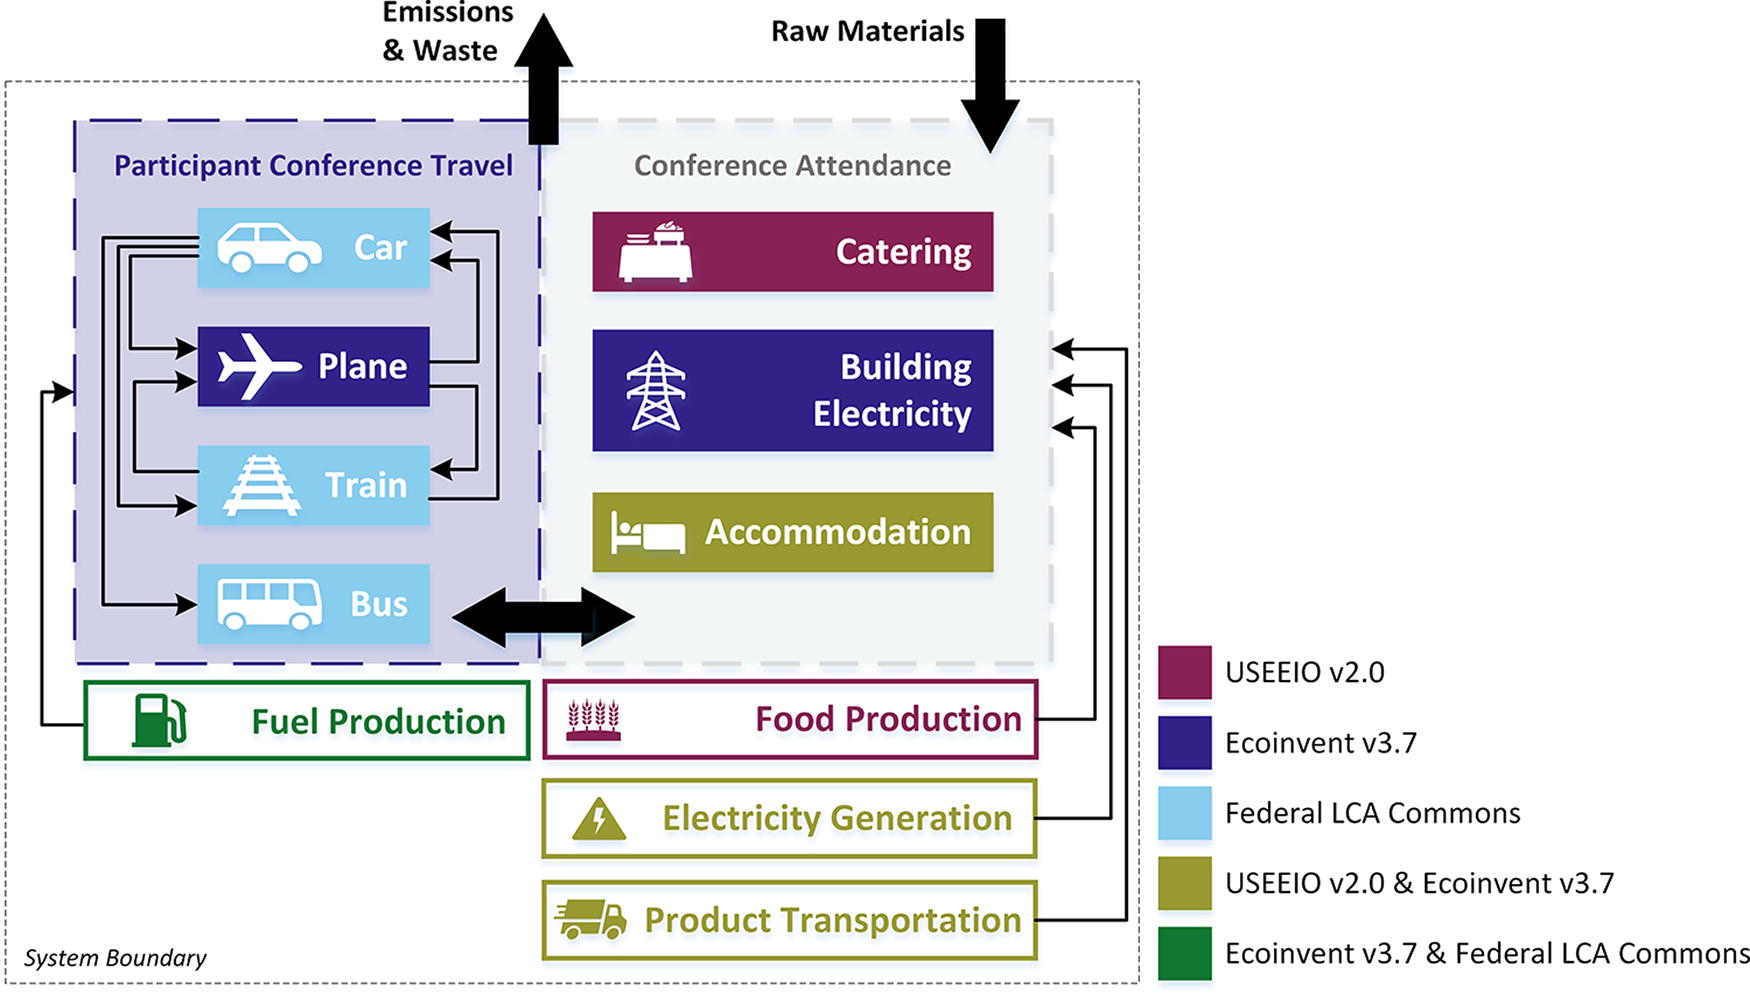
System boundary of the environmental LCA of the 2022 AEESP conference with all upstream production processes included. For intercity conference travel, participants took a car, plane, train, bus, or some combination of vehicles. For plane travel, either a car or train was necessary to get to and from the airport. For some train travel, participants used a car to get to and from the train station. For organized bus travel, some participants utilized a car to reach the bus departure terminal; the bus went straight to the conference venue. Upon leaving the conference, the means of transportation are the same, but in reverse. Different colors indicate the source(s) of LCI data of background processes. LCA, life cycle assessment; AEESP, Association of Environmental Engineering and Science Professors; LCI, life cycle inventory.
Life cycle inventory
This study, based on primary data, required detailed information on items and services necessary for conference execution. Primary data are partly collected from a postconference survey distributed to all 783 attendees, aimed at gathering opinions of the conference and individual travel logistics. A total of 225 (28.7%) attendees took the survey, with 177 (22.6%) respondents beginning the LCA data section.
The LCI data of background processes were obtained using a hybrid approach, which combines a process-based and economic input–output (EIO) method. Hybrid LCA has been developed to address the methodological limitations of process-based LCA in truncation due to system incompleteness and EIO in difficulties in assessing specific products due to highly aggregated, industry-average data (Heijungs and Suh, 2002). This study specifically used a tiered hybrid LCA approach that is based on Ecoinvent v3.7 (Ecoinvent, 2020) and Federal LCA Commons (2012) process-based analyses but uses Environmentally Extended Input–Output (USEEIO) v2.0 (United States Environmental Protection Agency, 2022) using only expenditures to fill any remaining data gaps and reduce truncation errors of background processes (Supplementary Tables S1-S3) (Crawford et al., 2018). The background processes include the upstream production of food, electricity, and fuels for transportation, and all activities associated with hotel operations.
Four approaches are employed based on changes to the transportation and accommodation modeling assumptions, creating upper and lower bounds for the environmental impact results (Table 1). Across all approaches, air transportation and conference venue building electricity always apply Ecoinvent v3.7, ground transportation always applies Federal LCA Commons data, food always applies USEEIO v2.0, and accommodation considers outcomes of both Ecoinvent v3.7 and USEEIO v2.0. The LCI datasets from Federal LCA Commons and USEEIO v2.0 are specific to the United States. The global average LCI datasets of air transportation and accommodation from Ecoinvent v3.7 are adapted by adjusting electricity and fuel inputs to the United States region.
Approaches Employed to Determine an Impact Range Depending on Different Accommodation and Transportation Data. The Registration-Based Assessments Include a Variety of Carpool and Driving Distance Thresholds
H&C, hotels and campgrounds; MBO, Market for Building Operation; BH, budget hotel; UH, upmarket hotel; LCI, life cycle inventory. H&C is the sector available in USEEIO v2.0 that does not distinguish different types of hotels. Ecoinvent v3.7 provides separate LCI for the market operation of both BH and UH hotels, and we employed these market processes accordingly for the proportion of budget and upmarket guest-nights outlined in Section System boundary.
The contributions of each item or service are considered minor and are excluded from the assessment if they constitute less than 5% of the conference’s environmental impact in all categories. Supplementary Figure S1 details the excluded items and services and their relative impacts. The following sections elaborate on data sources and assumptions for items and services that significantly influence the conference’s environmental impact.
Transportation
The postconference survey provides information about intercity transportation, including where attendees traveled from, how they reached their primary means of transportation, and how they reached campus once they arrived in St. Louis. The LCA section of the postconference survey was only completed by 22.6% of attendees, but registration data were available for all attendees. Therefore, using registration data to make assumptions on cities of origin and modes of transportation was another means of generating a transportation LCI. Table 2 outlines the different survey- and registration-based approaches. Different carpool and driving distance threshold assumptions were tested to examine the sensitivity of the results to these parameters.
Approaches for Conducting the Life Cycle Inventory for Intercity Transportation. Both Approaches Determine the Distance from a Registrant’s Home Institution to the Conference Venue by Google Maps
The registration-based approach conducts sensitivity analyses for different driving thresholds and carpool assumptions (see footnote b). The driving threshold assumes all attendees who travel less than 483 km (300 mi), 644 km (400 mi), and 805 km (500 mi) drive and those that travel that distance or longer fly. Previous literature considers similar values, and the Bureau of Transportation (2011) Statistics finds that 95.4% of trips under 805 km (500 mi) are made by personal vehicle.
Each of the driving distance thresholds is considered for 1, 2, 3, and 4 individuals per vehicle. Only integers of vehicles are considered by dividing the carpool number by the number of people from each origin city and rounding up to the nearest integer. With this approach, it is possible that not all vehicles are full.
Air travel assumptions were determined for each individual using the process in Supplementary Figure S2. A short-haul flight is classified as less than 1,500 km (932 mi), medium-haul is 1,500 km to less than 4,000 km (2,485 mi), and long-haul is 4,000 km or greater (Ritchie, 2020). This classification is used regardless of layovers (e.g., if a participant is flying a total of 5,000 km to arrive in St. Louis and has one layover at 1,000 km, this study considers the total 5,000 km as one long-haul flight) because of the inherent uncertainty in layover locations.
Participants traveled approximately two million cumulative miles for conference attendance. Figure 2 and Supplementary Tables S5–S6 outline distances traveled by different intercity transportation methods. All conference attendees are assumed to have traveled from and returned to the same point of origin by the same means of transportation.
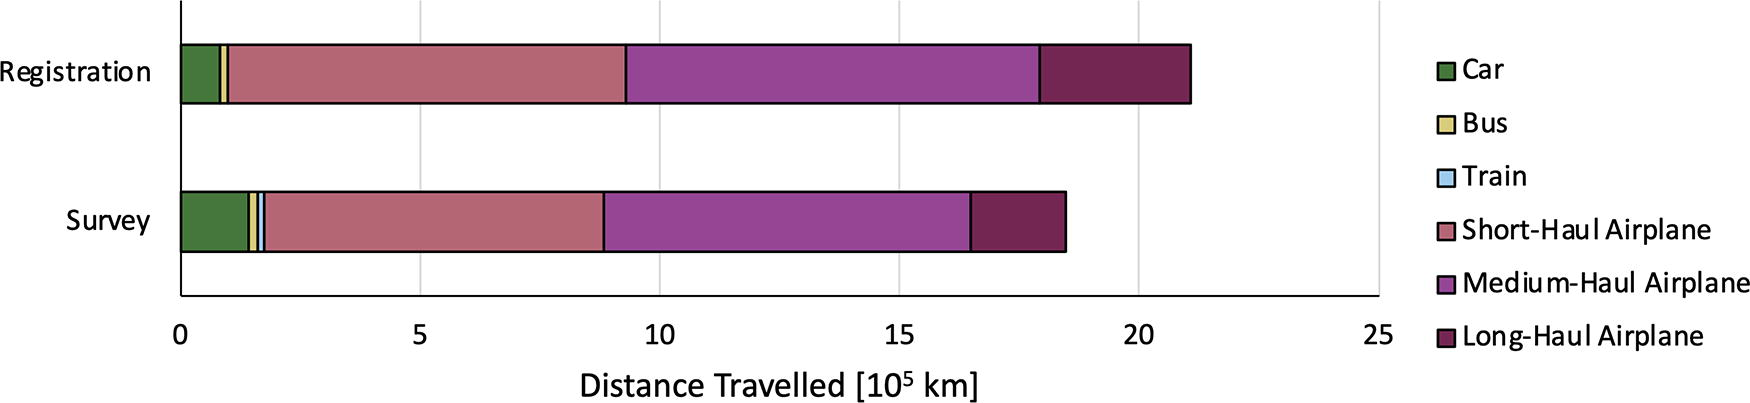
Total distance traveled by all 783 conference participants for intercity transport estimated by two approaches. A detailed breakdown is outlined in Supplementary Tables S5–S6.
Accommodation
Accommodation at the conference includes staying at home, in a hotel, and in a residence hall at the conference venue. Approximately one-third of conference attendees did not disclose their accommodation plans and are therefore not accounted for in the residence hall, on-campus hotel, conference-sponsored hotel, and St. Louis resident groups. Although conference goers may have used a short-term home rental service, the study assumed that the unaccounted-for individuals all stayed in a hotel recommended by the university or the hotel that hosted the closing banquet. Supplementary Table S7 outlines the number of individuals staying in each accommodation type and associated costs.
Assuming each conference participant remained in their accommodation for three nights over the course of the conference resulted in 1,164 guest-nights in budget hotels, 1,050 guest-nights in upmarket hotels, $55,770 in costs associated with staying in a residence hall, and $304,766 in hotel-associated costs. No guest-nights or costs result from St. Louis residents who attended the conference.
Food
The LCI only considers the meals included in the cost of registration, including lunch and dinner on all three days of the conference with conventional, vegetarian, and special dietary options. The survey did not collect information on attendees’ nonconference meal decisions. These meals were not included in formal conference activities and were not included in the LCI. Food costs were obtained directly from conference caterers. Catering services were modeled as restaurants, with lunch services equating to limited-service restaurant processes ($114,120) and dinner services to full-service restaurant processes ($131,830).
Building electricity
Energy consumed for the production of food, fuels for transportation, and the heating and cooling of water in accommodations are included in upstream LCI modeling. All other energy for conference execution is assumed to be consumed in the form of building electricity. McKelvey Facilities Planning & Management finds that the electricity consumed by relevant university buildings over the conference duration totals 22,933 kWh (Supplementary Table S8).
The electricity associated with heating and cooling water is not considered in the total electricity value. The assessment only considered electrical components of building use, including plug loads and air conditioning. Given that the conference was held in the summer when water heating for regulating building temperature is minimal, the exclusion of other forms of energy consumption by university buildings likely has minimal impact.
Life cycle impact assessment method
The 2022 AEESP conference was assessed using the United States Environmental Protection Agency’s TRACI 2.1 impact assessment method, which includes impact categories of acidification (kg SO2eq), ecotoxicity (CTUe), eutrophication (kg Neq), global warming (kg CO2eq), carcinogens (CTUh), noncarcinogens (CTUh), ozone depletion (kg CFC-11eq), photochemical ozone formation (kg O3eq), and respiratory effects (kg PM2.5eq) (Bare, 2012).
Study limitations
While as much information as possible was gathered to inform the assessment, we are mindful of limitations. First, the assessment only focuses on impacts associated directly with conference execution. While there are environmental impacts associated with conference preparation activities, Neugebauer et al. (2020) found that preparation activities contribute minimally to overall conference impacts when considered with event execution.
The electricity dataset used for building electricity is a regional dataset that encompasses the conference venue. However, the majority of the conference proceedings were held on a university campus that generates some onsite renewable energy, which is not accounted for in the background processes. Using annual data to calculate daily electricity use also introduces uncertainty, as the assessment does not account for seasonal differences in building occupancy or electricity demand.
There are further limitations in the methods employed to determine the impacts associated with catering. The USEEIO v2.0 limited- and full-service restaurant background data reflect the national average American diet, but many conference participants opted for vegetarian meals. Therefore, the assessment applies the findings of an LCA on typical dietary patterns in the United States to quantify different impacts associated with a vegetarian diet (Kim et al., 2020). Vegetarian correction factors (Supplementary Table S9) are applied to the LCIA results for the fraction of vegetarian meals included in registration fees. The TRACI 2.1 outputs for the USEEIO v2.0 food processes remain unmodified for the remaining fraction of conventional meals. This method, in addition to the high variability associated with food pricing, introduces uncertainty in the EIO food assessment. However, these limitations are likely insignificant in the context of the larger impacts resulting from other processes. Furthermore, conference organizers made efforts to use recyclable and compostable materials, but the USEEIO v2.0 industrial sectors may not use sustainable packaging materials. Conference organizers also made efforts to reduce food waste, but the limited- and full-service restaurant processes employed include flows that account for substantial food waste. To test the impact of these discrepancies, a sensitivity analysis was conducted where material separation/recovery, solid waste collection, solid waste combustion and incineration, and solid waste landfilling input flows were removed.
In addition, GWP variation within and between accommodation types is significant (Filimonau et al., 2011). As Ecoinvent v3.7 does not offer a dataset for single occupancy rooms in residence halls, approaches 3 and 4 model residence halls as budget hotels (Table 1).
Results
Intercity transportation overwhelmingly contributes to the environmental impact of the academic conference, serving as the largest constituent and comprising at least 29.5% of each impact category considered (Fig. 3). The percentages presented are the averages of the four approaches for intercity transportation and accommodation modeling (Table 1). The distributions of contributions for each of the four approaches are individually provided in Supplementary Figures S3–S6. Table 3 outlines the full results of the comprehensive LCA, including the average values and the impact range across all four approaches.

Percent contributions from each major participating process to the overall conference impacts. Percent contributions are the average values of all approaches employed.
Average and Range of Impacts in All Categories Considered per Functional Unit
Ecotoxicity potential as comparative toxic units (CTU).
Human toxicity potential as CTUh.
Air travel dominates contributions to intercity transportation impacts, and therefore to overall impact categories (Supplementary Figs. S7–S8). Averaged across the four approaches, air travel comprises 89.3% of overall intercity transportation GWP and between 87.4% and 100% in all other categories.
Accommodation, food, and conference venue building electricity processes contribute substantially to some impact categories (Fig. 3). On average, accommodations comprise over one-third of ecotoxicity (36.5%) and eutrophication (34.7%) conference impacts. Electricity contributes most significantly to carcinogens (26.9%), and food contributes most significantly to respiratory effects (36.1%).
Discussion
The per capita environmental impacts from the 2022 AEESP Research and Education Conference are on par with previous literature, with disparities resulting from different system boundaries and impact assessment methods (Cavallin Toscani et al., 2023; Hischier and Hilty, 2002; Neugebauer et al., 2020; Tao et al., 2021). Although previous literature is limited in providing comprehensive environmental impacts, there is substantial research into the GWP of academic conferences, with values between 92 and 3,500 kg CO2eq per person (Bossdorf et al., 2010; Stroud and Feeley, 2015). The per capita GWP of the 2022 AEESP Conference falls within this range at 428 kg CO2eq, which is more than the emissions associated with the activities of a global average individual every month, or the emissions associated with the activities of an average United States individual every ten days (Ritchie et al., 2020). Assuming the individual resides in the United States, the activities associated with conference attendance contributed 3.49 times the GWP compared with a typical three-day period.
Given that intercity transportation has the largest impact in most categories, finding ways to reduce transportation’s burden on the environment—while maintaining the quality information-sharing components of the in-person modality—is vital in reducing the environmental impact of a conference. However, as travel decisions are largely personal, excepting host city selection, decisions made by conference organizers have minimal influence on an in-person academic conference’s overall environmental burden. Although organizers cannot remove the necessity of intercity transportation, they can take steps to decrease environmental burdens. Offering onsite accommodations, enabling carpooling and public transit use, and making conscious food and waste decisions are promising impact avoidance techniques. Figures 4 and 5 examine these mitigation techniques beyond those already employed at AEESP 2022, with the basis of comparison being the functional unit defined in Section Functional Unit.

GWP mitigated per person over the three-day conference by reduction strategies that can be implemented by conference organizers. Changes in GWP are relative to the 2022 AEESP conference, which already implemented mitigation strategies, including offering accommodation in university residence halls, avoiding food waste, and catering a large percentage of vegetarian meals. All four approaches utilize the same method for determining impacts associated with food, resulting in only one reduction possibility. Two approaches are employed for determining accommodation impacts (Table 1), therefore resulting in two reduction possibilities. Figure 4 shows the overall range produced by the two approaches for all attendees staying in residence halls and the resulting average. Transportation impacts consider sensitivity analyses, resulting in 12 reduction possibilities. GWP, global warming potential; AEESP, Association of Environmental Engineering and Science Professors.

Impact reductions associated with different mitigation techniques, distinguished by approach (1 through 4) and including the average of all approaches (Avg).
Providing accommodation in university residence halls offers substantial GWP reduction potentials (Fig. 4). Existing studies show that private homes, hostels, and university residence halls result in fewer GWP per guest night than hotels (Supplementary Table S11–S12). Around 42.1% of attendees elected to stay in residence halls at AEESP 2022, therefore avoiding some per capita GWP associated directly with hotel accommodation and transportation associated with staying offsite (Supplementary Figs. S10–S11). If all attendees occupied a residence hall, an additional 29.1 kg CO2eq would be mitigated per person, or 6.80% of overall conference impacts (Fig. 4).
However, offering residence hall accommodations produces a large range of reduction potentials in this assessment, as approaches 1 and 2 are reliant on variable economic data and approaches 3 and 4 model residence halls as budget hotels (Table 1). This uncertainty is evident in Figure 5, with approaches 1 and 2 exhibiting reduction potentials associated with residence halls but approaches 3 and 4 exhibiting significant consequences in many impact categories. In terms of GWP specifically, low residence hall reduction potentials result from approaches 3 and 4 because the GWP of budget hotels per functional unit is substantially higher than existing literature on university residence halls and other nonhotel accommodations (Supplementary Table S11). Although they generate different per capita GWP over the conference, all approaches indicate that less expensive accommodations are associated with decreased GWP. This agrees with previous literature, with upscale hotels generating greater emissions per guest night than budget accommodations, largely due to higher energy demands (Chan and Lam, 2002; Filimonau et al., 2011).
Encouraging carpooling also has the potential to considerably reduce GWP, depending on the efficacy of encouragement and the basis of comparison (Fig. 4). Assuming equivalent fuel efficiency regardless of vehicle occupancy, the assessment averaged 2.44 persons per vehicle across the four approaches. Occupying each vehicle with four persons instead of 2.44 associates with an average emissions reduction of 1.02% overall, or 4.36 kg CO2eq mitigated per person (Fig. 4). However, given that approaches 2 and 4 considered baseline scenarios with one, two, three, and four people in each vehicle, emission reductions resulting from carpooling with four persons in each vehicle range from zero to 27.3 kg CO2eq per person (Supplementary Fig. S12; Supplementary Table S13). Without carpooling, driving can result in greater impacts compared with flying. Assuming a plane and car travel the same distance, lower per capita GWP only results from driving when there are at least two individuals carpooling (Supplementary Fig. S13).
Conference organizers may also consider arranging intercity bus transportation from cities with a substantial number of conference attendees. Bus transportation demonstrates lower impacts in nearly all categories per passenger-kilometer compared with one individual driving an average car. However, arranging bus transportation could result in greater GWP depending on the occupancy of the bus, driving distance threshold, and carpool value basis of comparison (Fig. 4). For AEESP 2022, arranged bus transportation could have reduced per capita GWP up to 9.90 kg CO2eq or increased emissions up to 0.990 kg CO2eq, depending on the carpool and distance threshold conditions of the baseline scenario, as outlined in Supplementary Figure S14 and Supplementary Table S14.
Enabling public transportation use by providing transit passes mitigates per capita GWP. AEESP 2022’s proximity to an airport allowed for minor impacts associated with local travel from the airport to the conference venue, contributing 0.926% to the total intercity transportation GWP (Supplementary Fig. S15). Nevertheless, an additional 2.73 kg CO2eq per person could have been mitigated had all attendees who flew to the conference utilized public transportation between the airport and conference venue (Fig. 4).
Impacts from travel between the airport and the conference venue could be substantially greater if the conference venue chosen is far from an airport. This would necessitate additional miles traveled—which results in greater impacts—and create a larger barrier to public transportation use. Employing public transit between the airport and the conference venue can decrease the GWP of this local transit per passenger-kilometer traveled up to 87.9% (Supplementary Fig. S17). Although inconsequential for the 2022 AEESP conference, as the round-trip distance between the conference venue and the airport was only 33.6 km, encouraging local public transportation use may strongly influence the overall environmental burden if a conference venue is far from the airport.
Similarly, the conference site selection committee should be mindful of their host city selection. By choosing a host city that is central or close in proximity to a large portion of expected conference-goers, organizers are reducing the total distance that must be traveled to the conference. Organizers can also select a host site that is close to a major airport, which offers direct flights and can be accessed by public transportation from the airport. Although St. Louis Lambert International Airport (2022) is a major airport that serviced ten million people in 2021, the airport is not easily accessible from all locations, thus necessitating layovers. Layovers often result in more substantial environmental impacts than direct flights. This study modeled layovers to determine ultimate environmental burdens (Supplementary Fig. S2). However, a scenario in which all participants reach St. Louis with no layovers reduced conference GWP by an average of 5.97% (Supplementary Fig. S18).
Conference organizers can also influence food decisions by making efforts to implement low-impact menus and avoid food waste, which can result in reduced environmental impacts. Conference organizers’ attempts to mitigate food waste at AEESP 2022 by distributing extra meals to students unaffiliated with the conference saved 0.426 kg CO2eq from waste collection and landfilling per person. Encouraging vegetarian meals saved 3.78 kg CO2eq per person over the three-day conference (Supplementary Fig. S19).
Had an entirely vegetarian menu been served, organizers could have saved an additional 5.56 kg CO2eq per person or 1.30% of overall conference impacts. If all extra meals had been distributed, thus eliminating food waste, conference organizers could have saved an additional 0.0852 kg CO2eq per person (0.0199%) (Fig. 4). This study shows substantially higher GWP reduction benefits of diet shifting than food waste minimization, but the assessments of these two measures may vary for other conferences, depending on a variety of factors, including type of waste disposal and transport distances.
Complete prevention of food and packaging from entering a landfill results in a 0.25% or less reduction in overall impacts in all categories (Supplementary Fig. S20). However, this reduction only accounts for downstream impact mitigation. Conference organizers distributed many extra meals, avoiding food entering the landfill but not from being cultivated, transported, and prepared. Food waste mitigation tactics that also target upstream food production processes—therefore influencing impacts from the material and energy demands of farming, transportation, and preparation—may demonstrate larger impact reduction potential. Furthermore, assuming that recycling, composting, and decreasing overall waste production more closely resembles complete waste avoidance than the default flows in USEEIO v2.0, the differences between actual catering and the food modeling processes minimally impact cumulative environmental burdens.
Conclusion
It is likely that the in-person modality will continue to be the preferred manner of academic conferencing, for which intercity transportation, food, accommodation, and conference venue building electricity requirements are inevitable. It is imperative that conference organizers take steps to both quantify and comprehensively reduce environmental burdens. The three-day 2022 AEESP conference resulted in 428 kg CO2eq per person. The per capita GWP comprises 2.87% of the yearly emissions of an average American, between three and four times greater than the 0.822% generated by a typical three days (Ritchie et al., 2020). The 2022 AEESP conference GWP would have been substantially higher if conference organizers had not made conscious sustainability efforts. Decisions made by the organizers—such as reducing conference souvenirs, providing bus transportation to the closing banquet, and minimizing sheets of paper printed and distributed—correlated with very low impacts from certain items and services, resulting in exclusion from the system boundary, and quantitatively reduced the impacts associated with local transportation, food, and accommodation (Supplementary Figs. S1, Figs. S11, and Figs. S19).
Intercity transportation is the largest contributor to environmental impact, and mitigation strategies are limited in their capabilities. This study found that conference organizers can carefully select host cities based on proximity to both projected attendees and major airports that offer direct flights, encourage carpooling and public transit use, and possibly arrange bus transportation to decrease environmental costs associated with transportation. Nevrly et al. (2020) developed a mathematical model to aid conference organizers in determining where to host an academic conference with minimum GWP, assuming emitted pollutants are only a function of distance. Future modeling can expand upon this initial research, considering factors such as the type of aircraft and layover necessity.
Conference organizers can also educate attendees on the relative impacts of their transportation choices. As each participant’s most sustainable transportation choice is highly individualized, conference organizers may consider providing online tools to allow informed decision making about the transportation option, which will have the smallest environmental impact. Although carbon calculators are widely available, future tool development should focus on comprehensive environmental impacts, as well as economic and temporal considerations.
Beyond transportation-based impact mitigation, organizers can encourage and enable attendees to stay in residence halls on the host institution campus, offer plant-forward menus, and mitigate food waste. Further investigation should be conducted to determine the comprehensive environmental life cycle impacts of catering for conference execution, including examining plant-forward diets, local foods, sustainable packaging materials, and food waste.
Although environmental academic conferences synergize efforts to protect people and the planet, event execution results in notable environmental costs. Transportation, accommodation, food, and conference venue building electricity choices have the most substantial burdens, but conference organizers can take steps to reduce impacts.
Footnotes
Acknowledgments
This research was possible as a result of contributions from Tammy Haney, Cindy Alvarez, Kourtney Shaw, Kai Lan, and Michael Altepeter. The authors are grateful to Matthew Eckleman for comments on an early version of this article.
Authors’ Contributions
J.A.: Methodology; investigation (lead); data curation; formal analysis; writing—original draft (lead). D.G.: Conceptualization; investigation (supporting); funding acquisition; supervision; and writing—review and editing (lead). Y.Y.: Validation; and writing—review and editing (supporting). T.L.: Software; and writing—review and editing (supporting).
Author Disclosure Statement
The authors declare no relevant personal or financial interests that relate to the research communicated in this article.
Funding Information
The first author was supported as a conference intern in part by a grant from the
References
Supplementary Material
Please find the following supplemental material available below.
For Open Access articles published under a Creative Commons License, all supplemental material carries the same license as the article it is associated with.
For non-Open Access articles published, all supplemental material carries a non-exclusive license, and permission requests for re-use of supplemental material or any part of supplemental material shall be sent directly to the copyright owner as specified in the copyright notice associated with the article.