
Abstract
Resuspension of dust from carpet is an important source of human exposure to microorganisms. The microbial composition of dust can be measured using environmental DNA, such as with polymerase chain reaction (PCR) technologies. However, we need an improved understanding of collection losses and efficiencies to support accurate quantification of these exposures. The goal of this study was to characterize accuracy and precision of PCR-based analysis methods for microbial DNA in residential carpet dust. We spiked dust with known concentrations of bacterial cells Escherichia coli and Bacillus atrophaeus, as well as spores of the fungus Aspergillus fumigatus. We embedded the dust into nylon carpet of varying pile heights and recovered it by vacuuming using two different attachments. Overall reproducibility using quantitative PCR ranged from 13% to 36% coefficient of variation for this sampling procedure. Overall efficiencies associated with recovery of dust from the carpet via vacuuming and extraction of DNA from the dust ranged from 27% for A. fumigatus spores to 9% for E. coli cells. Failure to account for DNA recovery efficiencies could result in up to 11.2 times underestimation of exposure. Incorporating DNA recovery efficiencies into the analysis avoids underestimation of environmental exposures to microbes.
Introduction
Importance of measuring indoor microbial exposures
People spend 90% of their time indoors (Klepeis et al., 2001) where they are exposed to microbial communities in dust that can impact human health. Studies investigating indoor microbial exposures and distinct health effects have used house dust samples as a surrogate for airborne microbial exposure (Leppänen et al., 2018). As much as 18 kg of dust accumulates each year in the average home (Prussin and Marr, 2015), and microbial concentrations in dust are as high as 109 cells per gram (Alshitawi and Awbi, 2011; Rintala et al., 2012). Carpeted flooring acts as a reservoir for dust accumulation and an environment conducive to microbial proliferation (Dannemiller et al., 2016c; Haines et al., 2020a, 2020b; Nastasi et al., 2020). At elevated moisture levels, carpet with house dust has fungal concentrations up to 100 times higher than carpet without dust (Nastasi et al., 2020). Indoors, dust is resuspended from the floor due to occupant motion, especially from carpeted flooring (Ferro et al., 2004; Qian and Ferro, 2008). Resuspended dust due to human occupancy is estimated to constitute up to 60% of the total particulate matter in the indoor air (Prussin and Marr, 2015). This represents a major source of exposure to microorganisms. Inhalation exposure to resuspended dust can result in different adverse health outcomes, including respiratory effects such as asthma (Qian and Ferro, 2008). The development of asthma and allergic sensitization has been linked to microbial exposures early in life (Dannemiller et al., 2014; Lynch et al., 2014).
In addition to understanding exposure, dust serves as a microbial reservoir that can indicate what microbes have been present in that space in the past (Haines et al., 2020a). This can be utilized to track the spread of human disease, such as in the case of COVID-19 (Renninger et al., 2021). Analysis of dust samples offers a convenient method to characterize indoor microbial communities and understand human disease.
Multiple techniques exist for collecting indoor environmental samples and different methods are typically used based on the goal of the investigation. For instance, active air sampling can be used to quantify inhalation exposure but can be impacted by spatial and temporal variations (Cox et al., 2017; Leppänen et al., 2018). Floor dust can be collected through vacuuming and electrostatic wiping cloths or electrostatic dust cloths can be used to passively collect settled dust (Cox et al., 2017). Different vacuum attachments and filters can be used for different applications. The Microparticle Vacuum Adapter (Sirchie; Youngsville, NC) equipped with a flat 70-mm-diameter Whatman Grade 2 Qualitative Filter Article is commonly used when collecting dust for allergen and endotoxin assessments (Acosta et al., 2008; Chew et al., 2003; Perzanowski et al., 2008, 2006). Dust can also be collected using a 19 mm × 90 mm Whatman cellulose extraction thimble (Whatman, Tewkesbury, Mass) inserted into the vacuum wand attachment. These dust samples are commonly used to assess microbial communities in dust as well as allergens (Belanger et al., 2003; Dannemiller et al., 2016a; Haines et al., 2020b; Leaderer et al., 2002). Another common vacuum attachment used for dust collection is the Dustream® collector (Indoor Biotechnologies, Charlottesville, VA), which is useful for allergen detection and microbial characterization (Olmedo et al., 2011; Sandel et al., 2014; Weiler et al., 2015). Dust samples are relatively easy to collect and microbial levels in settled dust have been shown to correlate with levels observed in air samples (Leppänen et al., 2018).
Measurement of nucleic acids from the environment
The nucleic acids from microbes can persist in the dust for an extended period of time (Nastasi et al., 2022; Renninger et al., 2021). In addition, genetic analysis measures microbial diversity and abundances with more detail and without culture bias (Dannemiller et al., 2013). In fact, only a minority of fungal species are culturable and thus measurable with prior methods (Bridge and Spooner, 2001). The nucleic acids are typically measured by either quantitative polymerase chain reaction (qPCR) or digital polymerase chain reaction (dPCR). qPCR has become the gold standard for observing environmental microbial communities (Bustin et al., 2009; Taylor et al., 2017), including in indoor dust samples (Cox et al., 2017; Dannemiller et al., 2024; Leppänen et al., 2018; Yamamoto et al., 2011). Both dPCR and qPCR have advantages and disadvantages. The dPCR requires a decreased volume, compared with qPCR, which preserves reagents and precious sample. dPCR is also more tolerant to PCR inhibition, which is common for environmental dust samples analyzed on qPCR (Hospodsky et al., 2010; Zhou et al., 2000). In addition, dPCR can determine an absolute quantification of strands of nucleic acid without the use of external calibration standards. This eliminates variability between runs because of variations in amplification efficiencies of the calibration standards as observed in qPCR (Cao et al., 2017; Hindson et al., 2011; Hospodsky et al., 2010). Generally, qPCR has a larger dynamic range than dPCR (Jones et al., 2016).
Only a fraction of the DNA is recovered for subsequent analysis when DNA is extracted from an environmental dust sample. Cells may not be released from dust particles and there is also DNA loss during cell lysis. For instance, qPCR analysis of airborne bacteria and fungi samples from aerosol filters shows low efficiencies associated with recovery of DNA from aerosol filters, which limits the accuracy of quantitative analysis (Hospodsky et al., 2010). Precision ranged from a 28% to 79% coefficient of variation (CV) for three test organisms, and most of this variation was due to instrument repeatability (Hospodsky et al., 2010). We can account for this DNA extraction efficiency in the sample by using the same extraction procedure to procure our qPCR standards. This eliminates the need to quantify the efficiency. Absolute quantification using dPCR analysis does not inherently account for these extraction efficiencies because the technique measures the number of strands of DNA directly. Thus, concentrations of microbial DNA from house dust samples could be underestimated without including these efficiencies in dPCR analysis. It is necessary to know the analytical variability of a sample processing method to determine if it is suitable for estimating exposure. Unfortunately, the DNA extraction efficiency of microbes from common indoor environmental sample types remains unknown, even though it is required for accurate quantification using dPCR.
Goal of this study
The goal of this study was to characterize the accuracy and precision of PCR-based analysis methods for microbial DNA in residential carpet dust. We measured the recovery of dust spiked with a known concentration of fungal spores or bacterial cells. We spiked three separate test organisms, including fungal spores, originating from conidiophores of Aspergillus fumigatus and bacterial cells from the gram-negative Escherichia coli and the gram-positive Bacillus atrophaeus. The bacterial species represent a range of cell wall type as well as lysis resistance potentials to serve as good indicators for most other bacteria. Aspergillus spores were chosen due to their allergic potential and ubiquity in the indoor environment (Hospodsky et al., 2010). We measured DNA recovery from spiked house dust samples embedded in residential carpet to determine the accuracy of our measurements, overall precision (reproducibility), and instrument repeatability for both dPCR and qPCR. We first characterized the efficiency of sample collection for two different dust collection methods commonly available to researchers. Next, we determined the extraction efficiency that represents the loss of DNA during DNA extraction.
Materials and Methods
In this study, we spiked known concentrations of fungi and bacteria into house dust and embedded the dust into carpet to measure microbial losses at each stage of the collection process (Fig. 1).
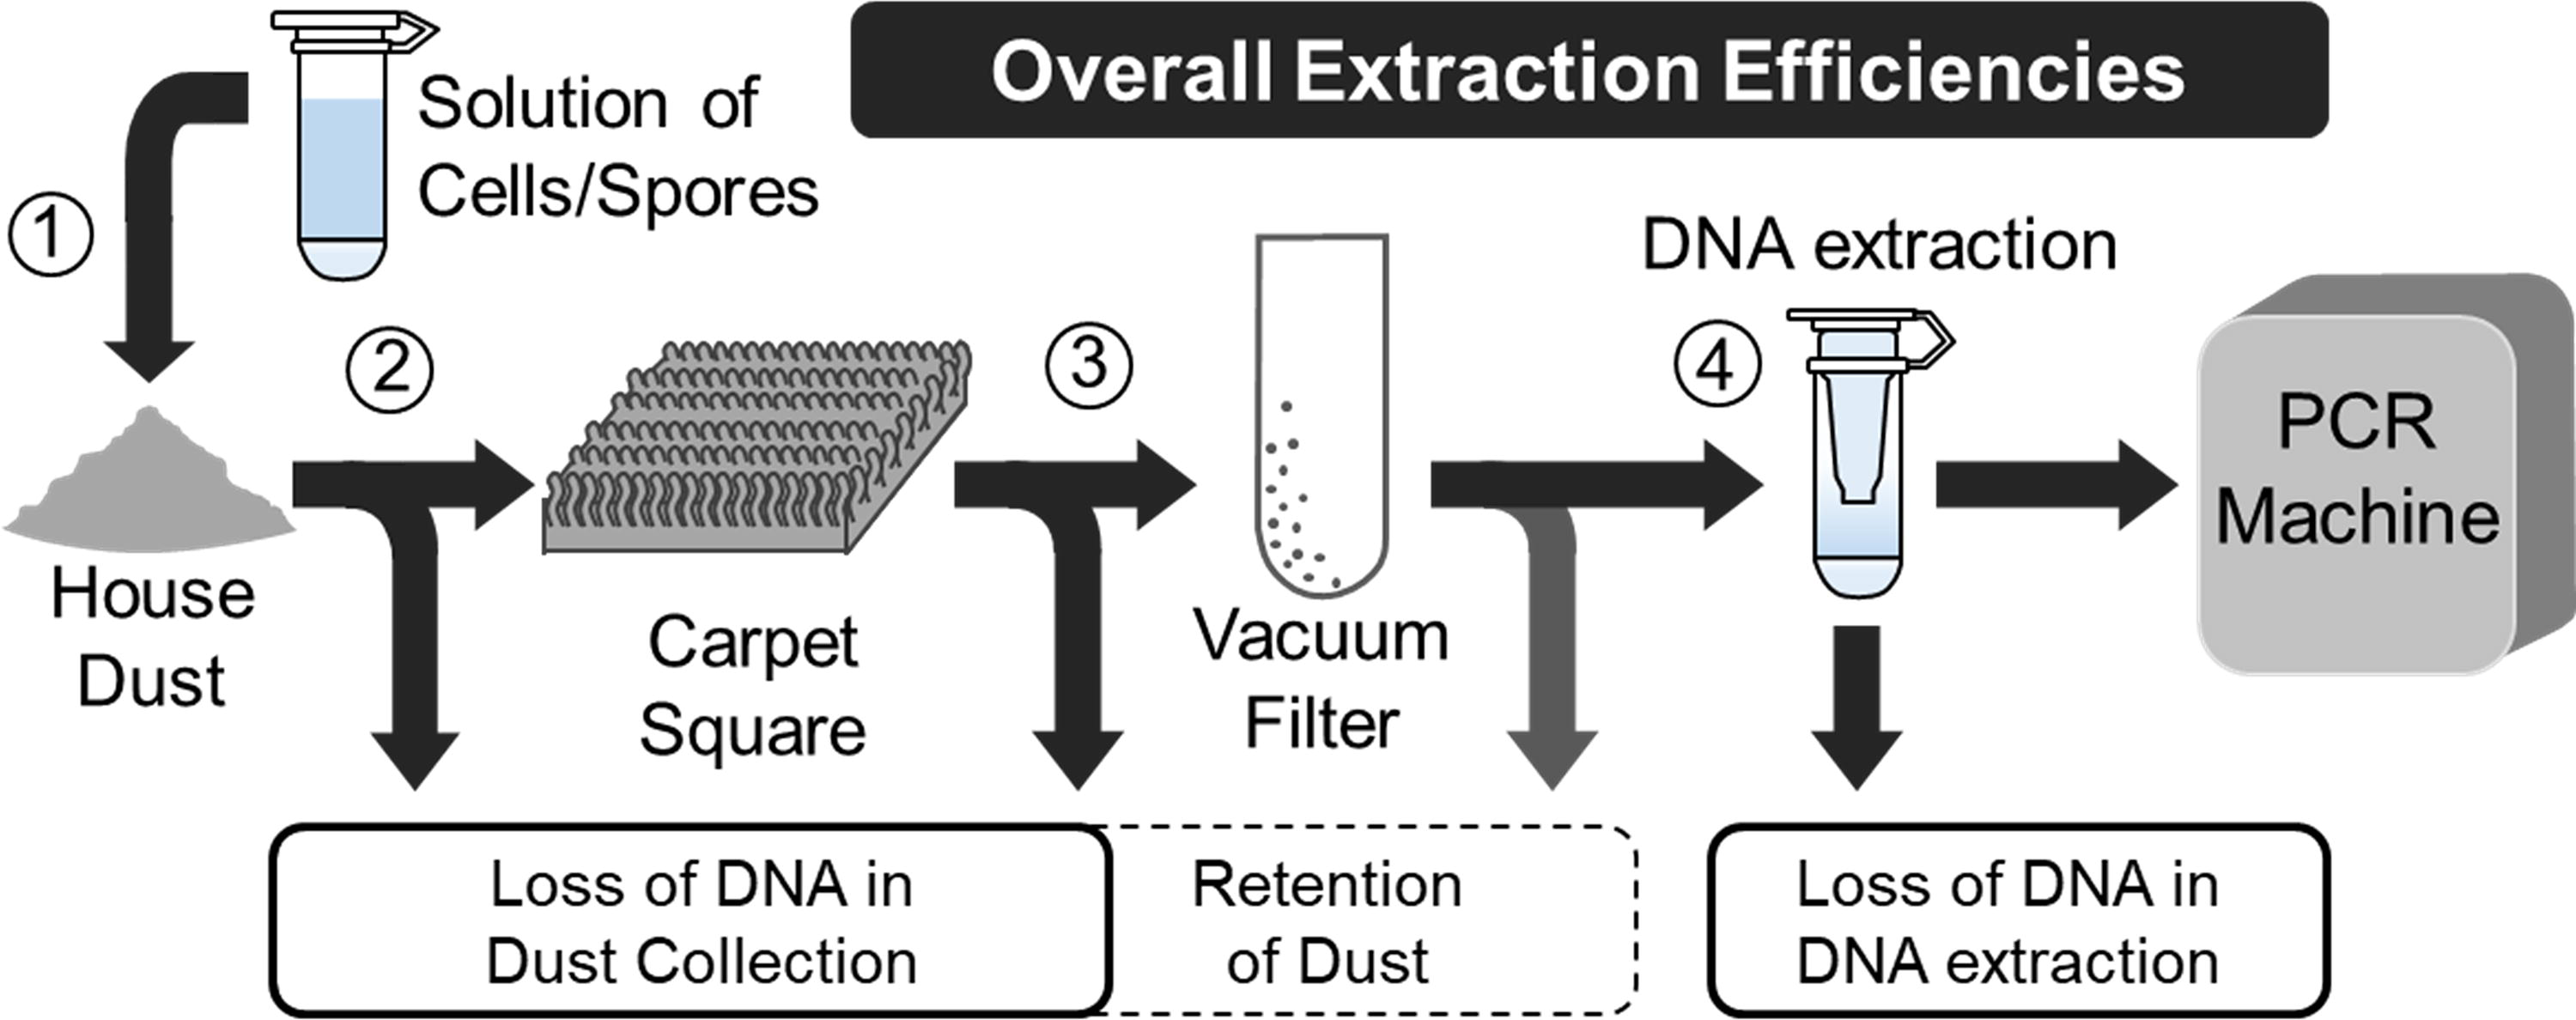
Sampling process for determining points where DNA is lost. Stage (1) is not considered because we are assuming all the cells or spores of the spike are delivered to the dust. The losses from stage (2) were measured and determined to be negligible (data not shown). The loss from stage (3) was called “Efficiency of Sample Collection.” In stage (4), only some of the DNA is recovered for PCR analysis. This loss in stage (4) was termed “Efficiency of DNA Extraction.”
Organism preparation
Bacterial stocks of E. coli (ATCC 15597) and B. atrophaeus (ATCC 49337) and fungal spores of A. fumigatus (Af293, also known as ATCC Strain MYA-4609) were used. To produce these bacterial stock solutions, 25 mL of nutrient broth (Difco Laboratories, Detroit, MI) was inoculated with pure cultures of E. coli and B. atrophaeus cells and grown overnight at 30°C. Pure cultures were stored at 4°C to stop growth and preserve the solution for use. A. fumigatus was grown on malt extract agar (Difco Laboratories, Detroit, MI) at 25°C for 15 days. Spores were removed from the hyphae using a nylon FLOQSwab (Copan Diagnostics Inc, Murrieta, CA) and then suspended in a 2 mL solution of 1% Tween 20 and phosphate buffer saline (0.1 M phosphate). Spores were centrifuged at 10000× g for 3 min to pellet the spores for storage at −20°C before analysis.
To quantify whole-cell concentrations of these solutions, fungal spores and bacterial cells were counted under a Labomed Lx 500 microscope (Labo America Inc., Fremont, CA) using a DHC-N01, C-Chip disposable hemocytometer (Incyto, Korea) with a chamber volume of 10 µL and a chamber depth of 0.1 mm at total magnifications of 400× and 1,000× for fungi and bacteria, respectively. For each enumeration, three to four independent replicate volumes of fungal spores or bacterial cells, each including at least 25 fields and 200–800 total counts per each 0.1 mm³ volume of sample, were performed. Replicate results were pooled, averaged, and standard deviation of microorganism concentrations was determined.
Accuracy and precision
Accuracy is defined as the closeness of agreement between a measured value and a true value (Brown and Hambley, 2002). The accuracy of environmental dust sample analysis is limited by the extraction efficiency of dust removal from carpet as well as the extraction of DNA from cells. To determine the extraction efficiency of dust from carpet (ηcarpet) approximately 250 mg of dust was measured, and the mass was recorded. The dust was embedded into carpet squares and then collected using two different filter types by vacuuming as described below. The amount of dust recovered after embedment into the carpet was divided by the amount of dust initially embedded into the carpet (Equation 1). Nine independent ηcarpet experiments were performed for each of the six cases utilizing the thimble filter (three test organisms and two carpet piles). Nine independent ηcarpet experiments were performed for each of the nine cases utilizing the microparticle adapter for low pile carpet and one medium pile carpet replicate (one test organism, three different dust masses, and filter):
To determine the DNA extraction efficiency from collected dust (ηDNA), the DNA from a 20 µL aqueous solution (the same amount spiked into dust samples) of cells/spores from each test microorganism was extracted. Dust masses of 5, 10, and 25 mg were measured to analyze the how different dust masses impact extraction efficiencies. This extraction was measured on both qPCR and dPCR using the assays described below to determine the number of cell equivalents in that solution. The measured dPCR value was compared with the measured qPCR value (Equation 2). qPCR values account for the DNA extraction efficiency by using a calibration curve of standard dilutions, which were extracted in the same manner as the samples. Comparing the same sample on dPCR and qPCR will quantify this efficiency. Five replicate DNA extraction efficiencies were determined for each organism:
Precision is the closeness of agreement among repeated measured values under unchanged conditions (Brown and Hambley, 2002). In this case, precision is separated into reproducibility, which is the total precision, and instrument repeatability, which is the precision associated with the analytical instrument. To determine reproducibility for A. fumigatus, B. atrophaeus, and E. coli, nine independent 250 mg portions of dust were spiked with each respective organism and then processed using our sample collection procedure (Fig. 1). The CV was calculated as a measure of reproducibility. Reproducibility experiments were conducted in batches of three and involved three separate operators to minimize user biases. Instrument repeatability experiments for A. fumigatus included repeating qPCR and dPCR analysis at least seven times for each organism spike. Instrument repeatability was also quantified by calculating the CV of replicates.
Spiking dust with microorganisms
For these spiking experiments, dust was collected from a home vacuum bag and then passed through a 300-μm sieve to obtain fine dust particles and stored at room temperature for later use. Aluminum foil previously baked to 500°C for 4 h was used to weigh out approximately 250 mg of dust for each spike. All dust and foil were weighed using a Mettler Toledo XSE105 analytical balance (Mettler Toledo, Columbus, OH) to track the losses at each step of the embedment and extraction procedure. This study was not human subjects research.
Two pile types of carpet (Fig. 2) were used to get a range of efficiencies to mimic the many different types of carpet used within homes. We used a 1 cm pile nylon carpet referred to as the low pile and a 2 cm pile nylon carpet referred to as the medium pile. The carpet used for embedment of the dust was cut into 7 cm × 7 cm square coupons from a new roll of carpet that had never been used in a home. For each pile type, 9 separate carpet squares were cut, and 9 corresponding microorganism-loaded dust samples were used for embedment for a total of 18 replicates per organism. For all 3 organisms and 2 pile types, there were 54 total carpet squares. The carpet squares were vacuumed for 2 min before use to minimize the presence of any dust present in the carpet before adding test microorganism spikes. The carpet squares were new (never used) and were vacuumed before use in the experiment as described to remove any excess fibers or dust from manufacturing.
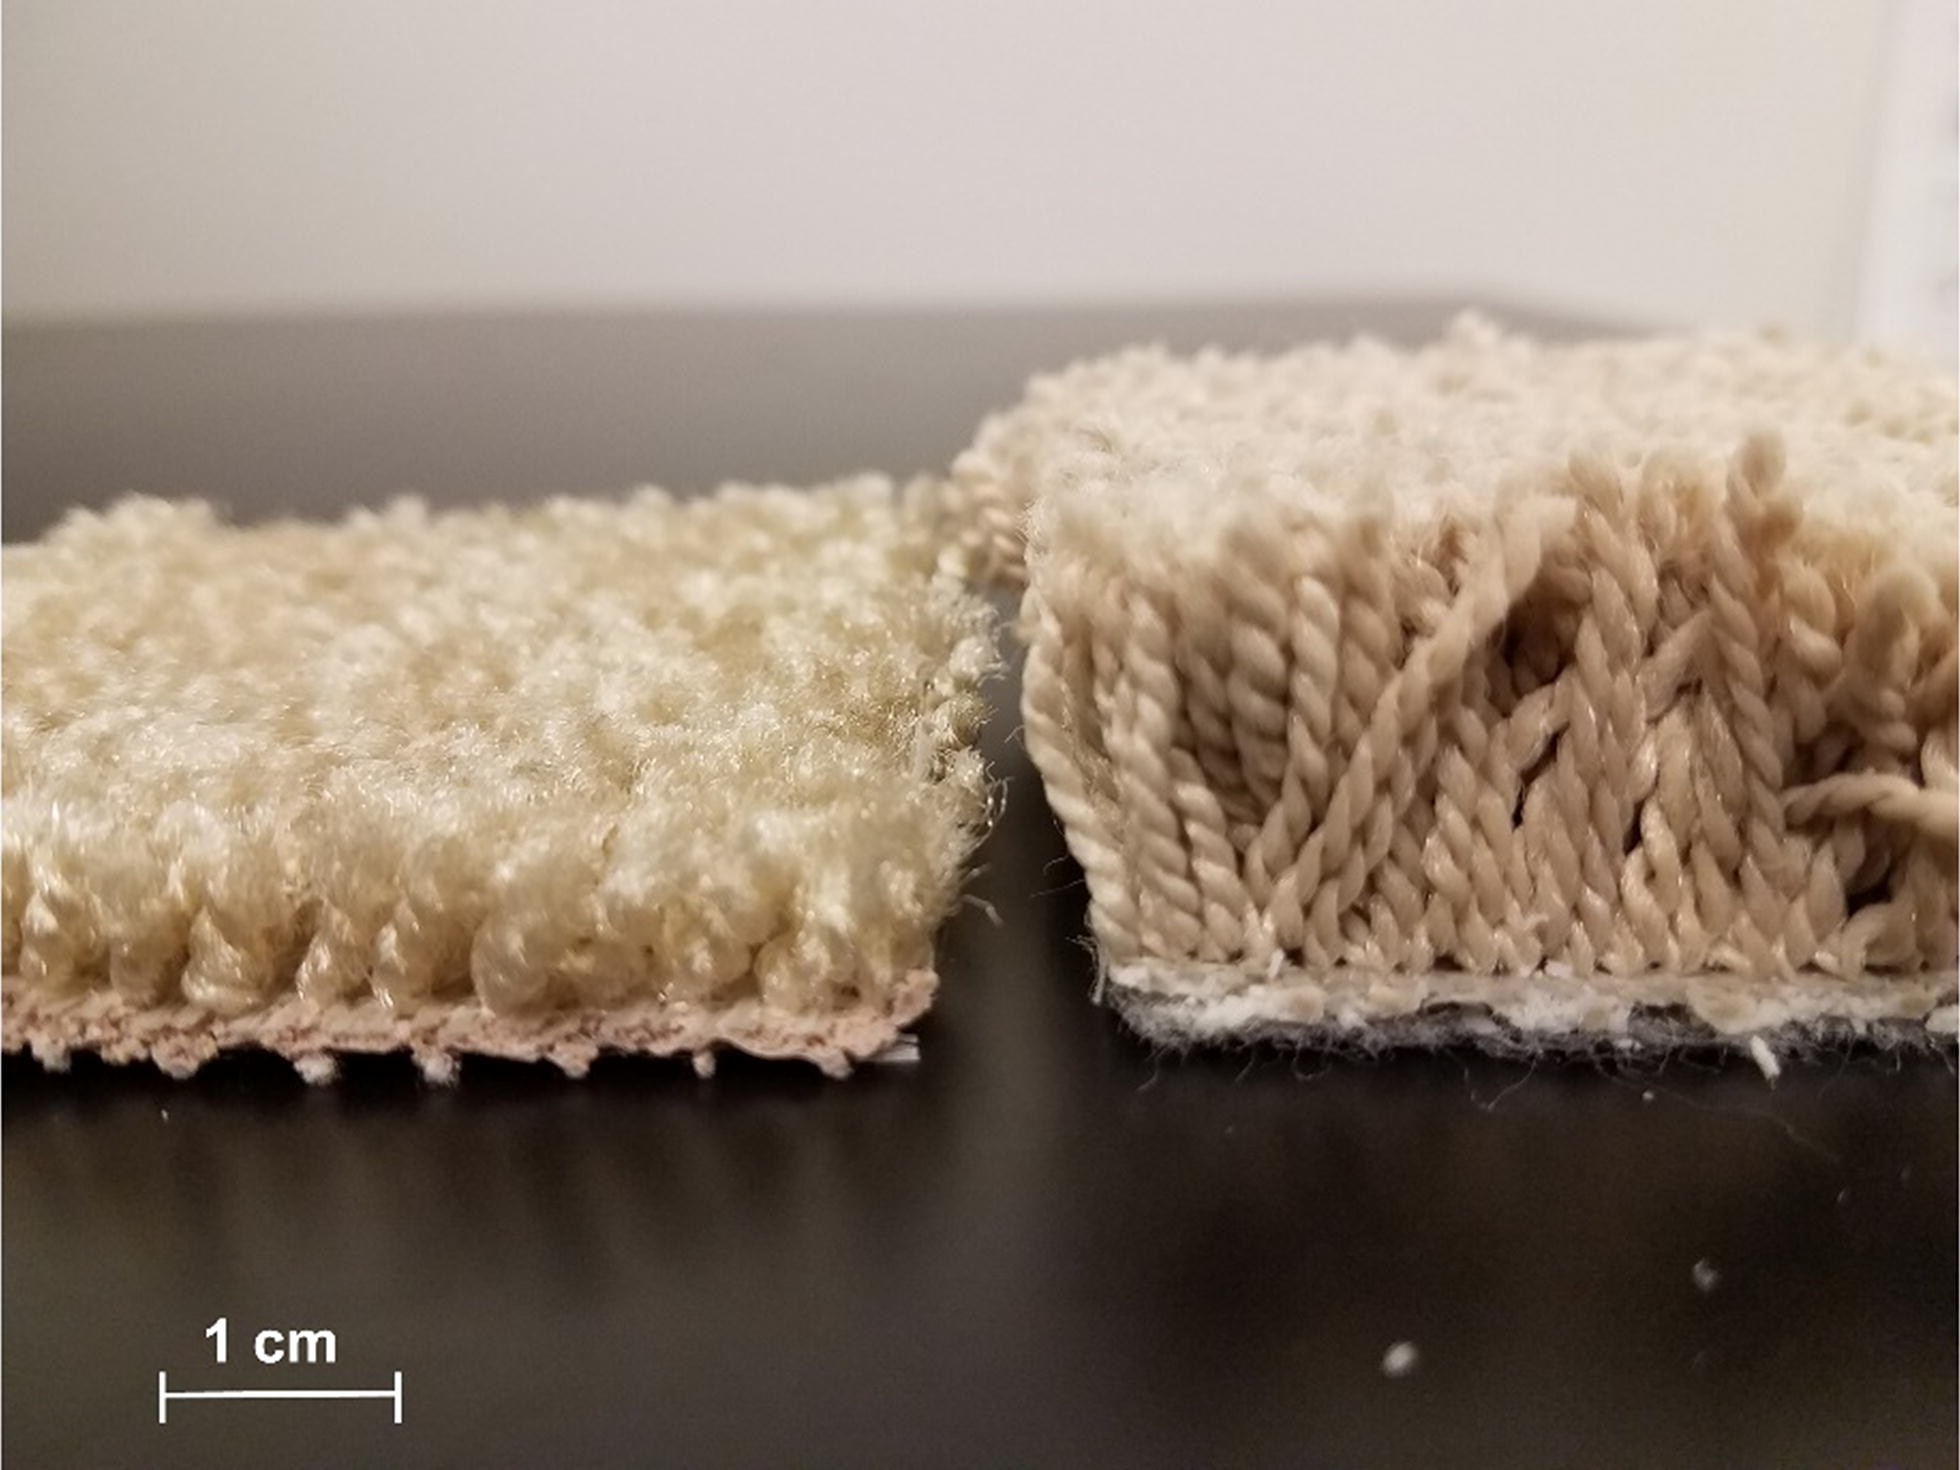
Nylon carpet squares used for spiking experiments. The low pile (left) carpet has a pile height of approximately 1 cm. The medium pile (right) carpet has a pile height of approximately 2 cm.
For each organism prepared previously, 20 µL of the aqueous solution with a known number of microorganisms was added to 100 µL of 95% ethanol. Concentrations were chosen to be orders of magnitudes greater than what would be found in a home. This solution was transferred onto the dust and slightly mixed and then left to sit for 1 h allowing for evaporation of the ethanol. Once dry, the dust was sprinkled onto the carpet square avoiding the outer 1 cm closest to the edges to avoid edge effects. To ensure all the dust and spike were delivered to the carpet, the foil was placed on the carpet square, dust side down, before embedment. The dust was then embedded using the ASTM method F608-13 modified by using a 12-cm-long, 1440 g steel pipe (Dannemiller et al., 2017).
Dust collection
Two different collection devices were used to recover embedded dust from carpet, both with advantages for different study applications. The two methods have different filter shapes and vacuum adapters.
Dust was first collected using a 19 mm × 90 mm Whatman cellulose extraction thimble (Whatman, Tewkesbury, Mass) inserted into a Eureka Mighty Mite vacuum (The Eureka Co., Bloomington, IL) using a cylindrical adapter (Fig. 3.A) (Dannemiller et al., 2017). The cellulose thimble has a 10.0 μm nominal particle size retention. The carpet was vacuumed in a linear motion moving up and down the carpet square and then in a circular motion for approximately 2 min. For each sampling device connected to our sampling vacuum, air velocity was measured using a Testo 417 rotating vane anemometer (Testo SE &Co. KGaA, Germany) (100 mm vane diameter). For each air velocity measurement, the anemometer reading was allowed to stabilize for at least 30 s before values were recorded. Readings were repeated in triplicate, allowing at least 30 s between measurements. Each measurement was taken using tight fitting 3D-printed adapters, ensuring no loss of air flow. The values are reported in Table 1. The dust was stored securely inside the folded thimble held with a binder clip at −20°C until further analysis.
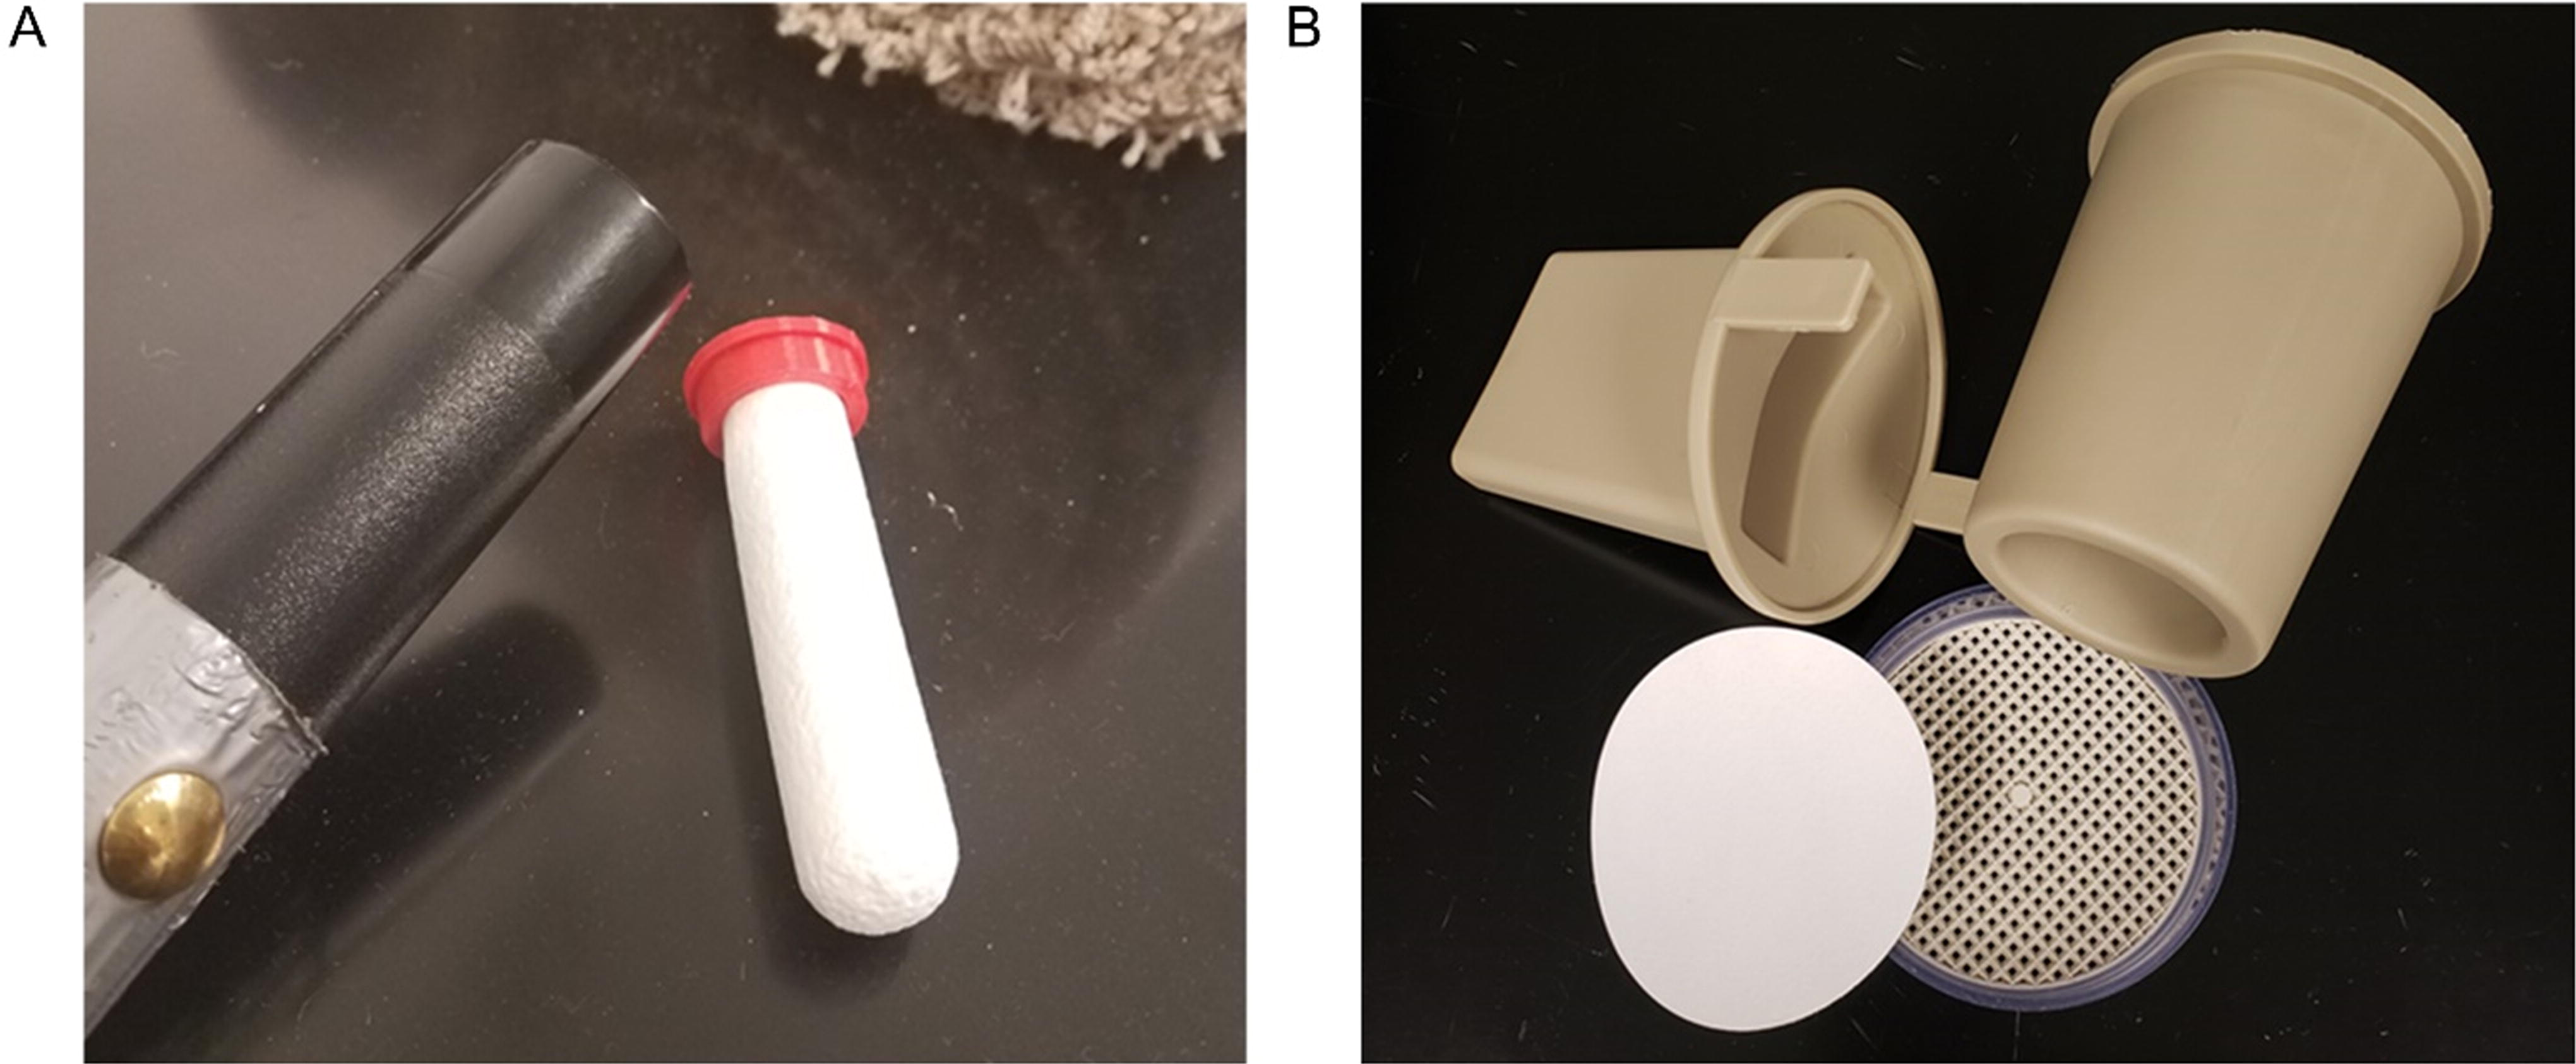
Whatman cellulose extraction thimble inserted into a Eureka Mighty Mite vacuum using a cylindrical adapter
Face Velocity (m/s) for the Sampling Devices
The second collection device utilized a Microparticle Vacuum Adapter (Sirchie; Youngsville, NC) equipped with a flat 70-mm-diameter Whatman Grade 2 Qualitative Filter Article, which fits inside the adapter (Fig. 3.B) (Acosta et al., 2008). This filter has an 8.0 μm nominal particle size retention. The dust was collected using the same motions used for the thimble filter collection for approximately 2 min. The apparatus was removed from the vacuum wand and separated so that the filter could be carefully removed. The dust was collected on a piece of foil and the filter and dust were stored together folded within the foil. The foil was placed securely in a plastic bag and was stored at −20°C until further analysis.
For both collection methods, the carpet squares were weighed on an analytical balance before the dust spiked with organisms was embedded and weighed again after embedment of the dust. To determine extraction efficiencies associated with environmental samples of house dust retrieved from the carpet, all dust and carpet weight were necessary to track throughout the experiment. Spiking cells into the dust allows for a known starting concentration and enables the absolute estimation of sample preparation losses and method detection levels.
DNA extraction and PCR
To determine DNA extraction efficiency, dust was removed from the thimble filters or collected from the circular filter foil pouches and weighed. Aliquots of the weighed dust were then placed into 2.0 mL screw top vials for extraction. Dust from the thimble filters was aliquoted in 50 mg amounts for extraction. For the microparticle adapter, dust was aliquoted in 5 mg, 10 mg, and 25 mg amounts for extraction both with and without ¼ portion of the filter article. DNA from the dust was extracted using the manufacturer’s protocol for the MoBio PowerSoil DNA extraction kit (MoBio, Carlsbad, CA, USA) that was modified to enhance DNA recovery with additional beads for bead beating (Yamamoto et al., 2015). For each sample, 0.3 g of 100-μm-diameter beads, 0.1 g of 500-μm-diameter beads, and 1 g of power beads were used for bead beating. The DNA extract solution had a final elution volume of 50 µL and was then diluted to 1/10th of its initial concentration using Tris-EDTA (TE) to prevent DNA degradation. To test for inhibition, a subset of the samples was spiked with a known concentration of DNA from a standard solution of either 106 B. atrophaeus cells or 108 A. fumigatus spores to test for both bacterial and fungal inhibition. Inhibition would be detected if the concentration observed for these spikes was different from the expected value by an order of magnitude or more. No inhibition in any samples was detected in this study.
qPCR was performed using a QuantStudio 6 Flex Real Time PCR System (Applied Biosystems, Forest City, CA). The assays utilized in this study are well established and have previously been used in bioaerosol research (Hospodsky et al., 2010). Specific primers and TaqMan probes selected for each microorganism were selected for genes with a single copy in the genome and included the following (Hospodsky et al., 2010): for E. coli, uidA primer and probe set (forward [F], 5′-GGGCAGGCCAGCGTATC; reverse [R], 5′-CCCACACTTTGCCGTAATGA; probe, 6-FAM-5′-TGCTGCGTTTCGAT GCGGTCA-3′-BHQ-1, where FAM is 6-carboxyfluorescein and BHQ Black Hole Quencher dye); B. atrophaeus, recA gene primer and probe set (F, 5′-ACCAGACAATGCTCGACGTT; R, 5′-CCCTCTTGAAATTCC CGAAT; probe, 6-FAM-5′-ACTGAACAGCTGATCGAGACAGCTGC-3′-BHQ-1); and for A. fumigatus, pyrG primer and probe set (F, 5′-CAGCCCCGGGAAACTCA; R, 5′-TCCGCTCCCTTGACAGCTT; probe, 6-FAM-5′-CCAGACCAATGTTCCTGAG-3′-BHQ-1). The amplicon sizes were 293 bp, 131 bp, and 56 bp, respectively. For all three assays 25 µL of qPCR mixtures was prepared. For E. coli and B. atrophaeus, the mix contained 12.5 µL of 2X TaqMan Universal PCR Master Mix (Applied Biosystems, Forest City, CA), 0.8 µL of a mixture of each 10 µM primer and 5 µM probe, and 2 µL of DNA template. For A. fumigatus, the PCR solution contained 12.5 µL of 2X TaqMan Universal PCR Master Mix, 1.0 µL of a mixture of each 10 µM primer and 10 µM probe, and 2 µL of DNA template. qPCR was performed with thermal cycling conditions requiring an initial 2-min denaturation at 50°C and 10 min of further denaturation at 95°C, followed by 45 cycles of 15 s of denaturation at 95°C and 60 s of annealing/extension. Annealing temperatures used for E. coli, B. atrophaeus, and A. fumigatus were 53°C, 56°C, and 60°C, respectively. Standard curves were developed for each qPCR bacterial and fungal species using dilutions from a known concentration of genomic DNA, which is a common procedure used for analysis of indoor environmental samples. For each qPCR run, two TE blanks were run as negative controls and each sample was run in triplicate.
dPCR was performed using the QuantStudio 3D Digital (QS3D) PCR System (Applied Biosystems, Forest City, CA) that utilizes a chip-based technology. This system uses a QuantStudio 3D Digital PCR Chip Adapter Kit for the ProFlex Flat Block Thermal Cycler, which holds the chips (version 2) in place during thermocycling. The PCR mix was prepared using the same primers and probes as specified for qPCRs. The reaction volume was lowered to 15 µL in total. The E. coli and B. atrophaeus reaction mixtures utilized 7.5 µL of QuantStudio 3D Digital PCR Master Mix v2 (Applied Biosystems, Forest City, CA), 0.8 µL of a mixture of each 10 µM primer and 5 µM probe, and 2 µL of DNA template. For A. fumigatus, the PCR solution contained 7.5 µL of QuantStudio™ 3D Digital PCR Master Mix v2, 1.8 µL of a mixture of each 30 µM primer and 10 µM probe, and 2 µL of DNA template. The chip is heated to 30°C to and the reaction mixtures for each sample are individually loaded into the QuantStudio 3D Digital PCR Chip Loader using a plastic applicator. This method distributes the sample evenly across the chip depositing DNA template into individual wells where separate reactions take place. The lid was applied and enough immersion fluid (included in the QS3D kit) was added to fill the space between the chip and the lid. The same thermocycling conditions were used for the dPCR chips that were used for qPCR. Once the PCRs were complete, the chips were imaged using the 3D dPCR system and analyzed with the QuantStudio 3D AnalysisSuite Software. While performing assay optimization for this study, CLC Sequence Viewer 7 was utilized to select BamHI as an appropriate restriction enzyme to cut the DNA between regions of interest when utilizing a universal fungal assay (Zhou et al., 2000).
Statistical analysis
Statistical analysis was conducted using Stata Statistical Software, release 15 (StataCorp LLC., College Station, TX, USA). We compared extraction efficiencies in different carpet pile types using a two-tailed t test. We also compared differences in the amount of dust extracted with and without a portion of the filter using a two-tailed t-test. Statistical significance was defined as p > 0.05. CV values were calculated as described above.
Results
Accuracy
We determined the accuracy of microbial concentration measurements from dust in carpet by measuring the difference between measured values on qPCR and dPCR. The difference between the measured value on qPCR or dPCR and the actual concentration in the sample is dependent on the efficiencies of sample collection and efficiencies of DNA extraction from cells and spores.
The efficiencies associated with sample collection from carpet (ηcarpet) were determined using both the collection devices. For the thimble filter, efficiencies were determined for low pile carpet and medium pile carpet for each test organism. These extraction efficiencies are present in Figure 4 and Table 2 and ranged from 56% to 97%, with low pile carpet exhibiting a higher average recovery efficiency than medium pile carpet using. When comparing low pile carpet and medium pile carpet, a two-tailed t-test at 95% confidence level indicated a significant difference for ηcarpet between the two carpet pile types (p = 0.038). There were also significant differences observed between ηcarpet for the fungal species and bacterial species. A. fumigatus extraction efficiencies were statistically significantly lower for both carpet pile types compared with the bacterial organisms (Low Pile p = 0.028, Medium Pile p < 0.0001).
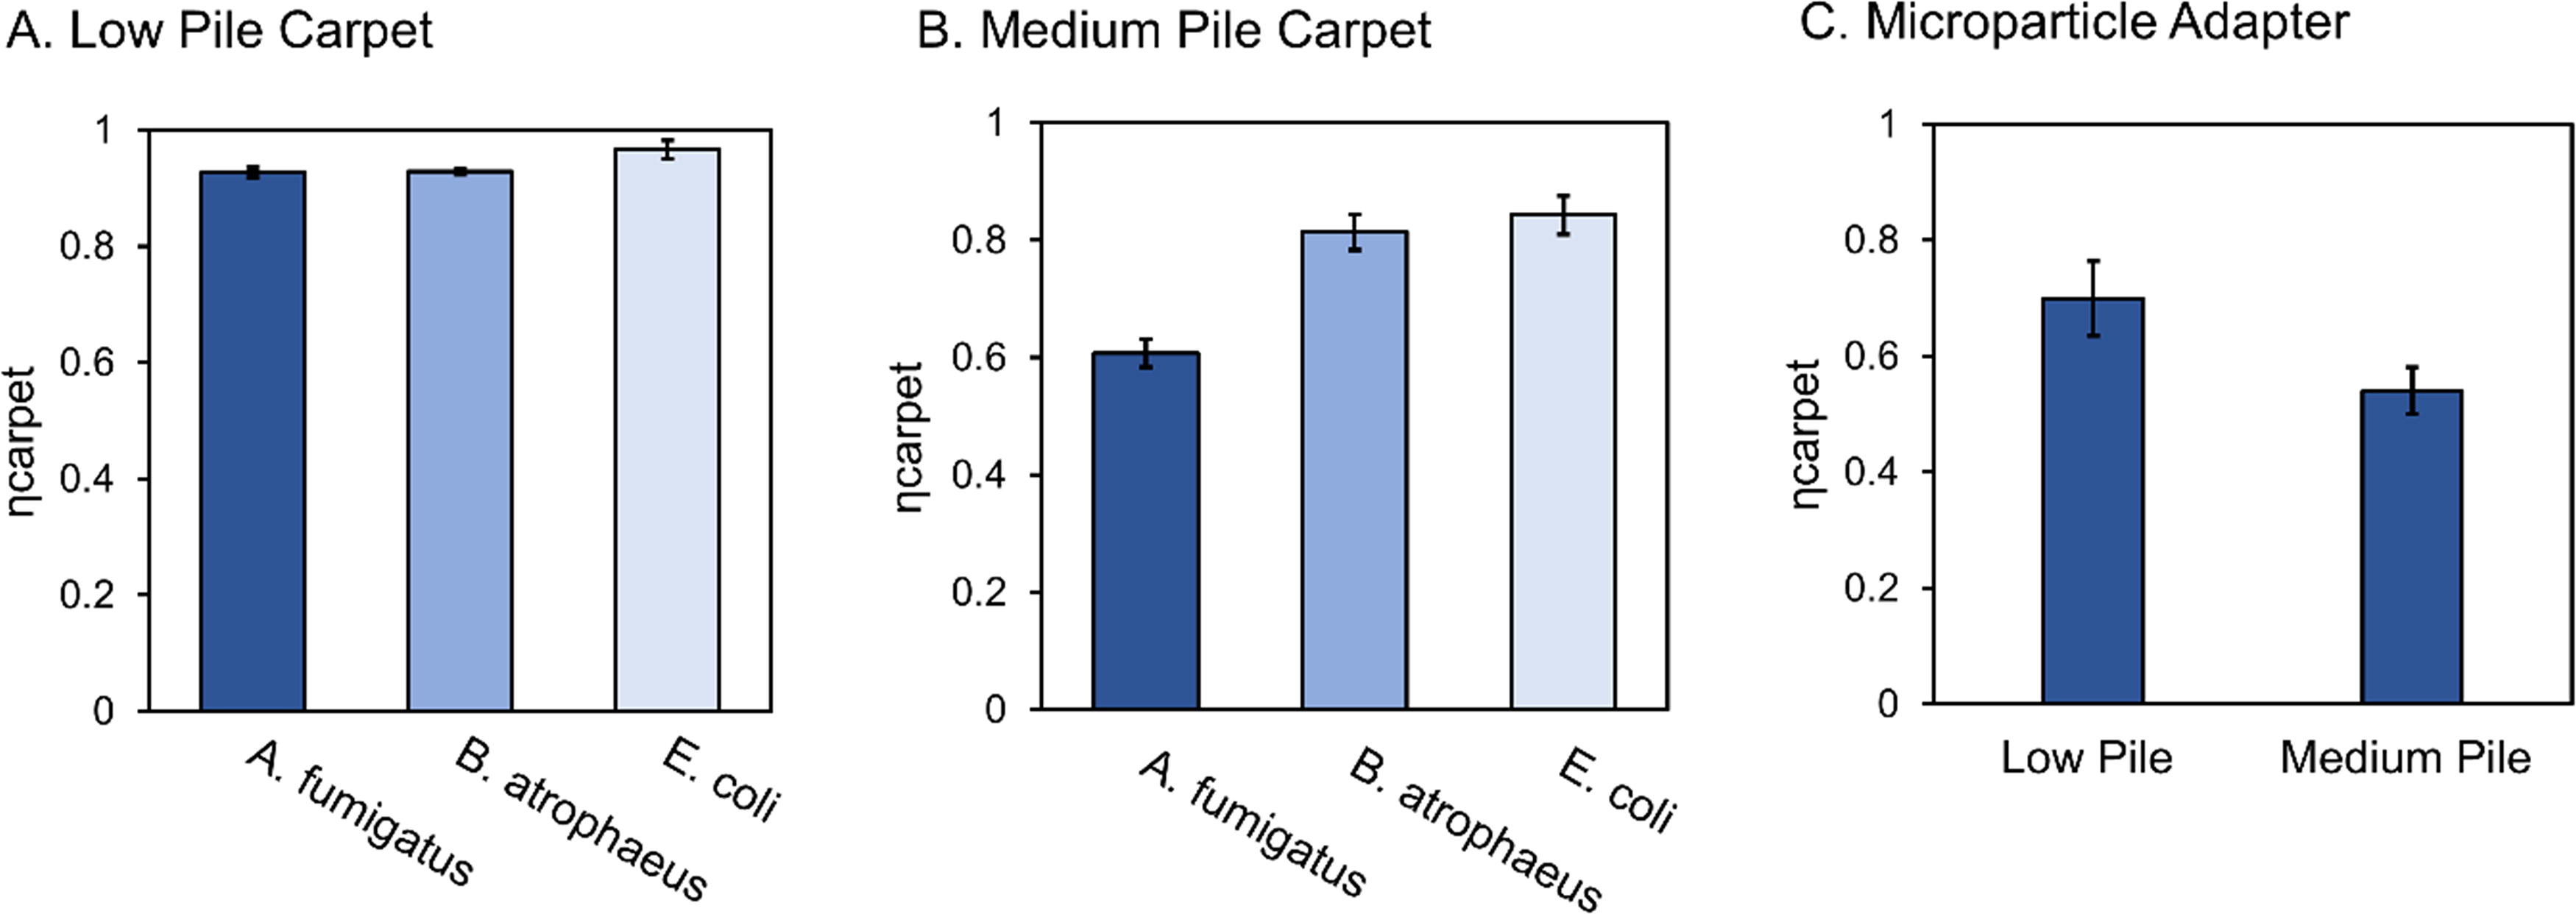
Efficiency of sample collection using the thimble filter associated with recovery of A. fumigatus, B. atrophaeus, and E. coli spiked onto dust and embedded into carpet for low pile carpet
Efficiency Values.
DNA Extraction Efficiencies Are Reported for Each Organism (n = 5), Carpet Collection Efficiencies for Each Organism and Pile Type (n = 9 for Each Organism and Pile Type), Overall Efficiencies Associated with Preparing Indoor Environmental Dust Samples Using the Thimble Filter for PCR Analysis and the Factor by Which Measured Dust Samples Would Underestimate True Concentrations Without Incorporation of These Efficiencies. Overall Efficiencies Were Calculated by Multiplying ηDNA and Ηcarpet Together. The Underestimation Potential Was Calculated by Dividing 1 by the Overall Efficiency.
For the microparticle vacuum adapter, the efficiencies associated with sample collection from carpet (ηcarpet) were determined using A. fumigatus for both low and medium pile carpet. Dust was recovered with a 70% efficiency for low pile carpet and 54% efficiency for medium pile carpet (Fig. 4.C). Similar to the thimble attachment, low pile carpet exhibited a higher average recovery efficiency than medium pile carpet using. Although overall, the microparticle vacuum adapter collected dust less efficiently compared with the thimble filter. For low pile carpet, the thimble attachment collected 32% more dust compared with the microparticle adapter, and for medium pile carpet, the thimble filter collected 16% more dust compared with the microparticle adapter. When comparing the different qPCR-measured spore quantities for samples with and without a filter, a two-tailed t-test at 95% confidence level indicated no significant difference (p = 0.986) (Fig. 5).

Comparison of qPCR-measured A. fumigatus spore quantities with different aliquots of dust masses extracted with and without filter. Error bars represent standard error (n = 9 experiments).
The DNA extraction efficiencies (ηDNA) are the ratio of extracted DNA concentrations measured on the dPCR instrument to DNA concentrations measured on the qPCR instrument. The percent extraction efficiencies, ηDNA, and the standard deviations for five independent experiments for each test organism are presented in Table 2. These ranged from 10.5% efficiency for E. coli cells to 28.2% efficiency for A. fumigatus spores. The combined overall efficiency associated with DNA extraction and sample collection can be combined by multiplying ηDNA by ηcarpet. These overall efficiencies for each organism and pile type are reported in Table 2. Measured microbial dust concentrations would underestimate the true concentration on average by 3.7 to 11.2 times without inclusions of these efficiencies in sample concentration calculations.
Accurate measurement by dPCR requires that the concentration be within a smaller range than qPCR. For the most accurate measurement, a prior estimation of sample concentration is necessary. The chip-based technology used here has a preferred concentration range of 200–2000 copies/µL (Majumdar et al., 2015). When including extraction efficiencies, our environmental sample measurements were accurate within that concentration range (Fig. 6).

The accuracy of sample measurements on dPCR over a range of concentrations (black dots). The expected concentration is based on spore counts and the observed concentration includes extraction efficiencies. The line represents a 1:1 relationship between the concentrations.
Precision
Precision was separated into reproducibility and instrument repeatability. Reproducibility includes the variation in the overall process such as error from sample loading, sample preparation, and any inherent error in analytical instruments. Instrument repeatability only includes the error due to the analytical instrument. Figure 7 shows the reproducibility (empty circles) of qPCR and dPCR results from samples near the detection limit. The concentration detected on qPCR and dPCR was adjusted for ηDNA and ηcarpet using the overall values listed in Table 2. The importance of including these extraction efficiencies in measured results is demonstrated in that they appropriately adjust the measurements to the true value (solid circle).
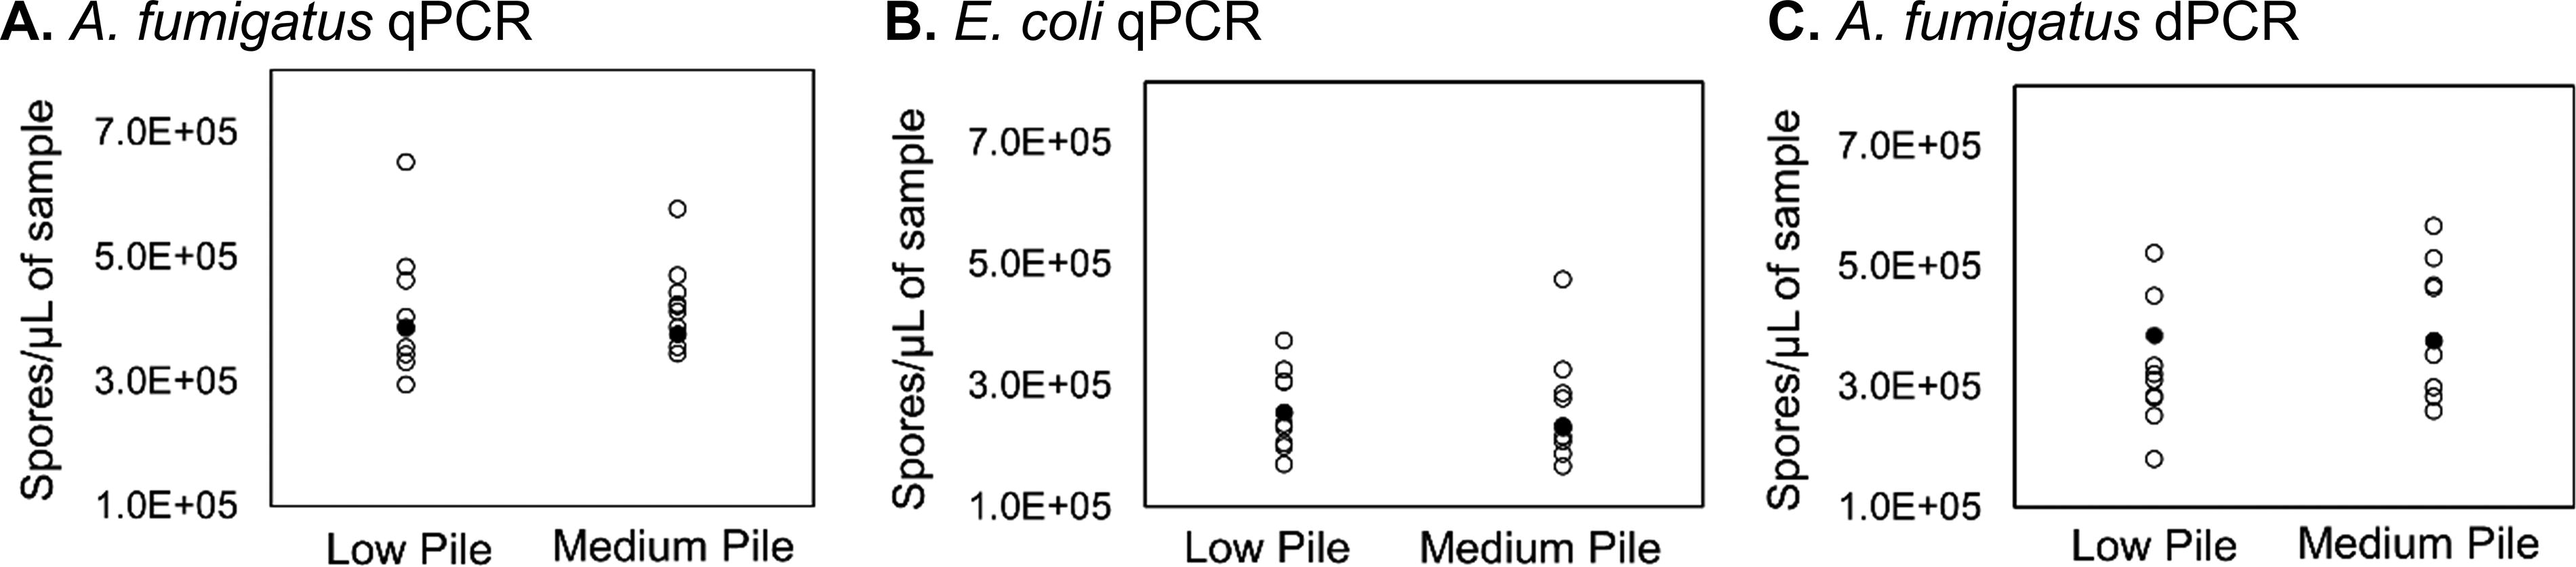
Reproducibility of qPCR near detection limits for A. fumigatus
The CVs of the detected gene copy quantities were calculated to assess the overall reproducibility of qPCR results for E. coli, A. fumigatus, and B. atrophaeus (Table 3). The qPCR reproducibility CVs for low pile carpet ranged from 13% to 26%, averaging 22% and for medium pile carpet ranged from 16% to 36% averaging 23% for all test organisms. The CV value for qPCR instrument repeatability was 64% for A. fumigatus, which we expect to be representative of DNA from any organism when measured near the detection limit. The CV value for dPCR instrument repeatability was 47% for A. fumigatus at the same concentration that was measured on qPCR. Instrument repeatability contributed to more than half of the overall reproducibility for qPCR, and although dPCR instrument repeatability contributed less, it accounted to almost half of the overall reproducibility as well. However, instrument repeatability can be improved if the DNA concentration of a sample is substantially higher than the detection limit.
Reproducibility as Coefficient of Variation (CV) (n = 9) of qPCR Measurements of Test Organisms Spiked into Dust, Embedded into Carpet, and Recovered via Vacuuming
Discussion
The DNA extraction efficiency and dust sample recovery efficiency were less than 100% and were different based on carpet pile and organism type. Thus, excluding these values may cause an underestimation of microbial concentrations and exposures. Overall, the most substantial losses occur during DNA extraction; most of the dust that was embedded into our clean carpet can be removed by vacuuming when measured by mass differences. There were some differences in dust recovery from carpet based on pile height, but overall, these differences were also small when compared with DNA extraction efficiency losses. When considering reproducibility, the largest uncertainties were caused by the instrument repeatability. However, these measurements were performed near the limit of detection. Increasing the quantity of sample template will improve instrument repeatability. dPCR offers less variability when measuring microbial concentrations at lower concentrations compared with qPCR using our protocols. There was approximately a 20% decrease in the amount of variability in measurements near the detection limits for dPCR compared with qPCR.
Our findings are similar to the efficiencies observed using other sampling methods. We selected organisms that are commonly used in bioaerosol sampling studies and represent a range of organisms found in the indoor environment (Hospodsky et al., 2010; Lee and Kim, 2003). These airborne particles eventually settle and become incorporated in house dust, which can then become resuspended due to human occupancy and become airborne once more (Gomes et al., 2007; Raja et al., 2010). E. coli and B. atrophaeus are bacteria with different types of cell walls, and one is gram-negative (E. coli) and the other is gram-positive (B. atrophaeus). Thus, these species cover a broad range of resistance to cell lysis. Fungal spores from A. fumigatus were used due to the allergic and infectious potential and the high prevalence in the environment (Latgé, 1999; Low et al., 2011). Our results can then also be compared with previous work using these organisms (Hospodsky et al., 2010). The percent extraction efficiency, ηDNA, and standard deviations for the three test organisms reported in Hospodosky et al. using aerosol filters were as follows: E. coli, ηDNA of 16.3% ± 2.1%; for A. fumigatus, ηDNA of 8.8% ± 0.7%; and for B. atrophaeus, ηDNA of 8.3% ± 1.0% (Hospodsky et al., 2010). These values are comparable with our results reported in Table 2, although our extractions had more variation within the 5 independent extractions. DNA extraction was the most pronounced source of inefficiencies in sample processing for carpet samples and aerosol filters.
The findings of this study have important implications for measuring exposures to microorganisms in the indoor environment. Exposure to dampness, moldy odor, and visible mold growth is associated with negative respiratory effects, but the causal mechanism remains unclear (Mendell et al., 2011). These new DNA-based techniques represent an important advancement that improves our measurement ability. More accurate and precise measurements may enhance our ability to identify associations between these exposures and human health outcomes in epidemiological studies (Dannemiller et al., 2016b). In this study, we demonstrate that extraction efficiencies need to be included in calculations to prevent underestimation or bias in exposure estimates.
For sample processing, experimental designs should include enough replicates to allow for observation of the error over the entire experimental procedure. The error associated with reproducibility will be higher when including collection and extraction efficiencies due to variation in yields and the presence of different inhibitors to the PCR (Bustin et al., 2009; Huggett et al., 2013). Our precision measurements were conducted near the limits of detection to define these parameters. Absolute precision is dependent on the mean number of molecules per partition, which is influenced by the original sample concentration, dilution, and sample preparation.
The assays used in this study were selected because the region of interest for each organism occurs only one time on the genome. We found that pure cell DNA extract demonstrates the existence of repeat regions of interest, known as concatemers. If assays were selected that have more than one copy per genome, it would be important to account for the presence of concatemers when using dPCR in the protocol. Concatemers naturally occur in eukaryotic, bacterial, and virial genomes. The presence of these repeats affects measured concentrations for dPCR when using assays that target these regions. These repeated regions will tend to move together into partitions in dPCR because they are on the same strand of DNA, which violates the assumptions based on Poisson statistics used in the analysis. During evaluation, some method of physical separation is required to independently measure these sequences. While performing assay optimization for this study, CLC Sequence Viewer 7 was utilized to select BamHI as an appropriate restriction enzyme to cut the DNA between regions of interest when utilizing a universal fungal assay (Zhou et al., 2000). The use of restriction enzymes or some other method of separation is required if a community overview is desired instead of analysis of a single gene copy present in a specific organism.
A limitation of this design is that spiking cells into dust may not accurately capture the interaction between the dust and cells as they are deposited into the carpet and then removed by vacuuming and the spike may not be homogenously mixed despite our efforts. The carpets in our study were clean and the dust was recently embedded, and thus, recovery of older dust from dirtier carpets with more wear may vary. The vacuuming technique used in this study will not be the same as what usually occurs in a home to vacuum large areas of carpet. In homes, dust may fall deeper into the carpet over time, especially if cleaning is infrequent. Other studies have measured lower recovery efficiencies from worn dirty carpets (Salares et al., 2009). Different dust matrices can impact inhibition on a sample-to-sample basis and could be significant in other studies even though no inhibition was observed in this study. The estimates of variability in this study are influenced by organism and sampling processing protocols; therefore, they are not applicable to all indoor environmental microbiome studies. The size of the extraction aliquot may also impact the coefficient of variation (CV) (Yusri, 2020). Our efficiency calculation (Equation 2) does incorporate some assumptions, including that these are indeed single copy genes. However, this study does indicate the importance of establishing these parameters in laboratories that perform PCR analysis on indoor environmental samples with each specific protocol. Estimates presented here include gram-positive and gram-negative bacteria, representative of a range of cell lysis potential and a common fungal species. A relatively common DNA extraction procedure and PCR protocols are used here to ensure that these ideas are generalizable to a broad range of applications. Adjustment to the amount of dust analyzed and dilution values can be the subject of future investigations for assay optimization.
Conclusion
As PCR technologies advance, defining accuracy and precision of specific analysis methods needs to be updated to ensure that results enable mechanistic investigation of the fate and sources of indoor microbial communities. The information in this study will be used in future work analyzing microbial communities and allergens present in settled carpet dust. Epidemiological studies examining human health impacts can incorporate these efficiencies to better estimate indoor microbial exposure. Residential exposures are recognized risk factors for asthma and these exposures may be responsible for up to 44% of physician-diagnosed asthma cases (Lanphear et al., 2001). The attributable cost of respiratory disease resulting from residential exposure to mold alone is estimated to be $22.4 billion (DH, 2016). These improved measurements may better facilitate discoveries of associations between microbial exposures and human health in the indoor environment.
Footnotes
Acknowledgments
The authors would like to thank the members of the Indoor Environmental Quality Laboratory for their support and insight, which helped them develop these sampling protocols. The authors would also like to thank Jenny Panescu, Andrew Keep, Nick Nastasi, and Jordan Clark for assistance with measuring the face velocity values in ![]() .
.
Authors’ Contributions
K.D. conceptualized the study, acquired funding, and supervised the work. All authors collaborated on developing the methodology. A.B., S.J., and D.K. completed the experiments and analyzed the data. A.B. wrote the original draft. All authors reviewed, edited, and approved the final version of the article.
Author Disclosure Statement
The authors declare no conflicts of interest.
Funding Information
We would like to acknowledge the National Institutes of Health grant R21AI168817, the Alfred P. Sloan Foundation for grant G-2016-7164, and The Ohio State University start-up funds for supporting the project.