
Abstract
This research investigated sulfate adsorption from acid mine drainage (AMD) contaminants on red mud (RM) and its neutralization as a by-product generated from the alumina-producing process. Simulation and laboratory studies were applied to describe the adsorption mechanism better. Seawater washing and hydrochloric acid (HCl) treatment were used as modified methods for pH reduction and increasing the adsorption capacity of RM. These results illustrate that applying modified methods can improve the adsorption properties of RM. Experimental tests indicate sulfate removal can reach from 6.3% for RM to 29.4% for seawater washing RM (SRM) and 33.4% for acid treatment RM (ARM). Thermodynamic calculations explored reactions between RM, SRM, and ARM with sulfate ions that are exothermic and reversible and move to be more disordered. Density functional theory (DFT) study, which applies the DMol3 module to the main crystal components in RM structure, considers that all obtained adsorption energies are negative, and they tend to adsorb sulfate. Among these crystal oxides, the highest adsorption energy belongs to Fe2O3, TiO2, Al2O3, CaCO3, and SiO2 and is equal to −64.33, −32.97, −28.36, −21.9, and −14.52 kcal/mol, respectively. A simulation of the water, seawater, and acid environments was performed using the COSMO (conductor-like screening model). Major crystal oxides were simulated with 78.54, 84, and 150 dielectric constants for water, seawater, and HCl, respectively. DFT results illuminated that adsorption energies for all principal crystal oxides increased significantly via dielectric constant enhancement. These energies were calculated at −35.68, −56.69, and −85.47 kcal/mol regarding water, seawater, and HCl environment, respectively. FTIR results clarify the sharp intensity of absorption around 1,100/cm (
Introduction
Water pollution is a severe global problem requiring implications for monitoring and implementation plans deriving solutions (Geissen et al, 2015). Water pollution can be expressed as a variety of changes in water’s physical, chemical, and biological characteristics, which harm human health and living organisms (Huang et al, 2013). Acid mine drainage (AMD) is regarded to be a vital source of surface and underground water pollution all over the world. AMD can be produced by the oxidation of metal sulfides in the presence of oxygen and moisture in waste rock dumps, and stockpiles can penetrate underground water. The acidic property of AMD increases the concentration of heavy metals and intensifies their toxic and destructive effects, too (Dou et al, 2017).
One of the most critical pollutants in AMD is sulfate. The sulfate or sulfate ion is a polyatomic anion with an empirical formula
The removal processes of
As a tailing generated from the alumina-producing process, red mud (RM) is a hazardous solid waste (Ye et al, 2016). High alkalinity (pH = 12–13), large amounts, and fine-grained nature (90% below the size of 75 µm) of RM cause serious environmental problems (Li et al, 2006). The production of 1 ton of alumina generally results in the creation of 0.3–2.5 tonnage of RM (Sushil and Batra, 2008). On the other hand, RM is introduced as an unexpansive adsorbent for various contaminants because of its high metal oxide content and activated compound, containing phosphate, fluoride, cadmium, lead, copper, nitrate, arsenic, phenol, and dye (Kazak et al, 2017; Soliman et al, 2019; Sushil and Batra, 2008). Therefore, RM can be applied to remove sulfate from the aqueous phase as a potential adsorbent (Dolatabad et al, 2020). Furthermore, various methods have been utilized for its pH reduction and increased adsorption capacity, including heat activation, acid, seawater treatment, granular with bentonite or fly ash, and the presence of different surfactants. In this research, we have applied seawater washing and hydrochloride acid treatment as modification methods to increase the adsorption amount of the main adsorbent (RM).
On the other hand, computational modeling seems to be a powerful tool for studying the physicochemical phenomena that have received much attention in recent years (Ghasemi et al, 2018; Soliman et al, 2021). To investigate sulfate ions adsorption energy and behavior on RM, we studied a new approach for sulfate adsorption by performing theoretical calculations on metal oxides in the RM structure. It extends beyond the traditional static density functional theory (DFT) calculations, such as molecular dynamics simulations, geometry optimization, and vibrational frequency calculations. Remarkably, Materials Studio was used for modeling, visualization, and analysis of material systems as one of the essential software. Fe2O3, Al2O3, CaCO3, SiO2, MgO, Na2O, and TiO2 surfaces were used for these calculations (Richard, 2011). In addition, calculations were performed to utilize the continuum solvation model, namely, the conductor-like screening model (COSMO), to simulate modified methods and represent the local environments (water, seawater, and hydrochloric acid [HCl]). Finally, the results of the adsorption energies for sulfate were reported and compared in diverse local environments. The research has expanded the experimentally reported effects such as sulfate removal, adsorption capacity, and computational modeling results.
Materials and Methods
Materials
RM samples are applied as adsorbent materials. Capacity adsorption of RM and other adsorbents for sulfate removal is compared in Table 1. The RM was obtained from the Jajarm ine located 5 km northeast of Jajarm in north Khorasan Province, Iran. The X-ray fluorescence spectroscopy (XRF) results and X-ray diffraction (XRD) studies of RM are provided and shown in the Results section.
Comparison of Capacity Adsorption of RM and Other Adsorbents for Sulfate Removal
RM and other adsorbents for sulfate removal.
Experimental tests
Batch adsorption experiments were conducted in a 250 mL Erlenmeyer flask at a constant stirring rate of 270 rpm and ionic strength of 0.01 M of NaCl at room temperature. The sulfate solution with a desired concentration and contact time was prepared and placed in contact with raw and activated RM (0.5–5 g/L), which then underwent stirring. After equilibrium, supernatant solutions were separated by centrifugation and sulfate concentration in solution, which was determined by a UV-Vis spectrophotometer (model HITACHI U-2000) at 420 nm (Dong et al. 2011). All solutions were prepared with distilled water, and all experiments were duplicated. Sulfate removal (R) and adsorption amount (qe) were calculated by the following formula (Deihimi et al. 2018):
The adsorbents of preparation
The following methods were applied to increase the adsorption amount of the adsorbent. Initially, RM was micronized and then sieved through a 100-mesh screen to obtain a grain size of <150 µm. Next, RM was suspended in the solution of seawater with a solid percentage of 10% of RM for 1 h to decrease its pH (seawater washing RM [SRM]). This led to the precipitation of hydroxide, carbonate, or hydroxyl carbonate and a decrease in the pH rate to 8–8.5. Then, RM was activated via acid treatment with HCl. In the acid treatment RM method (ARM), SRM was boiled in HCl for 1.5 h at 1:10 (wt/wt) SRM/HCl solution. At the end of the experiment, the mixture was centrifuged for 10 min at 3,500 r/min. Subsequently, ARM was washed with distilled water and dried overnight at 100°C. Table 2 presents data about the effect of different dosages (0.25, 0.5, 1, 2, and 3 M) of HCl on adsorption capacity and sulfate removal percentage. Based on these remarkable results, the optimum HCl concentration was 1 M with 19.2 mg/g adsorption and 37.6% sulfate removal.
Effect of HCl Concentration on Sulfate Removal
Thermodynamic studies
To calculate thermodynamic parameters such as Gibbs free energy (ΔG), entropy (ΔS), and enthalpy (ΔH), the 250 mL of sulfate solution with 1,000 ppm concentration was prepared and stirred with 2 g/L adsorbent dosage and pH = 7 for 60 min in different temperatures. The stirring incubator was adjusted to temperatures of 298, 303, 313, 323, and 333 K, at a constant stirring rate for ΔG, ΔS, and ΔH calculations.
As can be observed from the above equation, kd is the distribution coefficient (mg/L) that was calculated in Equation 5, where C0 is the initial sulfate concentration (mg/L) and Ce is the final sulfate concentration in the solution after equilibrium adsorption (mg/L). M and V represent the weight of the adsorbent (g) and volume solution (L), respectively. In Equation 6, T denotes solution temperature (K), and R is the universal gas constant (8.314 J/mol·k). For thermodynamic parameters calculation, kd was plotted on a 1/T curve and
Molecular simulation
Main oxides were simulated for molecular modeling of sulfate adsorption on RM surface, and the reactions between these oxides and sulfate ions were calculated. The main oxides in the RM structure were considered (chemical composition amount >5%) to only simplify and minimize the calculation cost.
The molecular modeling simulation studied the adsorption mechanism of sulfate ions on RM structure. The Dmol3 module was used for DFT calculation in Material Studio software, version 2020. Iron, aluminum, calcium, silicon, and titanium oxides were modeled by the generalized gradient functional BLYP (Becke exchange plus Lee-Yang-Parr) correlation. To achieve the best possible accuracy, a double numerical method was applied to all atoms, along with p-function polarization for hydrogen atoms (DNP). The most essential convergence for geometry optimization is summarized in Table 3 (Zia et al, 2019). This work’s results were based on “all-electron relativistic” calculation without effective core potentials or pseudo-potentials.
Convergence Tolerances for Geometry Optimization Calculations
To investigate the feasibility of the reaction between the various oxides in RM structure and sulfate ion, the interaction energies of the reaction were calculated by molecular modeling. The geometry structures (products and reactants) were considered and optimized wherever there were no negative frequencies. Then, the differences in energy between reaction products were calculated from the energy of the reactants (Equation 8) (Alavi et al, 2022). In the Results section, these calculations indicate that there is a systematic conformity between the computed free energy in molecular simulation and obtained free energy from thermodynamic measurements.
Noteworthy, Fe2O3, Al2O3, CaCO3, SiO2, TiO2, and Na2O were built by the crystal structures for adsorption energy calculation. The desired elements, the number of atoms, and the appropriate lattice parameters for each structure were selected. To investigate the adsorption of sulfate ions on RM, we used the optimized crystal (with DMol3 module) as the basis of building models for RM. Afterward, the cleavage surface was created, and the 2 × 1 supercell was expanded. Finally, a vacuum slab was built with appropriate thickness for all species of crystals. In Table 4, the lattice parameter, the cleavage surface, and the cutoff distance for each structure are illustrated. After that, the optimized sulfate ion was placed near the crystals’ surface, and molecular simulations were performed with the DMol3 module. The details of the molecular simulations and our study’s results are presented in the Results section. The adsorption energy is calculated using Equation 9 (Wang and Hellman, 2018).
Lattice Parameter, Cleavage Surface, and Cutoff Distance of Mineral Structures
As mentioned above, two methods (seawater washing and acid treatment) were used in the experimental section for RM surface modification and improvement of adsorption. To simulate the modification of methods and represent the local environment (water, seawater, and HCl acid), calculations were performed utilizing the continuum solvation model, namely, COSMO. The dielectric constants of the three solutions were composed of water, seawater, and hydrochloride acid, which were considered 78.54, 84, and 150, respectively. Multipolar expansion was used to calculate the solvation energy for the whole model. Geometry optimization was validated based on the vibrational frequency analysis (Ghasemi et al, 2018).
Results and Discussion
XRD and XRF results
The XRF results are shown in Table 5, and XRD of RM is provided in Figure 1 and Table 6. The results clarify the main constituent minerals in RM composition: hematite, calcite, alumina, ilmenite, and quartz. RM comprises iron, calcium, silicon, aluminum, titanium, and sodium oxides. Seawater and HCl are used to improve the reactivity of RM as an adsorbent. A sulfate solution is prepared by sodium sulfate (Na2SO4), and the ionic strength of the solution is adjusted using NaCl (1 M). Moreover, HCl and sodium hydroxide (NaOH) are employed to adjust the pH of the solution. Merck Company supplies all reagents.
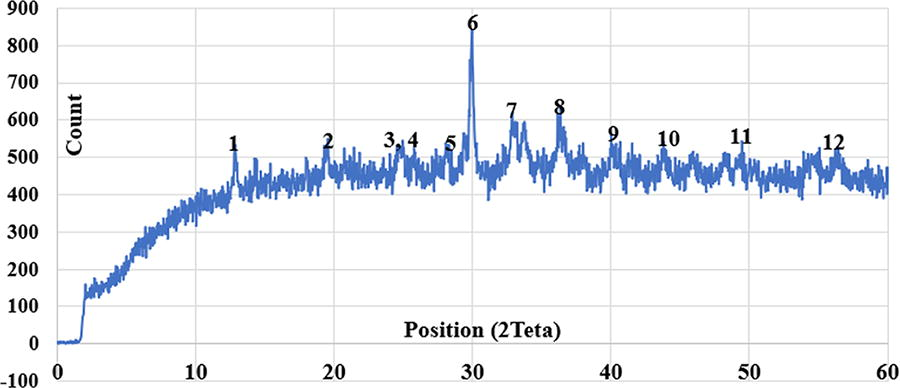
XRD results of RM sample (1: alumina, 2: paraspurite, 3: hematite, 4: ilmenite, 5: quartz, 6: calcite, 7: ilmenite and hematite 8: magnesian, 9: hematite, 10: calcite, 11: boehmite and calcite; and 12: hematite). XRD, X-ray diffraction; RM, red mud.
XRF Results and Red Mud Chemical Compositions
XRF, X-ray fluorescence.
Mineralogical Composition of Red Mud
Modeling results
Thermodynamic properties
The simulation of single clusters in the RM structure includes Fe2O3, Al2O3, CaCO3, SiO2, and TiO2, conducted in a water environment. The possible reaction products between these oxides and sodium sulfate were also simulated. DFT was applied to optimize the geometry of reactants and products under the ground state. Figure 2 shows the optimized structure of these clusters and their bond lengths and bond angles. Furthermore, the main thermodynamic properties were calculated for various reactants and products in RM reaction with sulfate ion.
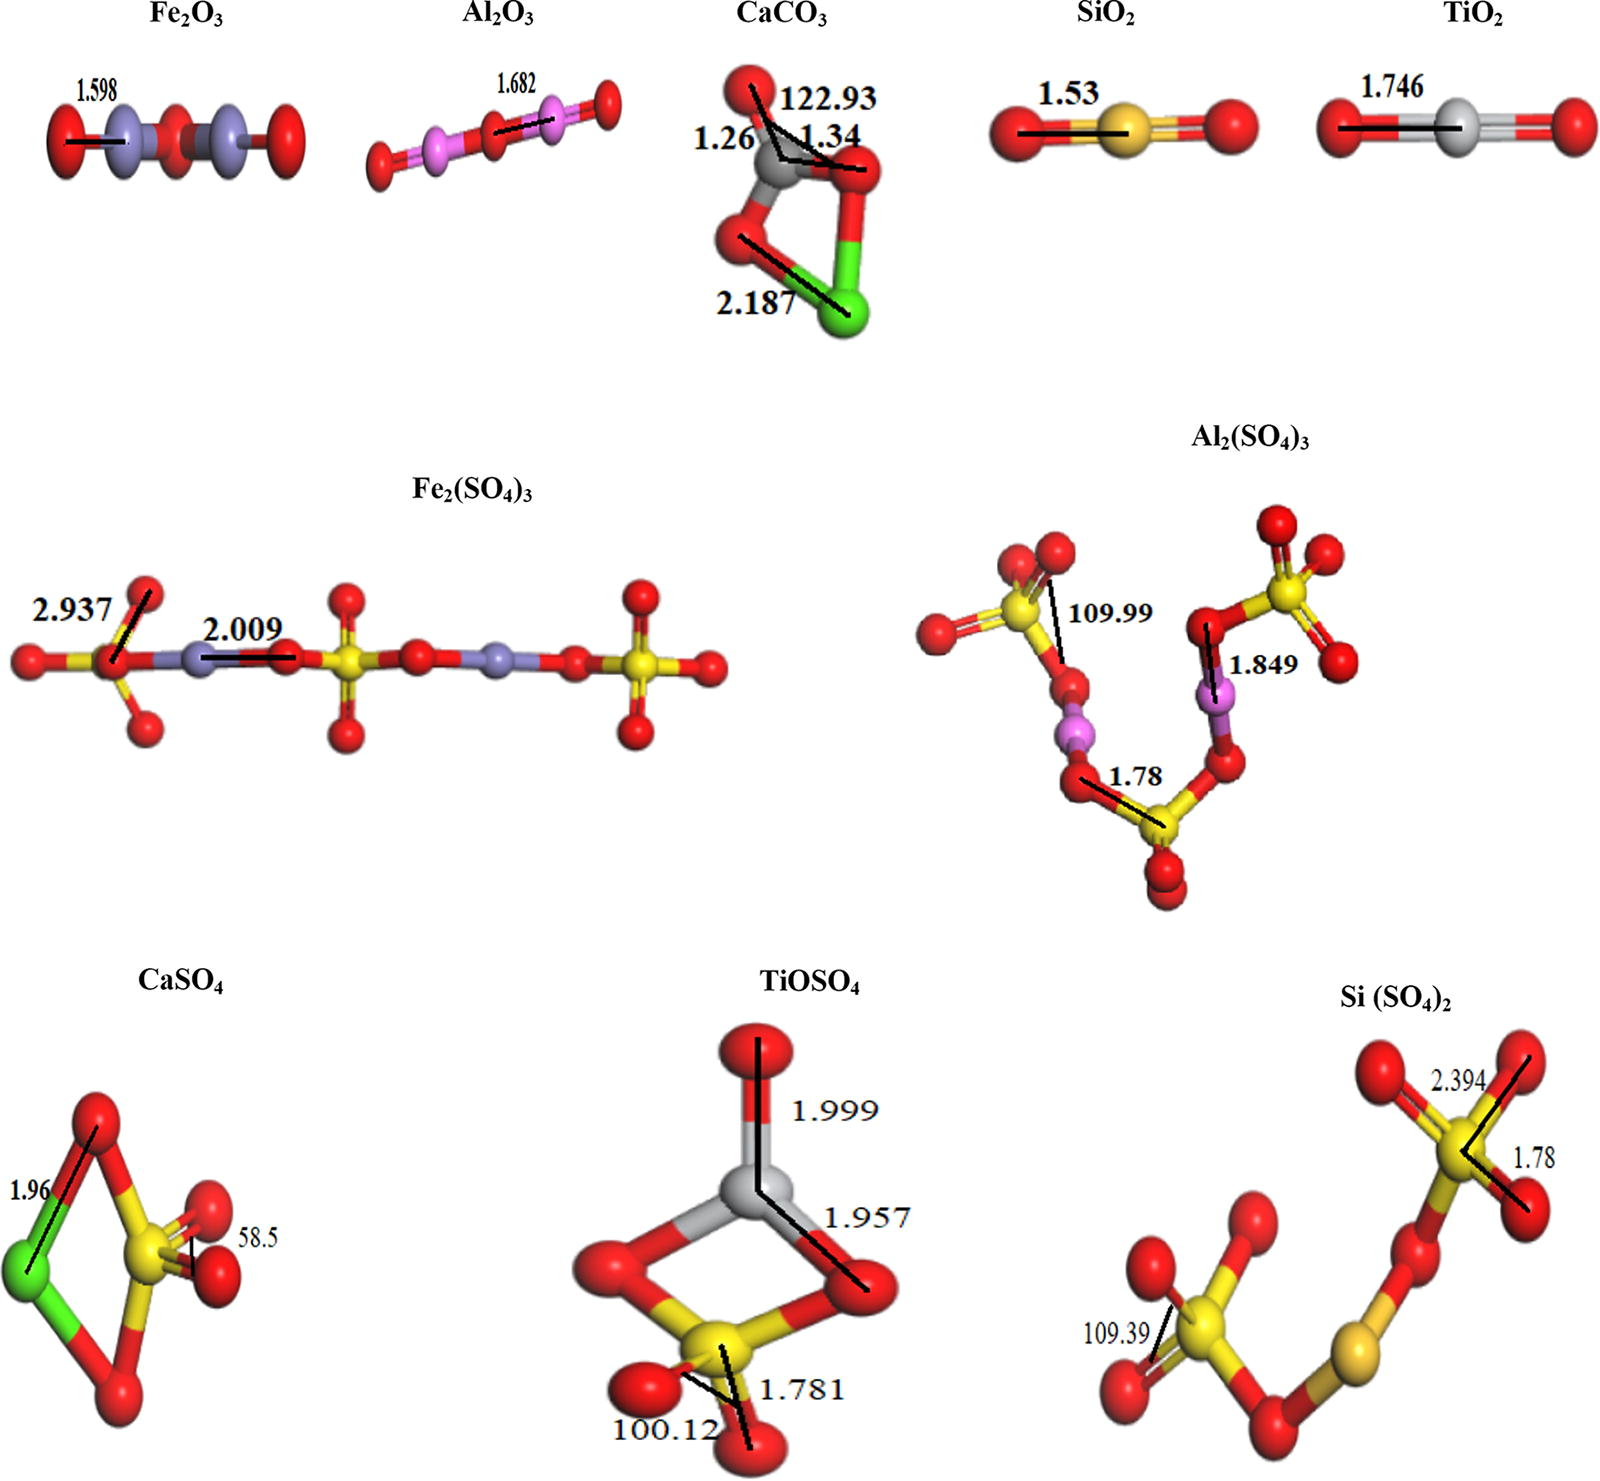
Optimized structure of clusters and their bond lengths and angles.
The results of a vibrational analysis calculation were used to compute important thermodynamic properties such as enthalpy (H), entropy (S), free energy (G), total energy (E), and heat capacity at constant pressure (Cp) as functions of temperature. DMol3 can be applied as a tool for the prediction of these thermodynamic properties of molecular systems and total energy yields. In this section, the thermodynamic properties of the main chemical composition of RM as reactants and the products that were obtained were calculated in separate documents. Table 7 indicates the calculation results of thermodynamic properties. Then, the free energy for each reaction was calculated using the Material Studio software. Figure 3 compares the results of computed free energy in molecular simulation and obtained free energy from thermodynamic measurements. Results indicate systematic conformity between the calculated free energy in molecular simulation and obtained free energy from thermodynamic measurements.

Results of simulated free energy obtained from thermodynamic measurements.
Calculated Thermodynamic Properties of Reactants and Products
In this section, the DMol3 module was used to calculate the total energy of reactions between metal oxides in RM structure and sulfate ion at T = 298.15 K. In Table 8, all ΔG of reactions between RM compounds and Na2SO4 are investigated. Results illustrate the salient difference between the total energy of reactants and products that occurs for MgO and Fe2O3. As can be observed, the obtained total energy values for the reaction of all oxides in the RM structure are regarded to be positive. The highest total energies were gained—756.2, 324.7, 273.2, and 242.3 kcal/mol for MgO, Fe2O3, Al2O3, and SiO2, respectively. These values indicate that the reaction between sulfate ions and these oxides is nonspontaneous. Hence, adsorption can be considered the main mechanism for RM removal of sulfate. In other words, the main oxides that exist in the RM structure do not have a high tendency to react with sulfate pollutants in water without energy being spent. It can also be determined to be adsorption that can be regarded as an influential mechanism in sulfate removal.
ΔG, ΔH, And ΔS of Reactions
Adsorption energy calculation
In the next step, after optimization of crystal oxide components that existed in the RM structure,
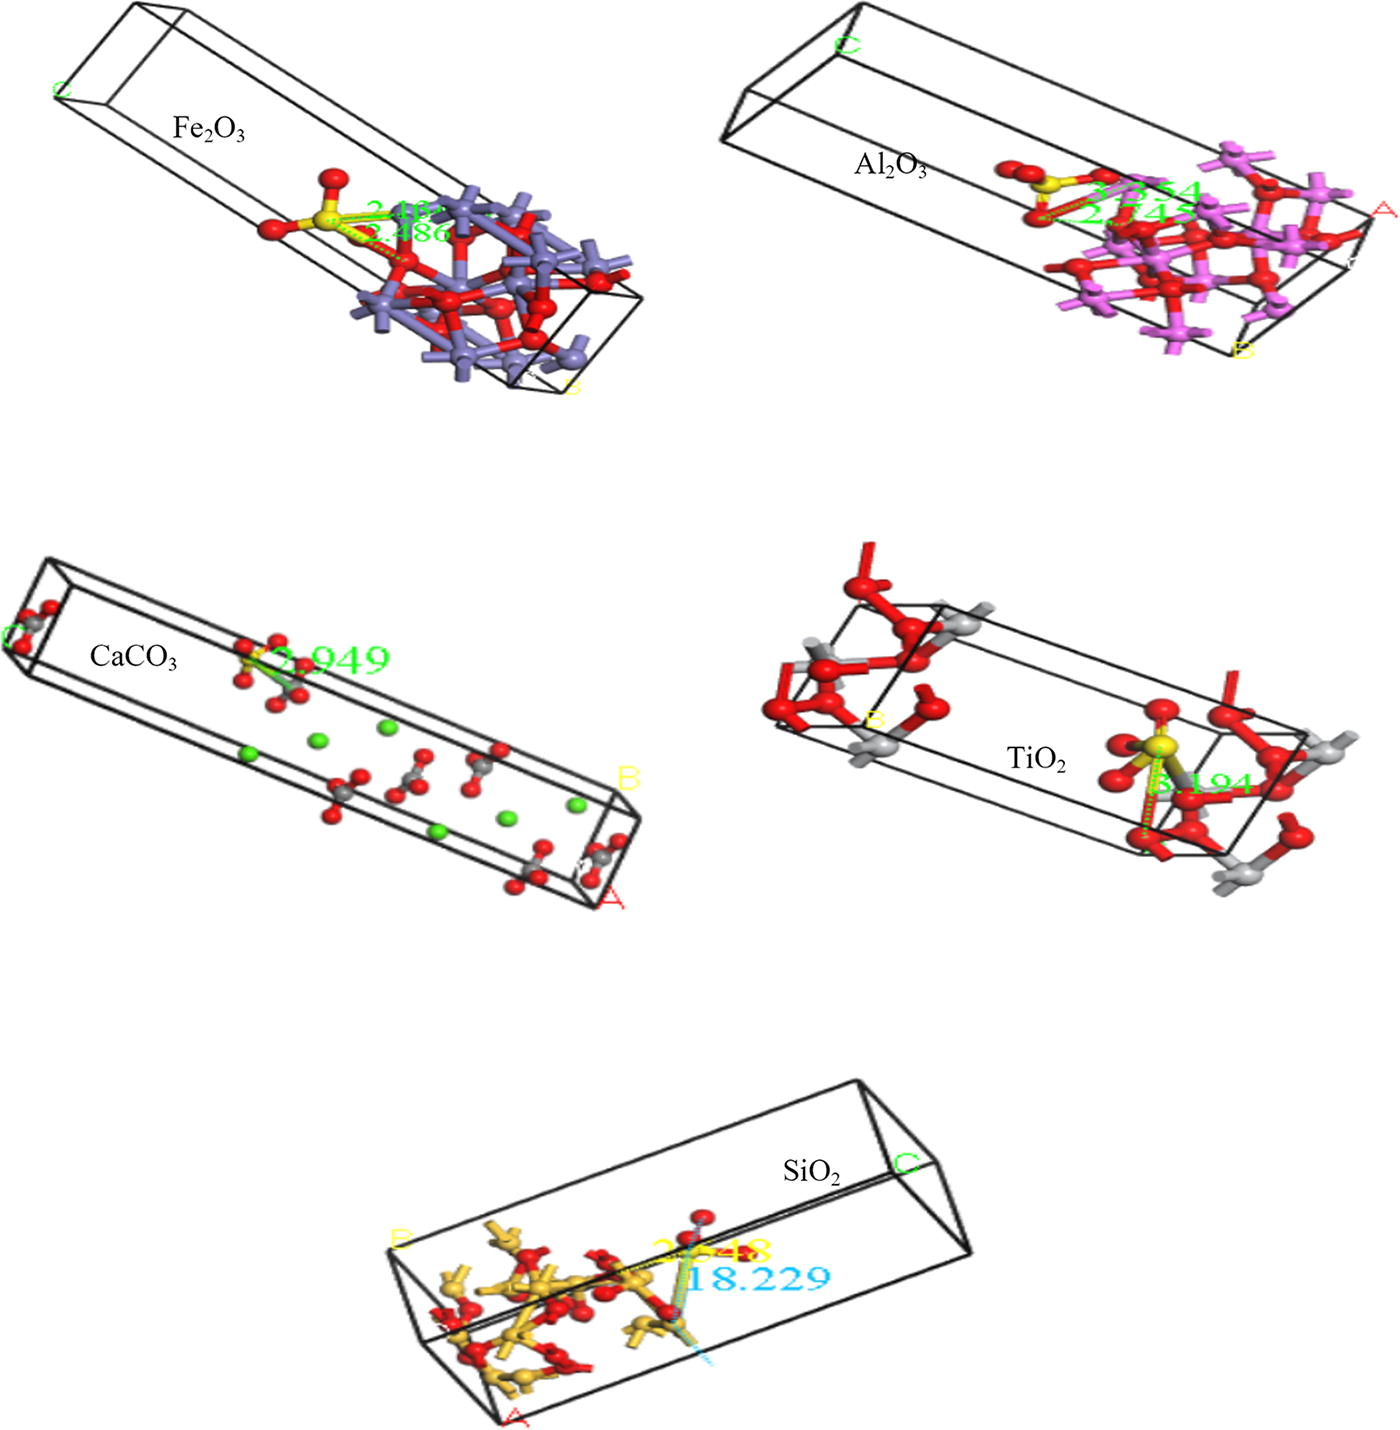
Optimized crystal components in red mud structure after sulfate ion adsorption.
The Results of Adsorption Energy in a Water Environment for Different Crystal Oxides
There are diverse treatment methods for adsorption amount improvement and surface modification of RM, such as seawater treatment, acid washing with various acids, heat activation, granular treatment with bentonite or fly ash and in presence of different surfactants. This research applied seawater treatment and hydrochloride acid washing for this aim. Calculations were performed using the continuum solvation model, namely, COSMO, to simulate these environments (seawater and acid) as solvents. All simulation steps for main crystal oxides were repeated in seawater and hydrochloride acid environments with 84 and 150 dielectric constants, respectively. The results are related to the simulation calculations for seawater and hydrochloride acid in Tables 10 and 11, respectively. These results explore that adsorption energies for all main crystal oxides in the RM structure are rising with the dielectric constant increasing. Adsorption energies of hydrochloride acid are more than that of seawater environment. The adsorption energy for RM structure in seawater and hydrochloride environments was equal to −56.69 and −85.47 kcal/mol, respectively. These results illustrate that applied modification methods could improve the adsorption properties of raw RM. Transferring an ion from the liquid crystal layer with a lower dielectric constant to the alignment layer with a higher dielectric constant is energetically favorable. So, increasing the dielectric constant in the adsorption environment increases activated sites on the surface layer of the adsorbent. An alignment layer with a higher dielectric constant helps increase ion adsorption on the alignment layer. In the case of inorganic material (metal oxides), this issue helps increase ion adsorption on the alignment layer.
The Results of Adsorption Energy in Seawater Environment for Different Crystal Oxides
The Results of Adsorption Energy in Hydrochloride Environment for Different Crystal Oxides
The experimental results
The effect of adsorbent dosage
Three adsorbents were obtained after applying modification methods and preparing adsorbents: RM, SRM, and ARM. The effect of adsorbent dosage on sulfate removal from the aqueous solution at pH = 7 is depicted in Figure 5. The sulfate removal efficiency increases due to the adsorbent dosage’s rise to enhance the adsorbent’s available surface (Mohamed et al, 2021; Pratinthong et al, 2021). As can be seen, the maximum sulfate removal was 6.3, 29.4, and 33.4% for RM, SRM, and ARM in 5 g/L adsorbent dosage. Simultaneously, adsorption capacity almost decreases with increasing adsorbent dosage, which can be due to the reduction in the number of sulfate ions in the solution, which can be compared to adsorbent sites and the maximum adsorption capacity which have been obtained 38.2, 15.4, and 3.1 mg/g in 0.5, 2, and 4 g/L adsorbent dosage for ARM, SRM, and RM, respectively. Furthermore, Figure 4 confirms that seawater and HCl washing increases sulfate adsorption onto the RM surface.
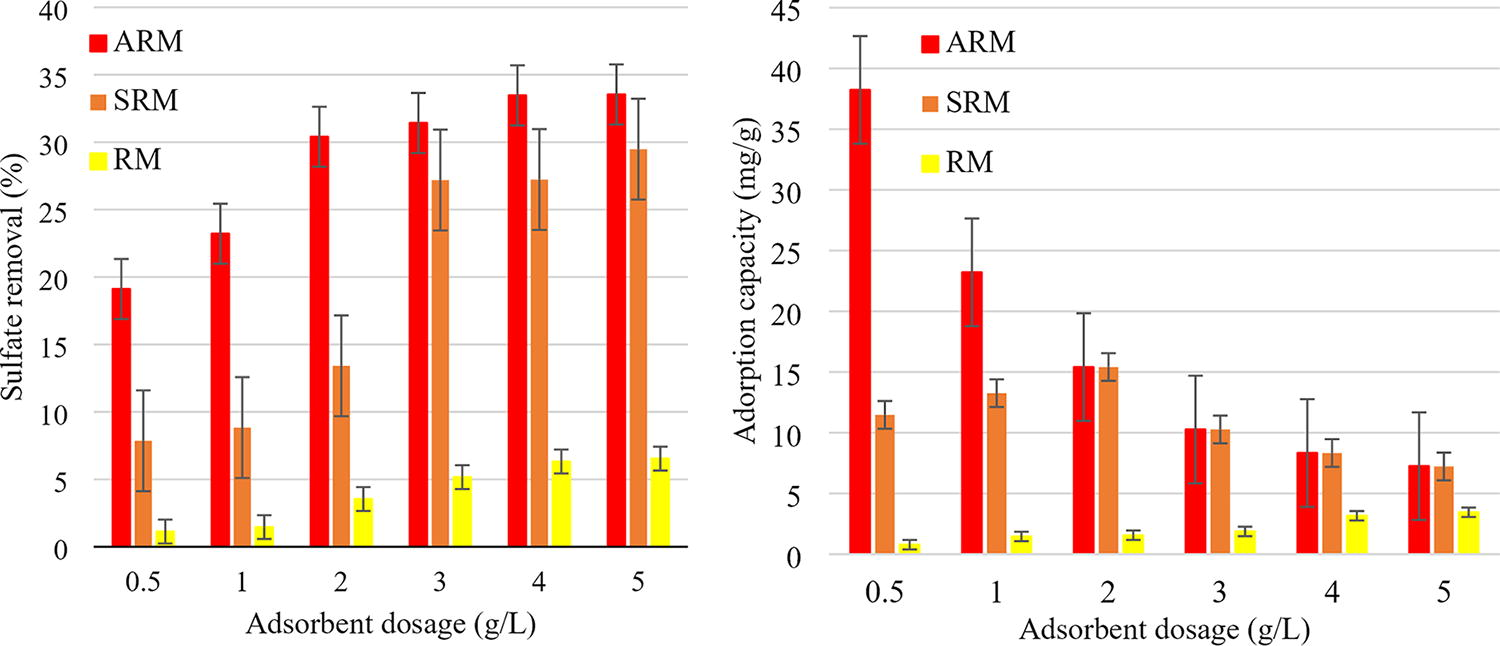
Effect of adsorbent dosage on sulfate removal and sorption capacity by RM, SRM, and ARM (contact time of 60 min, sulfate concentration of 1,000 ppm, and temperature of 27°C). SRM, seawater washing red mud; ARM, acid treatment red mud.
The effect of sulfate concentration
Figure 6 illustrates the sulfate adsorption on RM as a function of its initial concentration (250–2000 ppm) at 60 min contact time, pH = 7, and with 2 g/L of adsorbent. The results indicated that sulfate removal and adsorption capacity increased by increasing the sulfate concentration in the solution. There is no maximum point for ARM and SRM adsorption capacity, but the sulfate removal percentage reaches an equilibrium state after 1,000 ppm sulfate concentration. The maximum sulfate removal and adsorption capacity gained 40.4% and 40.4 mg/g for ARM in 2,000 ppm sulfate concentration. Similarly, sulfate removal and adsorption capacity can be increased by an escalation in the sulfate concentration in the solution, and this is due to the increase in number of available sulfate ions in the solution. Also, the results illustrate that at different sulfate concentrations, sulfate removal and adsorption capacity of ARM and SRM are more than that of raw RM. These two methods can improve the adsorption properties of RM.
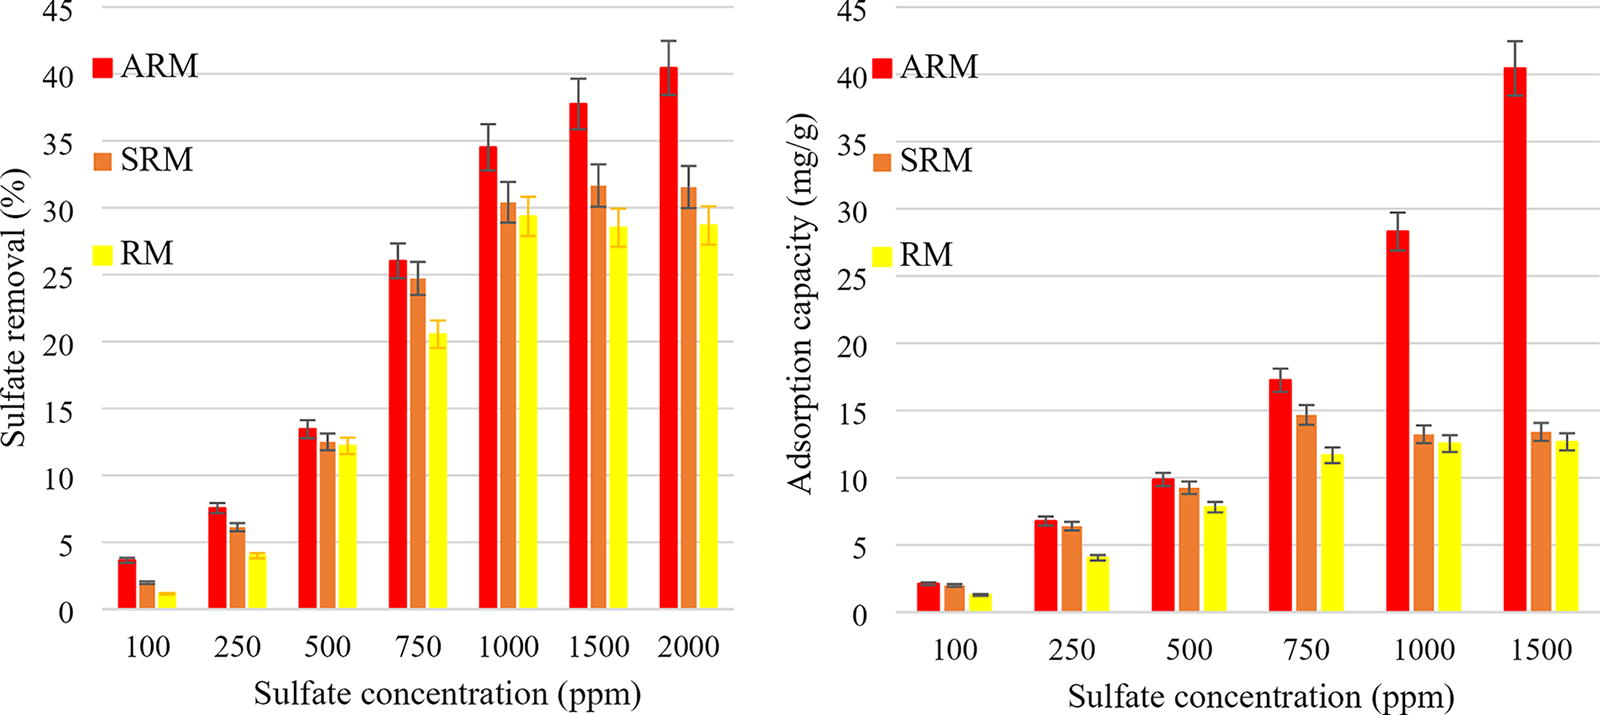
Effect of the sulfate concentration on sulfate removal and adsorption capacity by RM, SRM, and ARM (adsorbent 2 g/L, contact time of 60 min and temperature of 27°C).
Calculation of thermodynamic parameters
For the calculation of thermodynamic parameters, adsorption amounts of sulfate ion have been obtained at temperatures of 298, 303, 313, 323, and 333 K. ΔH, ΔS, and ΔG have been assessed using Equations 3 and 4 and shown in Table 12. In the case of RM, SRM, and ARM adsorbents, negative values of ΔH illustrate that the adsorption reaction is exothermic (Gaber et al, 2017). With the increase in solution temperature, enthalpy values tend toward negative values. The negative amounts of entropy for RM, SRM, and ARM indicate that the adsorption reaction moves towards more disorder. Therefore, sulfate adsorption on three kinds of adsorbent is a reversible reaction, and temperature is a vital factor.
Thermodynamic Parameters for Sulfate Adsorption onto RM, SRM and ARM
SRM, seawater washing red mud; ARM, acid treatment red mud.
The positive free energy values for RM, SRM, and ARM indicate the nonspontaneous reaction of sulfate ions with these adsorbents. With an increase in temperature, ΔG values change to negative values, showing that an increase in temperature can enhance adsorption. In addition, calculation of thermodynamic parameter shows the adsorption process of sulfate on ARM and SRM adsorbents, which can be observed to be more desirable than RM.
FTIR analysis
The FTIR spectra of RM, SRM, and ARM after sulfate adsorption are shown in Figure 7. The bands that appear at 1,410–1,470/cm for all adsorbents are related to carbonate bands. Besides, the peak at 1,431/cm and 1,625/cm for all RM samples corresponds to C–O and C–C stretching vibration that could be attributed to the existence of cancrinite or calcite in the RM (Ye et al, 2015). In addition, the bands in the 460–590 and 680/cm regions result from the stretching vibrations of the Fe–O bond that can be associated with hematite and magnetite as the main composition of RM. Additionally, the bands at around 995/cm may correspond to the Si–O–Si and Si–O–Al vibrations that could belong to alumina, Zhypsyt, and Boehmite in RM (Deihimi et al, 2018; Ye et al, 2015). The peak intensity of calcite (1,431/cm) in SRM spectra becomes sharper rather than other adsorbents and peak, which can be related to OH (3,420/cm) reduction due to the neutralized OH– ion with Mg, Al, and Ca in seawater. In the case of ARM, the CaO band 874/cm disappears due to its reaction with HCl and the dissolution of calcite and cancrinite (Deihimi et al, 2018). Moreover, Al-O and Fe-O bands (460–590 and 680/cm) in the ARM spectrum have become considerably weaker as a result of the possible dissolution of Fe and Al oxides/hydroxides (Deihimi et al, 2018; Ye et al, 2015). As can be seen, there is a sharp intensity absorption around 1,100/cm that is related to the

FTIR of RM samples after sulfate adsorption.
Scanning electron microscopy and EDX results
Scanning electron microscopic pictures related to RM, SRM, and ARM are shown in Figure 8a–c. There are particles of various sizes and amorphous or crystalline structures. Metal oxide and primitive minerals, especially iron, have crystalline structures and large sizes, and amorph minerals formed during the Bayer process, including smaller sodium and aluminum minerals. EDX results in Figure 9 illustrate the attendance of iron, calcium, titanium, and silicon as main constituent elements in RM, SRM, and ARM structures. Comparing the EDX result of RMS with RM shows increased calcium ions in SRM composition due to calcite and aragonite precipitation during seawater treatment. In the ARM sample, peaks related to iron and titanium ions are increased. Meanwhile, calcite minerals are decreased as a result of acid washing.
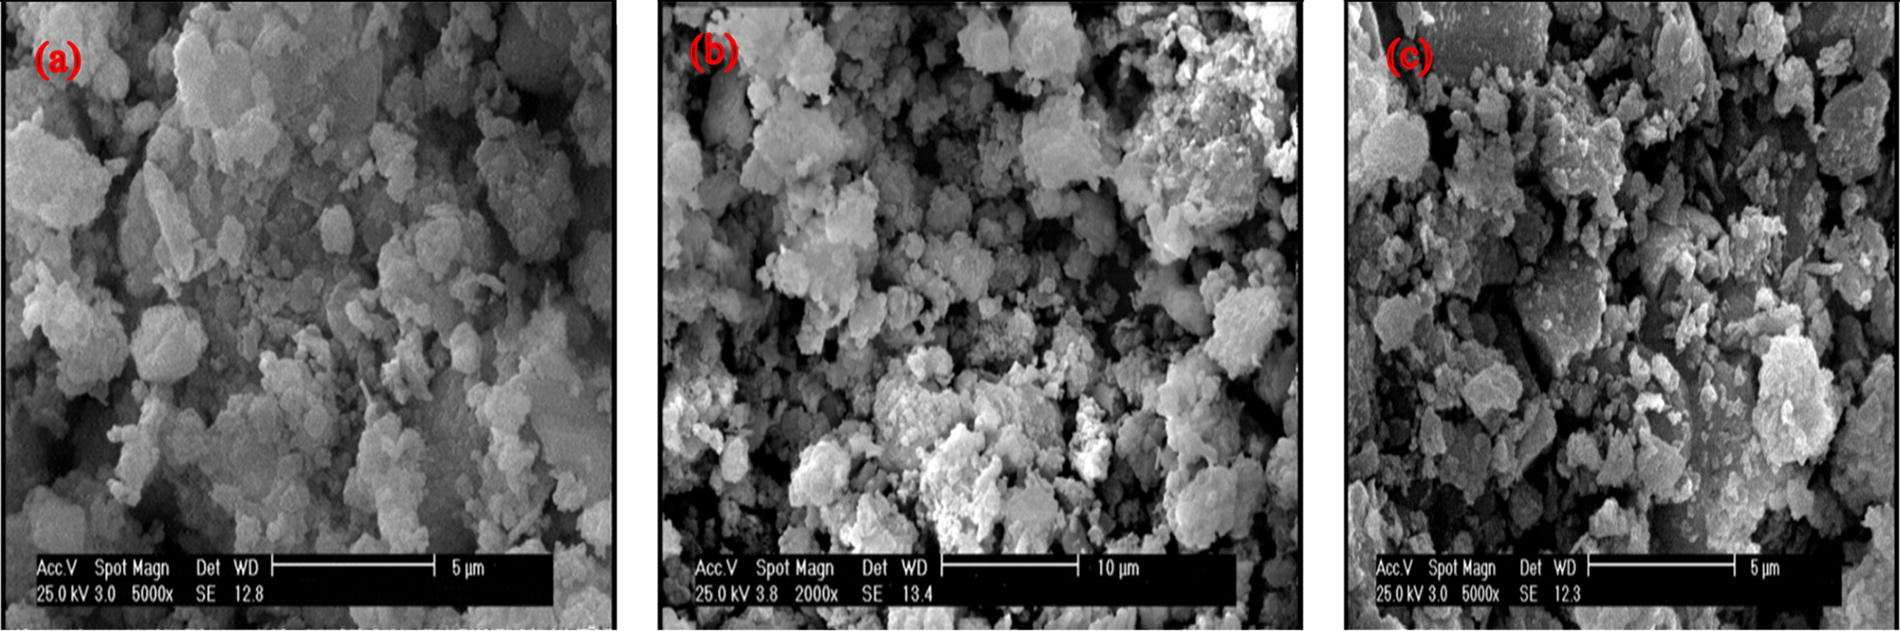
Scanning electron microscopy of RM
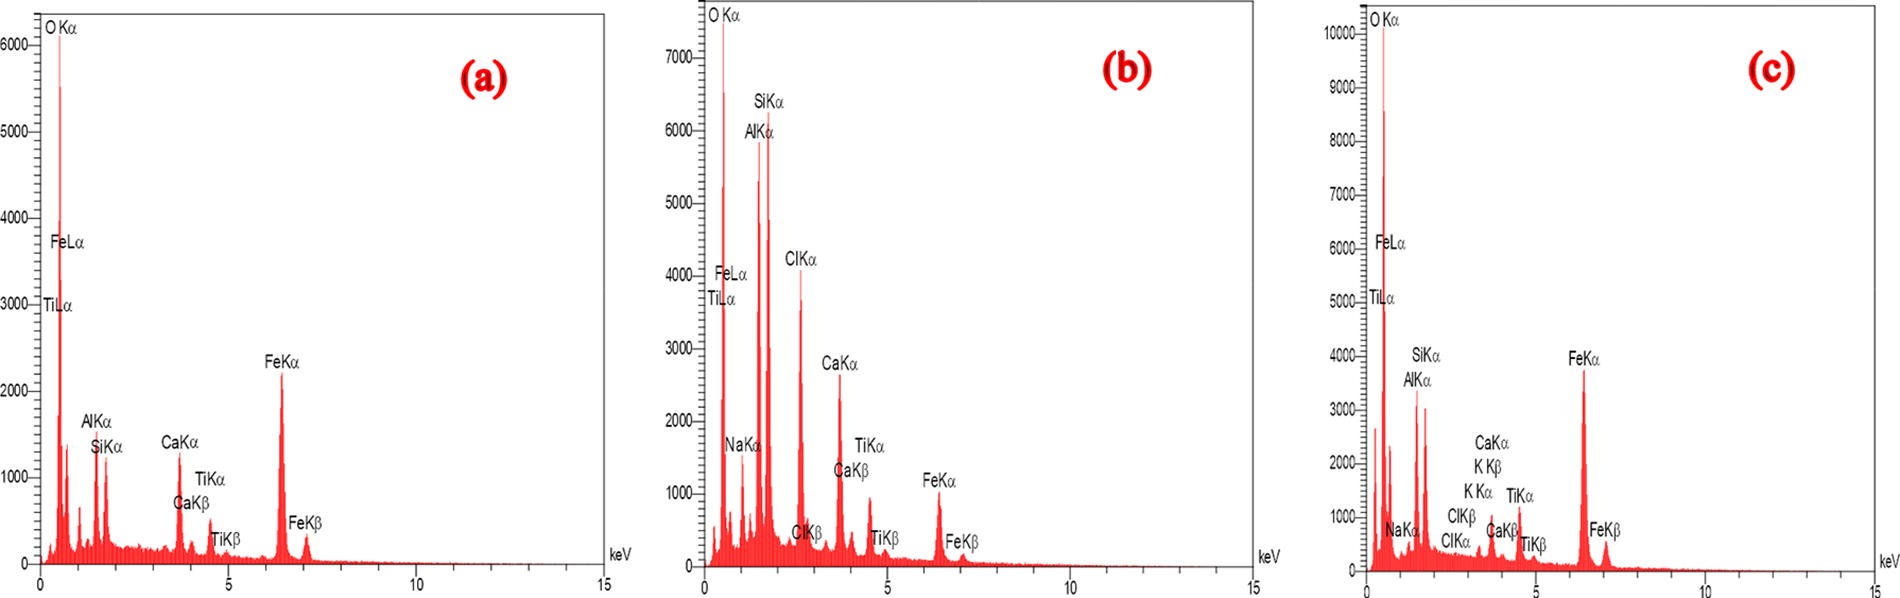
Energy-dispersive X-ray of RM
BET analyses
The specific surface area is an effective factor in the adsorption process. Furthermore, the porosity volume per adsorbent mass indicates its specific surface area. BET analyses provide a summary for the pore analysis report of samples, which includes information about specific surface area, surface area of micropores, total pore volume, micropore volume, and average pore diameter. The textural properties of RM and its modified shapes are presented in Table 13. According to the obtained results, the porosity volume of SRM is 0.0345 cm3/g, which decreased relative to raw RM (0.0686 cm3/g). The reason may be the precipitation of various salts from seawater on the SRM surface.
Textural Properties of RM and Modified RM
Porosity volume (0.184 compared to 0.0686 cm3/g) and specific surface area (126.7 compared to 28.7 m2/g) of ARM increased compared to RM. This could be due to the dissolution of some ions (such as sodium and calcium) in the HCl solution. Hence, the adsorption amount of sulfate ions increases on the ARM surface due to the increase in porosity volume and the specific surface area during acid treatment.
Discussion
RM, as an industrial waste with an alkaline pH, was used to remove sulfate and increase the pH of AMD. For the simulation of RM modification methods, the continuum solvation model, namely, COSMO, simulated water, seawater, and HCl environments as solvents. The results illustrate that with the constant increase in dielectric constants (78.54, 84, and 150 for water, seawater, and HCl, respectively), adsorption energies for all main crystal oxides existing in the RM structure are rising. Adsorption energy for HCl environment is more than that for seawater environment. These results illustrate that applied modification methods could improve the adsorption properties of raw RM. Also, the experimental tests confirmed these results and sulfate removal reached from 6.3% for RM to 29.4 and 33.4% for SRM and ARM, respectively.
It seems that the presence of Mg2+ and formation of Mg/Al layered double hydroxide phases such as the hydrotalcite (Mg6Al2(CO3)·(OH)16·4H2O) and carbonate precipitation in the seawater modification method led to surface charge change. Sulfate anions can occupy layered double hydroxide minerals containing an interlayer site to reduce their solution concentrations (Burke et al, 2013). With acid treatment, Na+ and Ca2+ ions decreased in the ARM composition (Guo et al, 2018; Deihimi et al, 2018). Besides, it was found that acid treatment increases specific surface area and total pore volume and a higher adsorption amount than the untreated RM (Somogyi et al, 2022). Additionally, acid treatment reduced organic and nonorganic impurities in RM and formed micro and macro pores on the RM surface. The acid treatment creates appropriate functional groups and increases positive charge (protonated groups) onto the RM surface for more adsorption of sulfate anions (Namasivayam and Sangeetha, 2008). In addition, HCl activation can remove impurities in the RM channel and surface adsorption and bonded water in the skeleton to dredge the internal pores of RM and decrease the adsorption resistance of water film to ions, which promotes the diffusion and adsorption of RM (Wang et al, 2019). Figure 10 shows a change in the mechanism of the adsorbent surface behavior with pH changes in the water interface. As can be seen, with pH changes under acidic conditions, the surface charge of RM tends toward positive, so the conditions for electrostatic interaction with anionic pollutants are improved.

Change of mechanism in the adsorbent surface behavior with pH at its interface water.
On the other hand, the increased pH of the solution leads to an increase in OH– ions, and the competition of these ions with various anionic pollutants decreases the absorption capacity of pollutants in alkaline pHs. Concentrated acid can remove iron and aluminum oxide groups and reduce the adsorption of sulfate ions by ARM (Li et al, 2006). After sulfate adsorption on the adsorbent surface, the FTIR spectra of RM, SRM, and ARM show a sharp intensity absorption around the related
Positive free energy for RM, SRM, and ARM, which obtained thermodynamic calculations, indicates that sulfate adsorption is nonspontaneous. With the temperature solution increase, ΔH and ΔG values increase toward more negative values, showing that temperature could increase adsorption amounts. The obtained total energy values for reactions between oxides in the RM structure are regarded to be positive, and the highest total energies were gained: 756.2, 324.7, 273.2, and 242.3 kcal/mol for MgO, Fe2O3, Al2O3, and SiO2, respectively. These values indicate that these reactions are nonspontaneous, and the main oxides that existed in the RM structure do not have a high tendency to react with sulfate pollutants in water and can also be considered adsorption as an effective mechanism in sulfate removal. Adsorption bond length measurements for crystal oxide existed in RM with the DFT method, and the DMol3 module illustrated the shortest bond lengths, which belong to Fe2O3, Al2O3, TiO2, CaCO3, and SiO2 equal to 2.134, 2.745, 2.949, 3.194, and 18.229 Å, respectively. The bond length for α-Fe2O3 as an adsorbent in the same research was obtained at 2.7–2.82 Å (Shi et al, 2022). The negative adsorption energy results demonstrated that all main crystal components in the RM structure tend to adsorb sulfate ions. Among all crystal oxides, the highest adsorption energy is that of Fe2O3, TiO2, Al2O3, CaCO3, and SiO2. The highest calculated adsorption energy for α-Fe2O3 as adsorbent obtained −83.7 kJ/mol in previous literature (Liu et al, 2014). All obtained results illustrate that RM and its modified forms can help reduce the effects of AMD pollution. Although a column composed of RM as adsorbent and AMD passing through it and with sulfate adsorption on the RM surface can reduce the alkaline pH of RM, AMD pH approaches neutral values.
Conclusions
RM can be introduced as an unexpansive adsorbent for sulfate removal from AMD due to its high metal oxide content and high pH level, increasing this drainage’s low pH. Positive free energy values for the reaction between sulfate and main oxides in RM illustrate that these reactions are nonspontaneous. Moreover, positive total energy values for these reactions obtained by the DFT method indicate that these oxides tend to react with sulfate ions and can also be regarded as adsorption, which is an effective mechanism for sulfate removal. Negative adsorption energies for main crystal components in RM structure show a great tendency toward the adsorption of sulfate. Among these crystal oxides, the highest adsorption energy was that of Fe2O3, TiO2, Al2O3, CaCO3, and SiO2. Also, seawater and HCl treatment as modification methods were used to reduce pH and increase the adsorption capacity of RM. Seawater and HCl washing increase sulfate removal from 6.3% for RM to 29.4 33.4% for SRM and ARM, respectively. The adsorption energies for RM structure in water, seawater, and HCl environments using COSMO were calculated at −35.68, −56.69, and −85.47 kcal/mol, respectively. These results illustrate that applied modification methods can improve the adsorption properties of raw RM. Although RM and its activated types do not have high adsorption capacity and sulfate removal percentages, applying new activation methods, including heating and combination with a bio-absorbent, can increase the adsorption amount and reduce destructive environmental effects of both RM and AMD. The regeneration study revealed the high reusability (>90%) and acceptable stability of RM even after five successive cycles. These findings indicate that RM use for pollutant removal from wastewater offers a green and environmentally sustainable approach.
Footnotes
Authors’ Contributions
Conceptualization: S.R. and M.I.; Data curation: S.R. and M.I.; Formal analysis: S.R. and M.I.; Funding acquisition: S.R. and M.I.; Investigation: M.I.; Methodology: S.R. and M.I.; Project administration: M.I.; Resources: S.R. and M.I.; Software: S.R., Supervision: M.I.; Validation: M.I.; Visualization: S.R. and M.I.; Writing—original draft: S.R.; Writing—review & editing: S.R. and M.I. All authors participated in the conception, formulation, acquisition, analysis, interpretation of data, drafted or revised the work, and approved the final article.
Author Disclosure Statement
All authors certify that they have no affiliations with or involvement in any organization or entity with any financial interest or nonfinancial interest in the subject matter or materials discussed in this article.
Funding Information
All authors confirm that the research leading to these results is supported by funding from Amir Kabir University of Technology, Tehran, Iran, which is primarily involved in education or research. The authors are grateful to Amir Kabir University of Technology, for providing the equipment and analysis