
Abstract
Plastic pollution from freshwater and atmospheric sources into coastal and marine environments is complex and the extent is largely unquantified. Such a gap in knowledge of marine microplastic sources, fate, and transport requires a spectrum of engineers and scientists, so that technical, social, and policy solutions can be developed. Citizen scientists are low cost and can collect an abundance of field data. Experienced scientists can complete costly but advanced analytical analyses on a smaller sample of plastics. This project engages engineering and science undergraduate students (moderate experience) in microplastic data collection and analysis to fill gaps in microplastic data for the state of Rhode Island. Methods were developed to collect and analyze local river and atmospheric data. River samples were collected from a range of urban and rural sample sites. Atmospheric samples were collected by dry deposition into a custom-designed stainless steel collector located on campus. Nile red dye was used to stain the samples, which were then visually enumerated by fluorescence using a retrofitted compound microscope. All samples contained microplastics and suspected microplastics (as identified by visual analysis). Rural freshwater samples contained fewer average pieces per liter than the more urban samples. Atmospheric deposition of microplastic fibers on the moderately urban campus site was within the ranges (fibers per square meters per day) reported in other urban locations globally. Continued data collection by the undergraduate student team in collaboration with a variety of local partners from citizen scientists to experts in the field is required to develop a robust understanding of the abundance, distribution, fate, and transport of plastics in the state of Rhode Island to mitigate inputs and impacts to the Narragansett Bay.
Introduction
Microplastics (plastics between 1 μm and 5 mm) are prevalent in the marine environment due to worldwide plastic use. Microplastics can enter the marine environment from marine activities (e.g., weathering of fishing gear, shipping) or from terrestrial point sources (e.g., wastewater discharges) and nonpoint sources (e.g., stormwater runoff). In addition, atmospheric deposition can be a significant input to marine plastics, with deposition estimates into the marine environment ranging from 0.013 to 25 million metric tons per year (Allen et al., 2022). Management of these pollution sources is essential, since research has shown effects of plastic on marine biota and human health from consuming seafood (Gündogdu et al., 2023). However, the majority of microplastic research has focused on quantifying microplastics in the marine environment (biota, sediments, water column) and not on quantifying the loading to the marine environment from the terrestrial or atmospheric sources (Rezende and Moretti, 2023).
A better understanding of the spatial and temporal distributions of microplastics from the nonmarine sources is required to develop source management strategies. Globally, methods for collecting and characterizing microplastics need to be standardized, but they also need to be effective, feasible, and economical. On a local scale, an “all hands-on deck” approach will help collect microplastic data with enough breadth and depth to understand the local dynamics of microplastics and the contributions to the local marine environment. This presents many collaboration opportunities between the public, local universities, state agencies, and regional experts. Citizen scientists are low cost and can collect an abundance of field data, both spatially and temporally. Experienced scientists (e.g., PhD students, university faculty, state/industry professionals) can complete costly, but advanced analytical analyses on a smaller sample of plastics to help understand aspects like plastic types or fate and transport in the local environment. Undergraduate engineering and science students, with moderate experience (in training), can complete sampling and analysis of microplastics in a moderately robust way through research projects or course-based experiences at a relatively low cost (Forakis et al., 2024).
Microplastic pollution is a growing pollution concern for the state of Rhode Island (RI), the location of this study, especially given the high urban land cover (approximately 40%), population density (1006 people/mi2), and importance of the surrounding marine environment to the local economy. The most information known is about concentrations of microplastics in the sediments of the Narragansett Bay. A study by Cashman et al. (2023) found a range of 40 particles/100 g of sediment to 4.6 million particles/100 g sediment (wet weight) in soil samples from the bay. Measurements of the shoreline and seabed sediments contained a range of 396 to over 13,000 particles/kg of dry sediment (Fulfer and Walsh, 2023). Authors estimate that >16 trillion pieces of plastic, weighing nearly 1,000 tonnes, are stored in the surface sediments of the Narragansett Bay, with higher concentrations in the upper more urban reaches (Fulfer and Walsh, 2023). Other regional studies have focused on concentrations in native species of coral or in estuarine benthic organisms (Giroux et al., 2023; Rotjan et al., 2019).
Potential urban sources of microplastics in the bay include stormwater, wastewater treatment plants (WWTPs), industry discharges, and atmospheric deposition. Knowledge of the extent of microplastic pollution in rivers and streams is important, as microplastics are transported through inland river systems to the bay. Currently, there are no freshwater microplastic concentrations published for RI. Microplastic concentrations in rivers from studies around the globe are variable. Kukkola et al. (2023) measured microplastics at 16 sites in Boulder and South Boulder, CO, and the average pieces per liter ranged between 0.02 and 0.62 for rivers, with flows that ranged from 63 to 2,485 L/s (2.2–87.8 cfs). Storm events can increase concentrations of microplastics over four times their prestorm concentrations (Hitchcock, 2020). The mean river concentration globally based on 196 different studies from around the world was 0.63 pieces/L (Koutnik et al., 2021). Atmospheric deposition of microplastics is a growing area of interest, especially in urban areas; however, there are very limited atmospheric data globally and none in New England. Urban atmospheric studies in European cities report microplastic fiber fluxes between 2 and 925 fibers/m2-day, which is much lower compared to more rural fluxes ranging between 1 and 29 fibers/m2-day documented in Whitehorse, Canada (Dris et al., 2016; Postma, 2022; Wright et al., 2020).
This ongoing project engages undergraduate engineering and science students in local microplastic data collection and analysis with methods that are moderately rigorous, cost-effective, and scalable to other institutions. Consistent long-term sampling by students in the region, in conjunction with data from other local scientists and engineers, can contribute to a better understanding of the local sources of marine plastic pollution. Local involvement by students may inspire social change (e.g., cutting plastic consumption), and together with long-term data can result in policy changes and technical solutions to controlling and cleaning up plastic pollution. This article describes the methods used for river and atmospheric deposition sampling with undergraduate students and early efforts made to develop the basis for a long-term database of microplastic data, which will help to assess the inputs of microplastics to the Narragansett Bay, located off the RI coast.
Methods
In this study, microplastics were collected from freshwater and atmospheric sources. A method was developed for undergraduate students to visually analyze the samples, stained with Nile red dye, under a compound microscope retrofitted for fluorescence under blue light. An overview of the methods can be found in Figure 1 with details subsequently discussed.

Overview of freshwater and atmospheric methods for sampling and analysis of microplastics.
Freshwater locations and sampling
Twenty potential sample sites in the Narragansett Bay watersheds were identified based on their sampling accessibility, extent of urban/rural landcover, and their location relative to wastewater treatment plants, existing sample sites for local agencies, and proximity to a United States Geological Survey (USGS) streamgage. For this study, sampling was conducted on a subset of three of the potential sample sites on two major RI rivers that flow into the Narragansett Bay (Fig. 2). Two sample sites were on the Woonasquatucket River, and one sample site was on the Pawtuxet River (Table 1). The urban Atwells Avenue Bridge (AAB) site on the Woonasquatucket River is located in the capital city Providence and situated approximately 6 miles downstream of the Smithfield, RI, WWTP. The more rural Esmond Conservation Area (ECA) site is 0.5 mile upstream of the Smithfield WWTP, and about 500 ft upstream of USGS gauge 01114500. The urban Broad Street Bridge (BSB) site on the Pawtuxet River is downstream of three WWTPs and USGS gauge 01116500. The Pawtuxet watershed drains approximately 20% of the state land. Future work will involve sampling additional sites from the larger potential list of sites.

Map of Rhode Island, including sample locations, USGS gages, and WWTPs along the rivers. WWTP, wastewater treatment plants.
Freshwater Sample Site Locations and Characteristics (USGS StreamStats, https://streamstats.usgs.gov/)
Current weather conditions and the flow from the closest USGS stream gauge were recorded during sampling. River velocity at the sample location was measured using a Marsh-McBirney portable velocity meter (Flow-Mate 2000). A phytoplankton net was attached to a cod end piece (0.3 mm) and then securely attached to a 10 m lead line by a carabiner. If the water was only accessible by bridge, the assembly was lowered from the downstream end of the bridge to just below the waterline at the deepest cross-section location. If the water was safely wadable and accessible, the assembly was manually held in the water with the open end facing upstream and the sampler directly downstream, so as not to interfere with the data collection.
After 5 min, the assembly was taken out of the water and the contents were sifted through a 5 mm and then 0.3 mm sieve. Any organic piece larger than 5 mm (e.g., sticks) were removed by tweezers, rinsed over the sieves, and discarded. Suspected plastic pieces larger than 5 mm were documented as potential macroplastic and collected. The contents on the 0.3 mm sieve were then rinsed with deionized (DI) water into a glass sample jar, placed in a cooler, and brought back to the laboratory and stored at 4°C until further analysis. After rinsing, the sieve was visually inspected to ensure no fiber were remaining.
Three river samples and one blank were collected at each location. The rivers were sampled on 2 days (June 14, 2023, and June 18, 2023) with comparable weather and hydrological conditions. After the river samples were collected, a glass sample jar was filled with DI water of a comparable volume to the samples to be brought back to the laboratory and analyzed the same way as the sample water.
Atmospheric locations and sampling
The atmospheric sampler was located on the campus of Roger Williams University, in Bristol, RI. This was chosen mainly out of convenience to the researchers since permission was required to install the collector into the ground. The location is also significant because it is adjacent to the Narragansett Bay, and so it was assumed that atmospheric microplastic loading at this site would be similar to the loading onto the bay.
The atmospheric sampler was designed by students based on a drafted ISO standard for particulate fallout collection and manufactured off site. The device includes a stainless steel canister (7.2” × 7.2” × 10.7”) and lid. The canister sits in a basket on a wooden stand approximately 56” tall, which slides on and off a PVC pipe installed into the ground at the sample site (Fig. 3). The stand is approximately 1–2 tree heights from the nearest structure or tree.

Atmospheric collector and stand at the sample location.
The canister was used for microplastic deposition collection during 2 days of dry weather (starting on June 7, 2023, July 11, 2023, and November 15, 2023). Once placed on the stand, the cannister lid was removed, signaling the start of collection. After 2 days, a clean lid was placed on the canister, and it was transported to the laboratory. The time of the lid replacement was recorded as the collection stop time.
Laboratory procedures
Freshwater samples were digested to remove organic matter using 1M KOH at 40°C for 24 h. After 24 h, the sample was vacuum filtered over 1.6 μm glass fiber filter paper (Whatman GF/A). Atmospheric samples were not digested since organic matter was low. Instead, the canister was uncapped and then the walls of the canister were rinsed with DI water. The water in the canister was then emptied and carefully rinsed into the vacuum filter apparatus and filtered through the filter paper.
After filtering, 2–3 drops of an acetone- and n-hexane-based mixture (10 mg/L) of Nile red were deposited onto the filters. The filter was covered and untouched for 30 min, after which additional DI was applied to the filter and vacuumed to remove unbound dye (Prata et al., 2021; Shruti et al., 2022). Filters were removed by tweezers and placed individually into glass petri dishes, labeled, and stored in the dark at room temperature until further analysis.
Analysis
Samples were visually analyzed under a compound microscope (Swift M17) with an integrated Wi-Fi tablet camera. The sample was placed on the microscope stand in a custom-designed 3D printed orange holster to hold the petri dish in place. The microscope was retrofitted to observe the samples under both white light and blue light to observe fluorescence of microplastics (Labbe et al., 2020). The samples were viewed under 40× magnification and analyzed by scanning the sample, sweeping horizontally across the top edge to the next top edge and moving down to the next row. Most of the plastic particles will fluoresce under the blue light, and so first a sweep was done under the blue light (Fig. 4). If a particle fluoresced, the white light was turned on to confirm that the particle did not resemble organic material. If a particle had questionable characteristics, an image was saved to discuss and classify with faculty help. A second sweep of the sample in the same manner was done using just the white light to identify the nonfluorescing fibers.

Comparison of a microplastic fragment with and without the blue light fluorescence.
Data recorded during sample analysis included a count of total plastics on a filter per classification category (fragment, fiber, bead, foam, and pellet). Visual classifications (Table 2) were made based on descriptions of characteristics found in literature (Dris et al., 2016; Prata et al., 2020, 2021; Yang et al., 2015). During analysis, orange fibers and potential plastic pieces <0.3 mm were noted as potential contamination. Only particles with high fluorescence and well-defined edges under the blue light were considered possible microplastics (Prata et al., 2021). Particles with fainter fluorescing were further examined under the white light to determine classification. Unremoved organic debris could sometimes fluoresce, but not as brightly and typically with a more undefined shape. Care was taken under the white light of the microscope to identify fibers since Nile red dye is not as effective at staining polyester fibers as it is with other plastics found in the environment such as polypropylene, polyethylene, and polystyrene. In general, smooth fiber surfaces were classified as plastic, while rough irregular fibers were classified as natural origin (Prata et al., 2020).
Summary of Plastic Classification and Characteristics for Visual Analysis
Freshwater sample counts were converted to concentrations (pieces per liter) based on the total flow-through volume during the 5-min test. Flow-through volume was estimated based on river velocity measured in the field (L/min), surface area of the sampler (ft2), and total time (min). For air samples, total counts per filter were converted to a flux (pieces/ft2-day) based on the atmospheric collector surface area (ft2) and total collection time (days).
Process controls were in place to minimize contamination during analyses. All equipment, to the extent possible, was nonplastic (glass and metal). Orange cotton lab coats were worn for sampling and analysis, as plastic orange fibers are rarely found in samples. Unfiltered DI water was available and used for sampling and analysis to rinse equipment. Since unfiltered DI water has been shown to contain microplastics, although fewer than tap water, DI water blanks were also analyzed during sampling/processing to ensure low risk of contamination (Kosuth et al., 2023). Before sample events, all equipment, tools, and glassware were washed several times, rinsed with DI water, and sealed in aluminum foil until use. Equipment and tools not in use were covered in aluminum foil. During freshwater sampling, DI water was used to rinse the sampler and sieves. During analysis, the stir bars, glass funnels, and beakers were rinsed with DI water carefully to prevent as much plastic loss as possible. An orange rope was used to deploy the freshwater sampler. Three samples and a blank were collected during freshwater sampling. Only one sample and a blank were collected during atmospheric sampling since there was only one canister. Samples were processed under a laminar flow fume hood and microscopic enumeration was done in a 200 ft2 project room space only accessible to two students working on the research.
Undergraduate student training
Involving undergraduate researchers in this work was an important aspect of this project. Students were active participants in the methods research, development testing, and documentation. Students were also the primary collectors and analyzers of samples, under the supervision of the faculty mentor. Several protocols were put into place to maintain consistency in data collection/analysis throughout the project years, as well as decrease the effort required to train new students on methods/protocols.
The project methods were documented in several different formats by the students and the faculty mentor. The full details of materials and procedures were documented in a standard operating procedure (SOP). Students also created short, narrated videos describing the different sampling and analysis steps described in the SOP. Both the SOP and the videos were accessible to the students on a shared research drive. In addition, the students created a poster describing microplastic types, example images of microplastics, and commonly misidentified microplastics from both literature and experience. The poster was easily accessible to students during analysis. Any pieces in question were documented, and the images were discussed with the faculty mentor and team.
Once the procedures were developed, the experienced research students assisted with training new research students. Twelve undergraduate research students, ranging from first-year students to seniors, participated in the project, and the teams comprised 2–5 students, with partial turnover per academic year and summer session. The diversity of years, research experience, and disciplines helped foster an environment of interteam training and learning. Juniors and seniors on the project assumed leadership roles and taught the new students the methods. First-year and sophomore students spent their first semester on the project learning the technicalities of the methods while also gaining valuable research skills and mentoring from the upper-class students. Student majors on the project have included environmental engineering, environmental science, chemistry, mechanical engineering, and electrical engineering.
Results
Atmospheric fluxes were determined from each of the sample events. The average fluxes for the June, July, and November sample events were approximately 25, 55, and 128 pieces/ft2-d, respectively. The corresponding average wind speeds during the 2-day sample periods were 9, 6, and 4.5 mph, respectively. The overall average flux was 69 pieces/ft2-d. Of the total counts, 98% on average were identified as fibers, with the remaining portion fragments (Fig. 5). There were no beads, foams, or pellets identified. The fibers did not fluoresce and were therefore identified under white light.
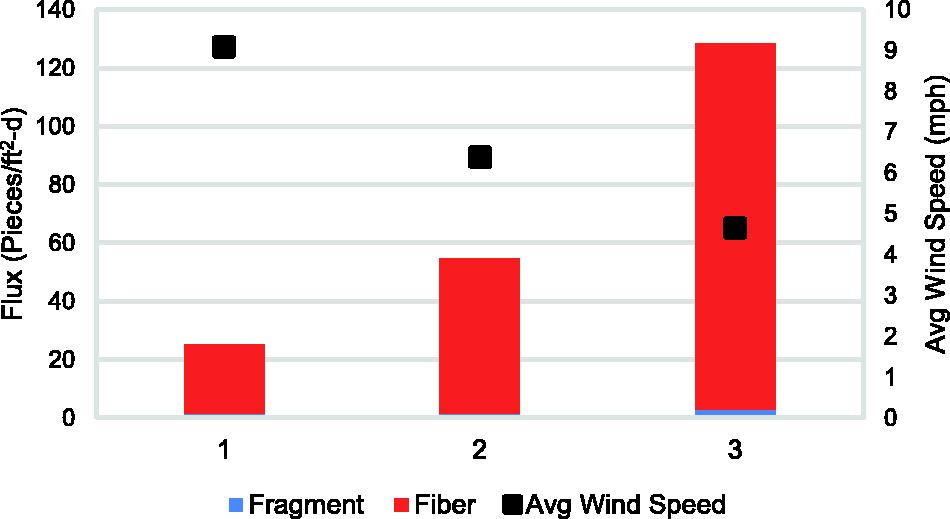
Average atmospheric fluxes and wind speed in Bristol, RI, during sample events.
The samples, especially the ones collected in June, contained many black particles. Over 1,000 black particles were estimated for the June sample, collected during the height of the local effects of the Canadian wildfires (March–November 2023). During the first week of June 2023, there was heavy haze and smog in the RI area with poor visibility. By June 11, much of the visible haze had cleared, but the sample from June had many more black particles than the other samples, and it was assumed that these were a result of the wildfires at the time and were not plastic, especially since they did not fluoresce.
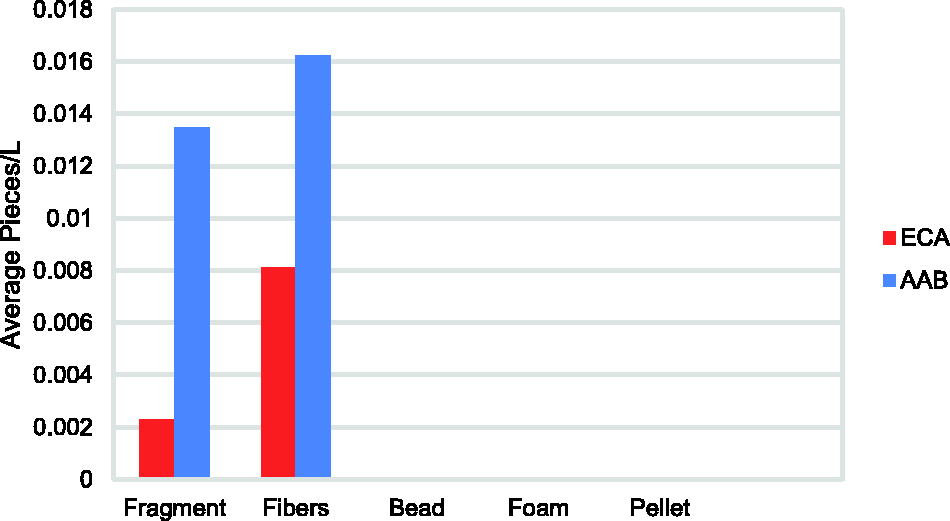
Average sample concentrations were calculated for the freshwater river locations based on three samples collected on the same day, river location, and depth (Table 3). The two sample locations on the Woonasquatucket River showed different average concentrations, with greater concentrations in the downstream, more urban, location (Fig. 6). The AAB sample site had approximately twice as many pieces per liter as the ECA sample location upstream (Table 3). The AAB concentration was 0.03 ± 0.021 pieces/L (mean ± standard deviation) and the ECA concentration was 0.015 ± 0.008 pieces/L. At both locations, only fragments and fibers were visually identified. On average, AAB and ECA samples contained 55% and 65% fibers, respectively. The USGS Woonasquatucket gauge (01114500) daily average flow rates for the June sample dates were 34.7 and 22.3 cfs, respectively, which are both much lower than the 25th percentile for the river. The 25th percentile, median, and 75th percentile flows at the Woonasquatucket gauge based on 81 years of historic flow data are 66, 98, and 124 cfs, respectively.
Average pieces per liter at the upstream Esmond Conservation Area (ECA) and downstream Atwells Ave Bridge (AAB) freshwater sample locations on the Woonasquatucket River, RI.
Freshwater Sample Data
The average daily flow at USGS Pawtuxet River gauge (01116500) during the BSB sample (July 19, 2023) was 987 cfs, which was much greater than the 75th percentile flow. The area had received almost 2 inches of rain in the days prior. Only one sample was collected before the current tore the sampler from the sample line and carried it downstream. Therefore, due to the lack of replicates, data from this location are not reported, but the location will be sampled again during future lower flow conditions.
Discussion
All freshwater and atmospheric samples from the study region contained microplastics, as identified by visual analysis. Any piece exhibiting visual characteristics of plastic under the microscope was counted as microplastic. Atmospheric fluxes of microplastics increased during sample periods with lower wind speeds. Freshwater samples along the same river indicated greater concentrations of microplastics in more urban locations downstream of WWTPs.
The methods are appropriate for providing estimates of relative abundances of microplastics across different sample locations and under varying conditions, such as river flows and wind speeds. The procedures are relatively simple, quick, and affordable. Undergraduate students, once trained in the procedure and quality controls, can independently sample for and analyze microplastics in freshwater and atmospheric mediums. The analysis takes less than 2 days if multiple samples are processed at once (approximately 24 h to digest and filter plus approximately 30 min per filter to visually analyze). The method is also relatively inexpensive to start up from scratch, requiring approximately 5,000–10,000 USD for all equipment and consumables. The method shows potential for scaling up to collect and analyze data over a range of sample locations within the radius of a university campus. In addition, the methods developed can be conducted by engineering and science undergraduate students trained in the sampling and analysis techniques.
This method, however, does have some limitations, and is best applied when the study objective is to understand the scale of local microplastic pollution and the effects of environmental conditions on microplastic concentrations. Microplastics can be miscounted (both over and underestimated) on the sample filters due to technical limitations of the sampling, analysis, staining, and mischaracterizations. For example, microplastics can be found in unfiltered DI water, resulting in overestimation of plastic concentrations (Kosuth et al., 2023). During sampling, DI water was used to rinse the sampler and sieves. Fibers could slip through the mesh during sampling or could be carried over from sample to sample if the mesh sampler was not inspected carefully after rinsing, leading to an underestimation of fibers. During analysis, the stir bars, glass funnels, and beakers were rinsed with DI water to prevent as much plastic loss as possible.
Microplastic colors were not recorded because the Nile red sometimes discolored the plastics. Nile red is unable to stain a few colored polymers, including black polyester, blue acrylic, or red polyamide fibers (Stanton et al., 2019). The atmospheric samples contained mostly fibers, which did not fluoresce, making it difficult to determine whether fibers were plastic or a natural (e.g., cotton). Fiber counts were likely overestimated, as most fibers found on the filters were assumed plastic. When atmospheric deposition fibers in more rural studies were subjected to a hot needle test, approximately 35% of the total fibers were estimated to be plastic (Postma, 2022).
Black microplastics may be underestimated in the samples from this study. Atmospheric samples, in particular, contained many black particles, especially the samples taken during the peak of the 2023 Canadian wildfires. Dark or black particles do not always fluoresce and they stain poorly. The atmospheric sampler is approximately 300 ft from a two-lane road (buffered by >200 ft of trees) and black fragments may be tire wear deposition. Although tire wear particles do not typically stain with Nile red, the sides of the particles may fluoresce as the stain will adhere to some chemical additives of tire rubber (Yoo et al., 2023). The sides of the particle may fluoresce in some cases, but not the surface. It was assumed that the black particles in the atmospheric samples were not plastic and they were not counted, because it was too difficult to distinguish between particles from the wildfires, tire and road wear, and other black particles.
Finally, this method requires care to minimize miscounts by human error and to maintain consistency among different student analyzers. High turnover of students is a challenge when working on undergraduate research projects in comparison to projects with graduate students or professionals. The counts were much more consistent between students and samples when students were properly trained to do the visual analyses and had access to visual references of what to count. For comparison, the counts by the inexperienced student with no visual reference ranged from 1.2 to 17 times higher in both samples and blanks than the trained student with the visual aids. In the atmospheric samples, 98% of the suspected microplastics were fibers when counted by the experienced and trained students. When the inexperienced student counted the sample, fibers accounted for 13%, with the remaining pieces almost entirely black fragments. Only counts done by trained students were included in the study and average results are reported. Visual guides, videos, and written procedures are helpful for both training undergraduate students year to year and keeping counts more consistent between samples and student research assistants.
Conclusions
In this study, a relatively simple method was developed for undergraduate science and engineering students to sample and analyze microplastic pollution in freshwater and atmospheric sources. Samples were collected from local rivers, and the results thus far indicate that higher microplastic concentrations were found in more urban locations downstream of wastewater treatment. Results of atmospheric sampling indicated an increasing deposition of microplastics with lower wind speeds. All samples contained greater portions of fibers than other microplastic types. To the authors’ knowledge, this is the first atmospheric microplastic data collected on the east coast of the United States. Data collection will continue in future years with a goal of estimating annual microplastic loading from major rivers and the atmosphere to the bay.
The following are recommendations for quality undergraduate microplastic research. First, methods should be developed with the skill levels of the students in mind, as well as the equipment that is accessible. The method should be simple yet defendable when large amounts of data are collected, as is suggested by this method. Second, strategies should be employed to manage consistent data quality and process control. Consider, for example, collecting reference data that students can use as a key to identify plastics and nonplastics. If accessible, also consider collecting an extra sample at each location to use exclusively for chemical analysis such as Fourier Transform Infrared Spectroscopy (FTIR) or Raman Spectroscopy. Large pieces can also be removed for further chemical analysis to identify types of plastic or distinguish between questionable pieces. A costain with Nile red may also be useful for helping to minimize the mischaracterizations of particles by visual analysis. Creating diverse student teams in terms of experience and disciplines promotes interteam training. Senior students experienced with data collection and analysis methods can be excellent mentors to first- and second-year students throughout a semester, passing on their technical knowledge and research etiquette to new students. Diversity in student disciplines is helpful during project start-up (e.g., design and fabrication of the atmospheric collector) and during training (e.g., laboratory work). Including a variety of disciplines demonstrates to students that many engineering and science disciplines are required to work in concert to understand the microplastic problem and develop solutions.
Plastic pollution from freshwater and atmospheric sources into coastal and marine environments is complex and the extent is largely unquantified. Universities situated along the coasts are uniquely positioned to help contribute to the collection and analysis of microplastic data. Given the density of universities along the coast (e.g., the northeast coast), sampling could potentially span a wide region. With simple and consistent sampling and analysis methods, undergraduate students can collect and analyze data to help understand the local spatial and temporal trends in microplastics along the coastline. This kind of power in numbers and spatial/temporal coverage may not be accessible to state or other agencies who are interested in this kind of data. Therefore, common simple methods and collaboration with regional partners (universities, stakeholders, and state agencies) in this work will be key in the future when building regional knowledge of coastal microplastic pollution.
The subject of microplastics intersects with many different science and engineering disciplines and is a subject that most students already have an interest in learning more about. The subject is an excellent way to engage students in a global environmental research question, and there are many ways to connect microplastics with classroom topics such as chemistry, hydrology, meteorology, fate and transport, material science, and sustainability. Student interest in the subject, especially as it relates to their personal health and economic outcomes, helps motivate students beyond data collection. As a result of their engagement in this research, students are more likely to be interested in the development of solutions and to engage with the issue in their personal lives. A spectrum of engineers and scientists is required to fill the gap in knowledge of marine microplastic sources, fate, and transport so that technical, social, and policy solutions can be developed in the future.
Footnotes
Acknowledgments
The authors acknowledge the contributions made by undergraduate engineering students, including Ian Sagers, Todd Fournier, Corey Lydon, Scott Bassi, and Patrick Barboza.
Authors’ Contributions
M.K: Methodology, investigation, and writing. A.L.: Methodology, investigation, and visualization. G.D.: Methodology and investigation. E.H.: Methodology and investigation. L.J.: Conceptualization, methodology, investigation, formal analysis, data curation, writing, visualization, supervision, project administration, and funding acquisition.
Authorship Disclosure Statement
No competing financial interest exists.
Funding Information
This project was supported by the