
Abstract
Microplastic pollution is a growing concern worldwide, with rivers and their tributaries playing a pivotal role in transporting and distributing these particles throughout ecosystems. This study provides a comprehensive analysis of microplastic pollution in Fishkill Creek, a tributary of the Hudson River, for two seasons (fall and spring) with the valuable assistance of K-12 students in sample collection from three distinct sites, Sarah Taylor Park, Doug Phillips Park, and Hopewell Recreation Beach in Fishkill, NY. The investigation encompassed the collection and analysis of water, bed load, and suspended sediment load samples to determine the abundance and distribution of microplastics in a creek system as well as to determine the relationship between microplastic concentration and the creek flow rate. The average microplastic concentration was found to be 6.86 ± 1.97 items/L, 238.40 ± 32.46 items/kg, and 3.89 ± 1.15 items/L for water, bed load, and suspended sediment load, respectively. From the relationship between microplastic concentration and the historic flow rate of Fishkill Creek, it was found that a higher flow rate significantly dilutes the microplastic concentration in the measured compartments in the creek system. Physical and chemical properties of the microplastic samples were characterized, including size, shape, color, and polymer type. Microplastics displayed diverse physical attributes, with irregular shapes and varying polymer types, suggesting multiple sources and degradation processes. These findings underscore the pressing need for mitigation strategies to address microplastic pollution in aquatic ecosystems.
Introduction
Microplastics (plastics <5 mm) are now a global concern for their high concentration, ubiquitous presence, and harmful impact on the environment (Lofty et al., 2023). Due to the small particle size microplastics can easily travel in all environmental compartments (atmosphere, water bodies, or soil) and, therefore, disrupt the balance of the ecosystem. Transport and deposition of microplastics in water is dependent on the size and density of plastics (Nizzetto et al., 2016). Studies have found that the smaller and less dense polymers are easily ingested by aquatic animals as they can remain suspended in the water body for a long period of time (Bhutto and You, 2022; Guo et al., 2021). Aquatic organisms go through several physical problems due to microplastic pollution in the environment. Direct physical problems like decreased swimming abilities (Cole et al., 2013) or increased molting (Bergami et al., 2016) can be a result of high microplastic concentrations in the living environment of smaller invertebrates. Lusher et al. (2020) found that corals ingest microplastics and the retention of microplastics reduces the capability of feeding by the coral and decreases the reserves of energy in the organism. Microplastics have also been found harmful for phytoplankton and zooplankton. For phytoplankton, penetration of microplastics on the plankton wall has been found to decrease the absorption of chlorophyll (Nerland et al., 2014). For zooplankton, ingestion of polystyrene microplastics impact their feeding ability (Cole and Galloway, 2015). The physical properties of microplastics may be an important factor for their availability in the food chain. Bhutto and You (2022) found that freshwater animals have certain preferences for ingestion of certain colors of microplastics; for example, white, yellow, and blue particles are more likely to be ingested. In another study, shape of the microplastics were found to play an important role in ingestion by aquatic life; for example, fiber-type microplastics resemble worms and eggs and are often accidentally ingested by fishes (Peters et al., 2017).
Microplastic ingestion by humans, on the other hand, is mostly indirect and a result of bioaccumulation (Shalom et al., 2022). The human immune system and intestinal inflammation can be affected by these substances when entering the body through the food chain. The organisms at the lower trophic levels directly consume microplastics and they move up the trophic level until reaching humans. Through ocean food sources (e.g., fish, clams, mussels, or oysters) microplastics can be ingested. Though the human body can eliminate up to 90% of the ingested plastics (Wright and Kelly, 2017), shape and size of the microplastics may affect the clearance and retention rates by humans. Feng et al. (2023) found that micro and nanoplastics (MNPs) (microplastics ≤5 mm and nanoplastics ≤1 µm) which have carcinogenic and mutagenic activity in humans can enter the blood, muscles, and liver tissues through continuous consumption and inhalation. A significant portion of these MNPs are coming from the plastics used in everyday life.
Microplastics are being produced every day from our daily activities and to examine the extent of the microplastic problem, extensive data collection is required. To achieve this, the involvement of public participation in data collection or data analysis could be beneficial (Rambonnet et al., 2019). This type of public participation in the research process, often called citizen science, helps the researchers to save time and money and the volunteers to learn from the citizen science experience (Dickinson et al., 2010). Though the number of citizen science studies on plastics, both in marine and riverine ecosystems, has increased during the past few decades, these projects have focused mostly on macroplastics (Zettler et al., 2017). Engaging the communities in microplastic research and spreading scientific knowledge may increase awareness of plastic pollution and can thereby result in better environmental and societal outcomes (Dickinson et al., 2010).
Participatory science is a partnership between public volunteers and research teams. The goal is to engage participants in the scientific process to personalize and localize the human role in microplastic pollution and the negative impacts on freshwater and marine systems. Moreover, raising awareness may eventually result in limiting the use of plastic products and their disposal into the environment. Participants are encouraged to act both on their own and through the participatory science project (Sanders and Brandes, 2020). Scientists’ goals extend beyond studying issues such as plastic and microplastic pollution, to promoting leadership, education, and outreach activities. Public involvement in participatory science is often motivated by the same curiosity that drives scientific research. The collaborative learning environment of engagement with scientists can help the public to better understand the challenge microplastic pollution poses in the stakeholder community and the negative effects on riverine systems.
Luo et al. (2019) found that microplastic pollution is more severe in small water bodies compared with estuaries and coastal waters. Even for the same water body, microplastic concentration can vary significantly from one matrix to another (e.g., microplastic concentration in sediment is 600,000-fold higher than water concentrations in the Elbe River) (Scherer et al., 2020). Urban streams are intricately connected to the city’s infrastructure and terrestrial sources of microplastics. Therefore, these streams significantly influence the microplastic load in large rivers and marine environments (Rimondi et al., 2022).
This study aims to determine (1) the change of microplastic abundance and properties (physical and chemical) for two different seasons (spring and fall) over 5 months (September ’22, October ’22, November ’22, April ’23, and May ’23), and (2) compare the change in microplastic concentration and types among water samples, sediment samples, and suspended sediment load samples in the Fishkill Creek involving K-12 students and public volunteers in data collection. We hypothesize that spring season results in low microplastic concentration as higher flow rate from snowmelt may dilute the microplastic inputs. Involving community people in data collection for this research has resulted in large dataset in small amount of time and we hypothesize that the training provided to the community people may help reduce plastic pollution from the Fishkill Creek area in future.
Materials and Methods
Participatory science approach in sample collection
In fall 2022, 72 high school students participated in sample collection for this study. Participation by community members allowed the research team to collect more samples, while also educating residents about microplastic pollution. Samples were collected following our previously established standard operating procedure and mentioned in the later paragraphs of this section.
Before sample collection, education materials were adapted to each audience using: a presentation with visual slides, group discussions, and demonstrations. Clarkson staff led pretrip lessons for each high school group in their classroom. Public volunteers were engaged with visual aids using slides from the same lessons, printed on laminated sheets, at the beginning of each site visit. An introductory discussion among the leader and participants on the use of plastics in everyday life helped provide context. After the educational presentation and discussion, participants filled out the Microplastic Sampling Protocol data collection sheet (Table 1), including a presampling site survey with the time, date, and location of the site visit.
Summary of Sample Collections (Water Column, Suspended Sediment Load, and Sediment Load)
Samples were collected between 10:00 am and 12:00 pm.
ADD, antecedent dry days; DPP, Doug Phillips Park; HRP, Hopewell Recreation Park; STP, Sarah Taylor Park.
For water sample collection, a plankton net of mesh size 333 μm was used. Before collecting a sample, the plankton net was rinsed with creek water three times. Then the net was suspended one foot below the water surface for 5 min facing upstream. Subsequently, the surface of the plankton net was rinsed with MilliQ water to gather the sample and the resulting water was preserved in a 20 mL glass vial. The average water velocity (V) of the river flow was recorded from the travel time taken by a floating object to reach 10 m distance, upstream of the location of the plankton net. The volume of water (in liters, L) that passed through the plankton net was then calculated using the below equation:
volume = A × v × t
where A is the area of the plankton net entrance, v is the average velocity of the water flow, and time, t = 5 min. This approach allowed the number of microplastics per unit volume of water to be determined (items/L).
Suspended sediment load can be defined as the particles that bounce along the channel, partly supported by the turbulence in the flow and partly by the bed. For collection of suspended sediment load, water behind an obstruction (e.g., stone or wood) was used to disturb the flow and then 20 mL sample was collected using a turkey baster and stored in a 20 mL glass vial. For sediment load, samples were collected from 0 to 5 cm below the creek bed and stored in a 20 mL glass vial before further treatment.
Once all seven samples (three water samples using plankton net, three suspended sediment load samples using turkey baster, and one sediment sample) were collected and labeled, they were packaged and shipped by Beacon-based Clarkson staff to the environmental engineering laboratory at the main campus in Potsdam, NY. In Supplementary Fig. S1, images during sample collection are presented.
Study area
The Hudson River flows ∼507 km from Lake Tear of the Clouds in the Adirondack Mountains to the Atlantic Ocean at the Battery in New York City, NY. Dozens of tributaries feed the Hudson and within its tidal estuary, Fishkill Creek provides important spawning areas for coastal migratory fishes. The Fishkill Creek watershed, located in Dutchess and Putnam Counties, NY, drains about 240 km2 over 14 municipalities. The main stem of Fishkill Creek is ∼61 km long, entering mile 60 of the Hudson River at Beacon, NY. Most land used in the creek watershed is forest, followed by residential. Recently, more residential and commercial land has been replacing agricultural areas. In this study, samples were collected from three public parks (Sarah Taylor Park [STP], Doug Phillips Park [DPP], and Hopewell Recreation Beach [HRB] Park) along Fishkill Creek (Fig. 1).

Map of sampling sites: HRB, DPP, and STP. DPP, Doug Phillips Park; HRB, Hopewell Recreation Beach; STP, Sarah Taylor Park.
STP is a public park located in a high-density, intensively developed area in the Village of Fishkill, NY. The north bank of the creek at Site A is about 21 m from the state highway NY Route 9. The south bank has a steep slope that leads up to a large commercial parking area. A large gravel bar bisects the creek. Wood, debris, and sediment deposits were more common than in other sites, including on the bar. A preserved, natural riparian strip provides cover of trees, shrubs, and overhanging branches.
The DPP sampling site is located next to a boat launch on the north bank, 3 km upstream of STP, off NY State Route 52 in a suburban area of the Town of Fishkill. About 12 m of stream bank is maintained lawn, between wide riparian buffers along the rest of the channel. Flow rates were highly variable, ranging from nearly null to about 1.5 m/s. Some erosion is visible along the north bank. A large natural island with trees and bushes sits opposite. Deposited debris was observed as less common than at STP.
HRB is on the north bank of a public park 8 km upstream of DPP in a rural area of Hopewell Junction, NY. Public amenities adjacent to the access points include a large parking area, picnic tables, and a dirt road. The channel is about 6 m wide, with depths between 15 and 90 cm at the deepest points. Surface trash at HRB, including plastics, was more common than at the other two sites. A summary of the sample collection from the three sites is presented in Table 1.
Sample pretreatment
All three steps of laboratory processing (digestion, density separation, and filtration) were carried out following the sample processing technique suggested by the National Oceanic and Atmospheric Administration, with some modifications (Haque et al., 2024; Masura et al., 2015). For water and suspended sediment load samples, first, samples (20 mL) were digested using 20 mL 30% H2O2 with 20 mL 0.05 M Fe (II) solution at 75° C for 30 min. An additional 20 mL of 30% H2O2 was added and then heated for 30 min more until no natural organic material was observed (Haque et al., 2024). For density separation, a concentrated saline solution (1.2 g/mL) of NaCl was added to the sample and the supernatant was allowed to settle for 24 h. The beaker was covered with aluminum foil during this period. After density separation, the floating microplastics were vacuum filtered using a 0.45 µm glass fiber filter paper. Then, the filter papers were dried and covered with aluminum foil for a day at room temperature before microscopic analysis.
Sediment samples were first dried at 70° C for 24 h and then the oven dried weight was recorded. Next, 100 g samples were moved into a clean glass beaker and digested using 20 mL 30% H2O2 with 20 mL 0.05 M Fe (II) solution at 75° C for 30 min. An additional 20 mL of 30% H2O2 was added and then heated for 30 min more until no natural organic material was observed (Peng et al., 2017). After digestion, a concentrated saline solution (1.5 g/mL) of ZnCl2 was added to the sample and the supernatant was allowed to settle for 24 h. The vertical position of microplastic may vary in different matrices (e.g., water and sediment) and so salts of different specific densities (1.2 g/mL NaCl and 1.5 g/mL ZnCl2) were used to separate the microplastics from its respective matrices. The beaker was covered with aluminum foil during this period and the floating microplastics were vacuum filtered using a 0.45 µm glass fiber filter paper. Since no visible plastics were observed in the sediment, in this study, no sieve was used before filtration (Peng et al., 2017). After that, the filter papers were dried and covered with aluminum foil for a day at room temperature before microscopic analysis (Haque et al., 2024).
Sample analysis
After extraction, the microplastics were counted and photographed using a stereo microscope (Olympus SZX12, eyepiece 10X, and maximum objectives 20X. Color camera LC30). When observing particles, the microscope was moved manually in a “zigzag” pattern from left to right until any microplastic was identified. A particle was identified as microplastic following the criteria provided by Han et al. (2020). This pattern continued thoroughly until the whole filter paper was examined. Our methodology follows the suggestion from Brandt et al. (2021) where measuring the entire filter paper is advised. They found that the magnitude of the averaged subsampling error may exceed up to 50% if only 5% or less of the filter is measured. If a particle was identified as a microplastic, its image was captured. Analysis of all visually identified particles were performed using ImageJ software for shape, size, and color. After microscopic analysis, all the particles on the filter paper were analyzed through Fourier transform infrared (FTIR) spectroscopy (Thermo Scientific; Nicolet iS10 FTIR Spectrometer, Laser: HeNe, Source Type: Midinfrared Ever-Glo and Tungsten Halogen, Spectral Range: 7,800 to 350 cm−1 optimized, midinfrared KBr beamsplitter & 11,000 to 375 cm−1 XT KBr extended range midinfrared optics, Spectral Resolution: better than 0.4 cm−1>) coupled with an attenuated total reflectance (ATR) accessory (He et al., 2021) (Everest Diamond ATR Accessory for the Nicolet Summit Spectrometer, Angle: 45°, Crystal Type: Diamond [AR-coated], type: Single-bounce ATR). The particles were scanned for wavenumber from 500 to 4,000 cm−1 and analyzed for IR transmissible substrate with 32 scans. The spectra were processed using OMNIC software (Anonymous, n.d.) with Thermo Scientific FTIR i10. Polymers corresponding to reference spectra >85% (compared with Open Specy—Microplastic Spectra) were considered following the literature (Da Costa et al., 2023) and manual inspection was carried out throughout the process. Spectra obtained in this study are presented in (Supplementary Fig. S2).
Quality control and quality assurance
In this study, no plastic equipment or containers were used for sample collection and storage. Water samples were stored in glass jars with metal lids and sediment samples were stored in glass vials. All sampling equipment was precleaned with MilliQ water prior to every field trip. Field science participants wore chest waders throughout the sampling process, minimizing their exposed clothing. Going forward, the team will follow recent advice from staff of New York State Department of Environmental Conservation, which suggests that mandating low-shed, high visibility clothing of uniform color for all participants during field work to further assist the team in avoiding any contamination during sample collection. To avoid artificial microplastic contamination due to atmospheric transport, cotton laboratory aprons and nitrile gloves were worn throughout the laboratory processing. The laboratory bench was cleaned with filtered ethanol and only MilliQ water was used for rinsing the containers. No more than two individuals worked in the laboratory at the same time. Laboratory processing (e.g., pouring 30% H2O2 and 0.05 M Fe (II) solution with samples) was carried out under a laminar flow hood. In the laboratory, plastic stirrers were replaced with glass stirrers and after filtration, filter papers were covered immediately with aluminum foils.
Statistical analysis
Microplastic concentration was calculated using the ratio between microplastic number and the total volume of water (L) for water samples and the ratio between microplastic number and dry weight of sediment (kg) for sediment samples (Da Costa et al., 2023). Statistical differences in terms of microplastic concentrations between sampled locations or sampling method were tested using one-way ANOVA followed by a post hoc Tukey test where p-values <0.05 were considered to indicate statistically significant differences. The statistical tests and graphs were performed using R Studio (v4.2.3) and Microsoft Excel.
Results and Discussion
Microplastic concentration in the water samples
Microplastic abundance in the water samples from the two seasons (fall and spring) and three different locations (HRB Park, DPP, STP) in Fishkill Creek varied from 3 items/L (at HRB April ’23) to 11 items/L (STP September ’22), with an average of 6.9 ± 2 items/L (mean ± standard deviation). The microplastic concentration varied significantly (F = 43.31, p = 2.77E-06) among the months where a higher microplastic concentration was observed in the fall season (September ’22, October ’22, and November ’22) than the spring season (April ’23 and May ’23) (Fig. 2a). However, a significant concentration difference was not observed from site to site (F = 0.52, p = 0.59) (HRB: 6.46 ± 1.64, DPP: 6.93 ± 2.12, STP: 7.2 ± 2.18 items/L) (Fig. 2b). This phenomenon could be explained by the snow melting of the creek watershed resulting in a dilution of microplastics in the spring season. This hypothesis is supported by the finding that the relationship between microplastic concentration with monthly mean flow rate of Fishkill Creek (USGS 01372800 station) and the Hudson River (USGS 01358000 station) was found to be negatively linearly correlated with 0.90 and 0.95 coefficient of determination values respectively (Fig. 2c and d). Our finding supports the study by Wang et al. (2018) on a natural stream, where low flow conditions also resulted in higher microplastic concentration.
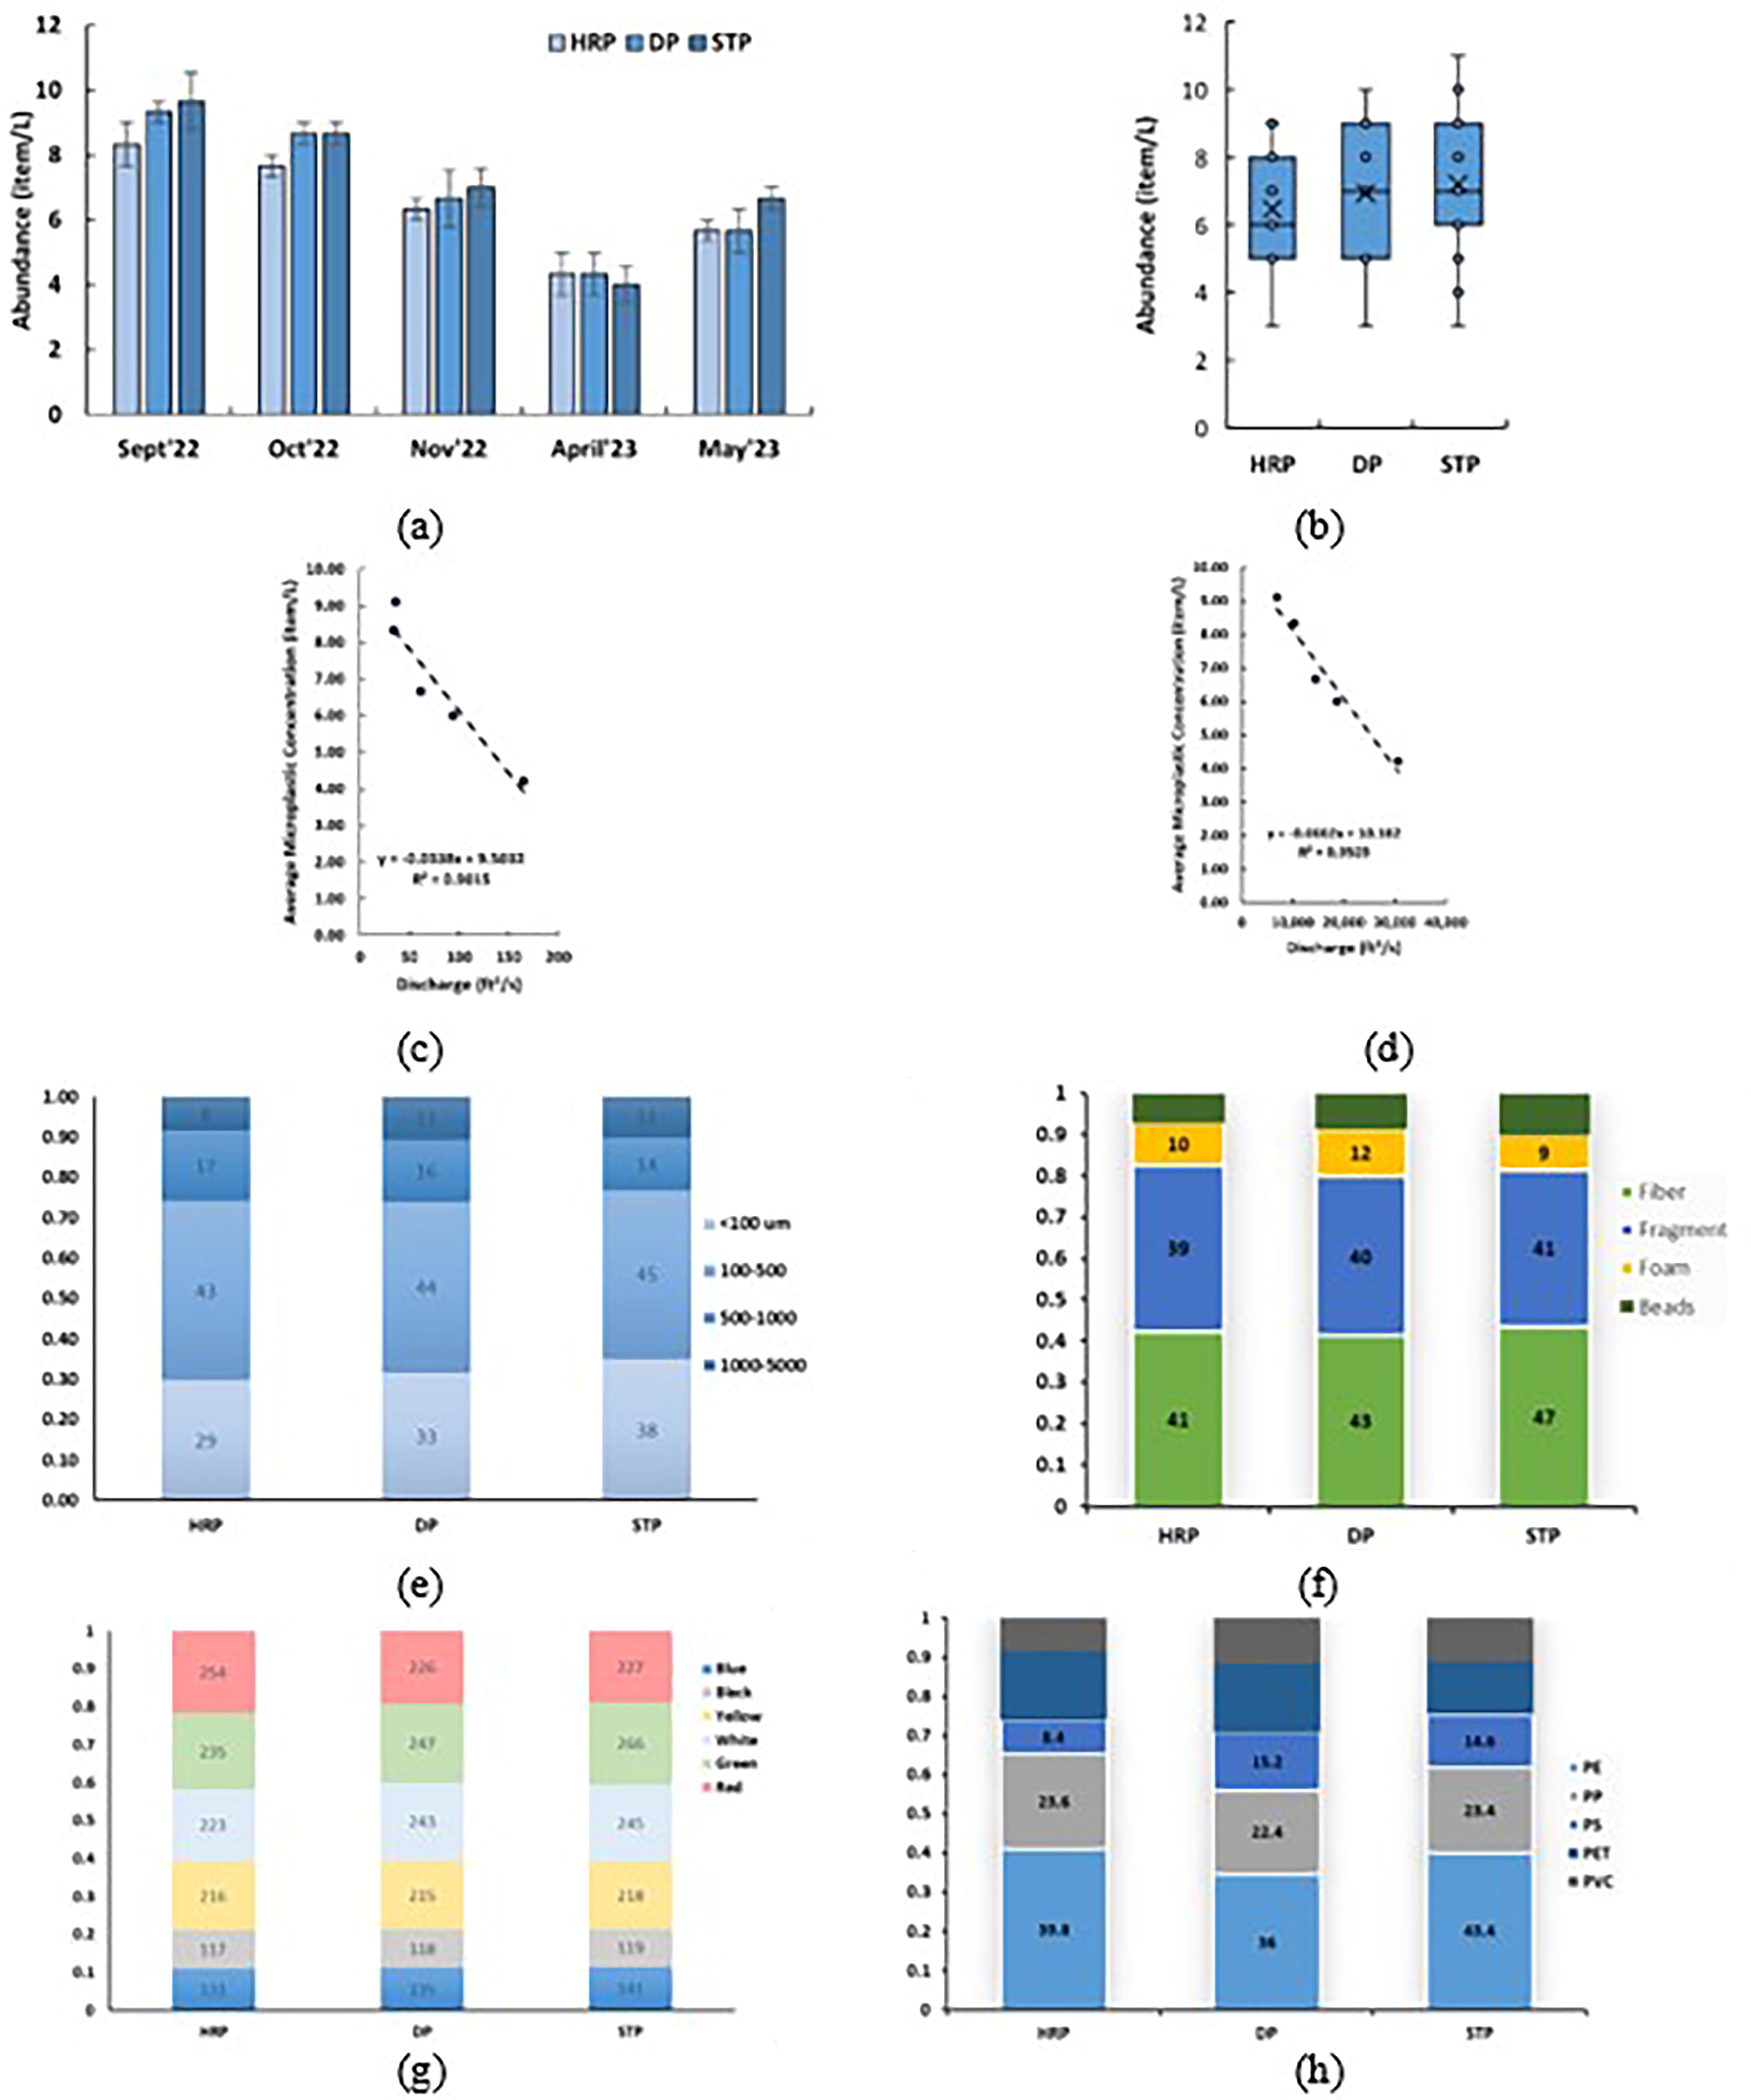
Microplastics in the water samples of Fishkill Creek from three sites: HRP, DPP, and STP. Microplastics concentration variation:
The average microplastic concentration in all sites surpassed the established threshold value for food dilution effects, determined through organismal and population scale toxicity tests (5 microplastics/L), as outlined in the 2024 California Integrated Report on surface water quality assessments (Cal, EPA).
The dominant microplastic: size was 100–500 µm (42–44%) and <100 µm (30–35%), shape was fiber (41–44%) and fragment (38–40%), color was blue (32–38%) and red (23–25%), polymer was polyethylene (PE) (35–41%), and polypropylene (PP) (21–24%) (Fig. 2e–h). The high abundance of smaller plastics (<500 µm) in the water column could be due to plastic fragmentation by natural phenomena (e.g., water current and UV radiation) and also from the higher release rate of smaller plastics to the environment. Ding et al. (2019) found that for South China Sea, dry deposition of atmospheric microplastic was around 1,400 t. They also found that the number of microplastics peaked as the particle size decreased. In another study by Hoellein et al. (2019), microplastic deposition velocity in streams was found highest for fragments, intermediate for fibers, and lowest for pellets. Klein et al. (2023) found that fiber concentrations depend on population density and atmospheric microplastic deposition varies between urban and rural areas. The Fishkill area is enriched with urban-style entertainment where numerous parks, trails, cultural, and historic places attract the residents and visitors and also may contribute as potential sources of microplastics.
Fibers and fragments are the two most common shapes of microplastics found in the natural environment, and are the dominant shapes observed in our study. Fragments from plastic bottles, packaging, or weathered car tires as well as fibers from clothing can contribute to the high concentration of microplastics in runoff and treated wastewater sources in this area. Colors observed in this study are mostly those commonly found in plastic materials people use in daily life, such as colorful fibers from clothes and fragments from plastic bags or containers. PE and PP are the two most abundant types of plastics found in environmental field studies, and this held true in our study area. In the three park areas, the high abundance of plastics commonly used in PE bags or PP bottles, containers or food packaging can reasonably be expected to derive, at least in part, from degraded surface trash. In summary, microplastics contamination in Fishkill Creek results from a combination of domestic and commercial uses and enters the natural creek system from a variety of industrial and municipal point sources, as well as surface runoff. Therefore, the participatory science approach used in this research could not only help to identify and quantify microplastic pollution in the environment but could improve mitigation by raising awareness in communities.
Microplastic concentration in sediment samples
Microplastic abundance in sediment samples of Fishkill Creek varied from 211 items/kg (at HRB September ’22) to 270 items/kg (STP May ’23), with an average of 238 ± 32 items/kg (mean ± standard deviation). Like the water samples, the microplastic concentration was not significant (F = 0.35, p = 0.71) from site to site but significant (F = 22.56, p = 5.43E-05) among the months. However, unlike the water samples, microplastic concentration in sediment samples was not lower in the spring season. Rather, an increasing pattern was observed with time (Fig. 3a). The insignificant variation in concentrations among sites for both water and sediment samples could be due to their proximity, as well as the relative similarity in their surrounding land use types. The average microplastic concentrations in the three parks were: 235 ± 30 items/kg in HRB, 236 ± 160 items/kg in DPP, and 243 ± 31 items/kg in STP (Fig. 3b). Over time, the microplastic concentrations decreased in water samples and increased in sediment samples, potentially due to settling of microplastics in the creek bed. This contrast in microplastic concentration for water and sediment matrices also becomes evident in their physical and chemical properties.
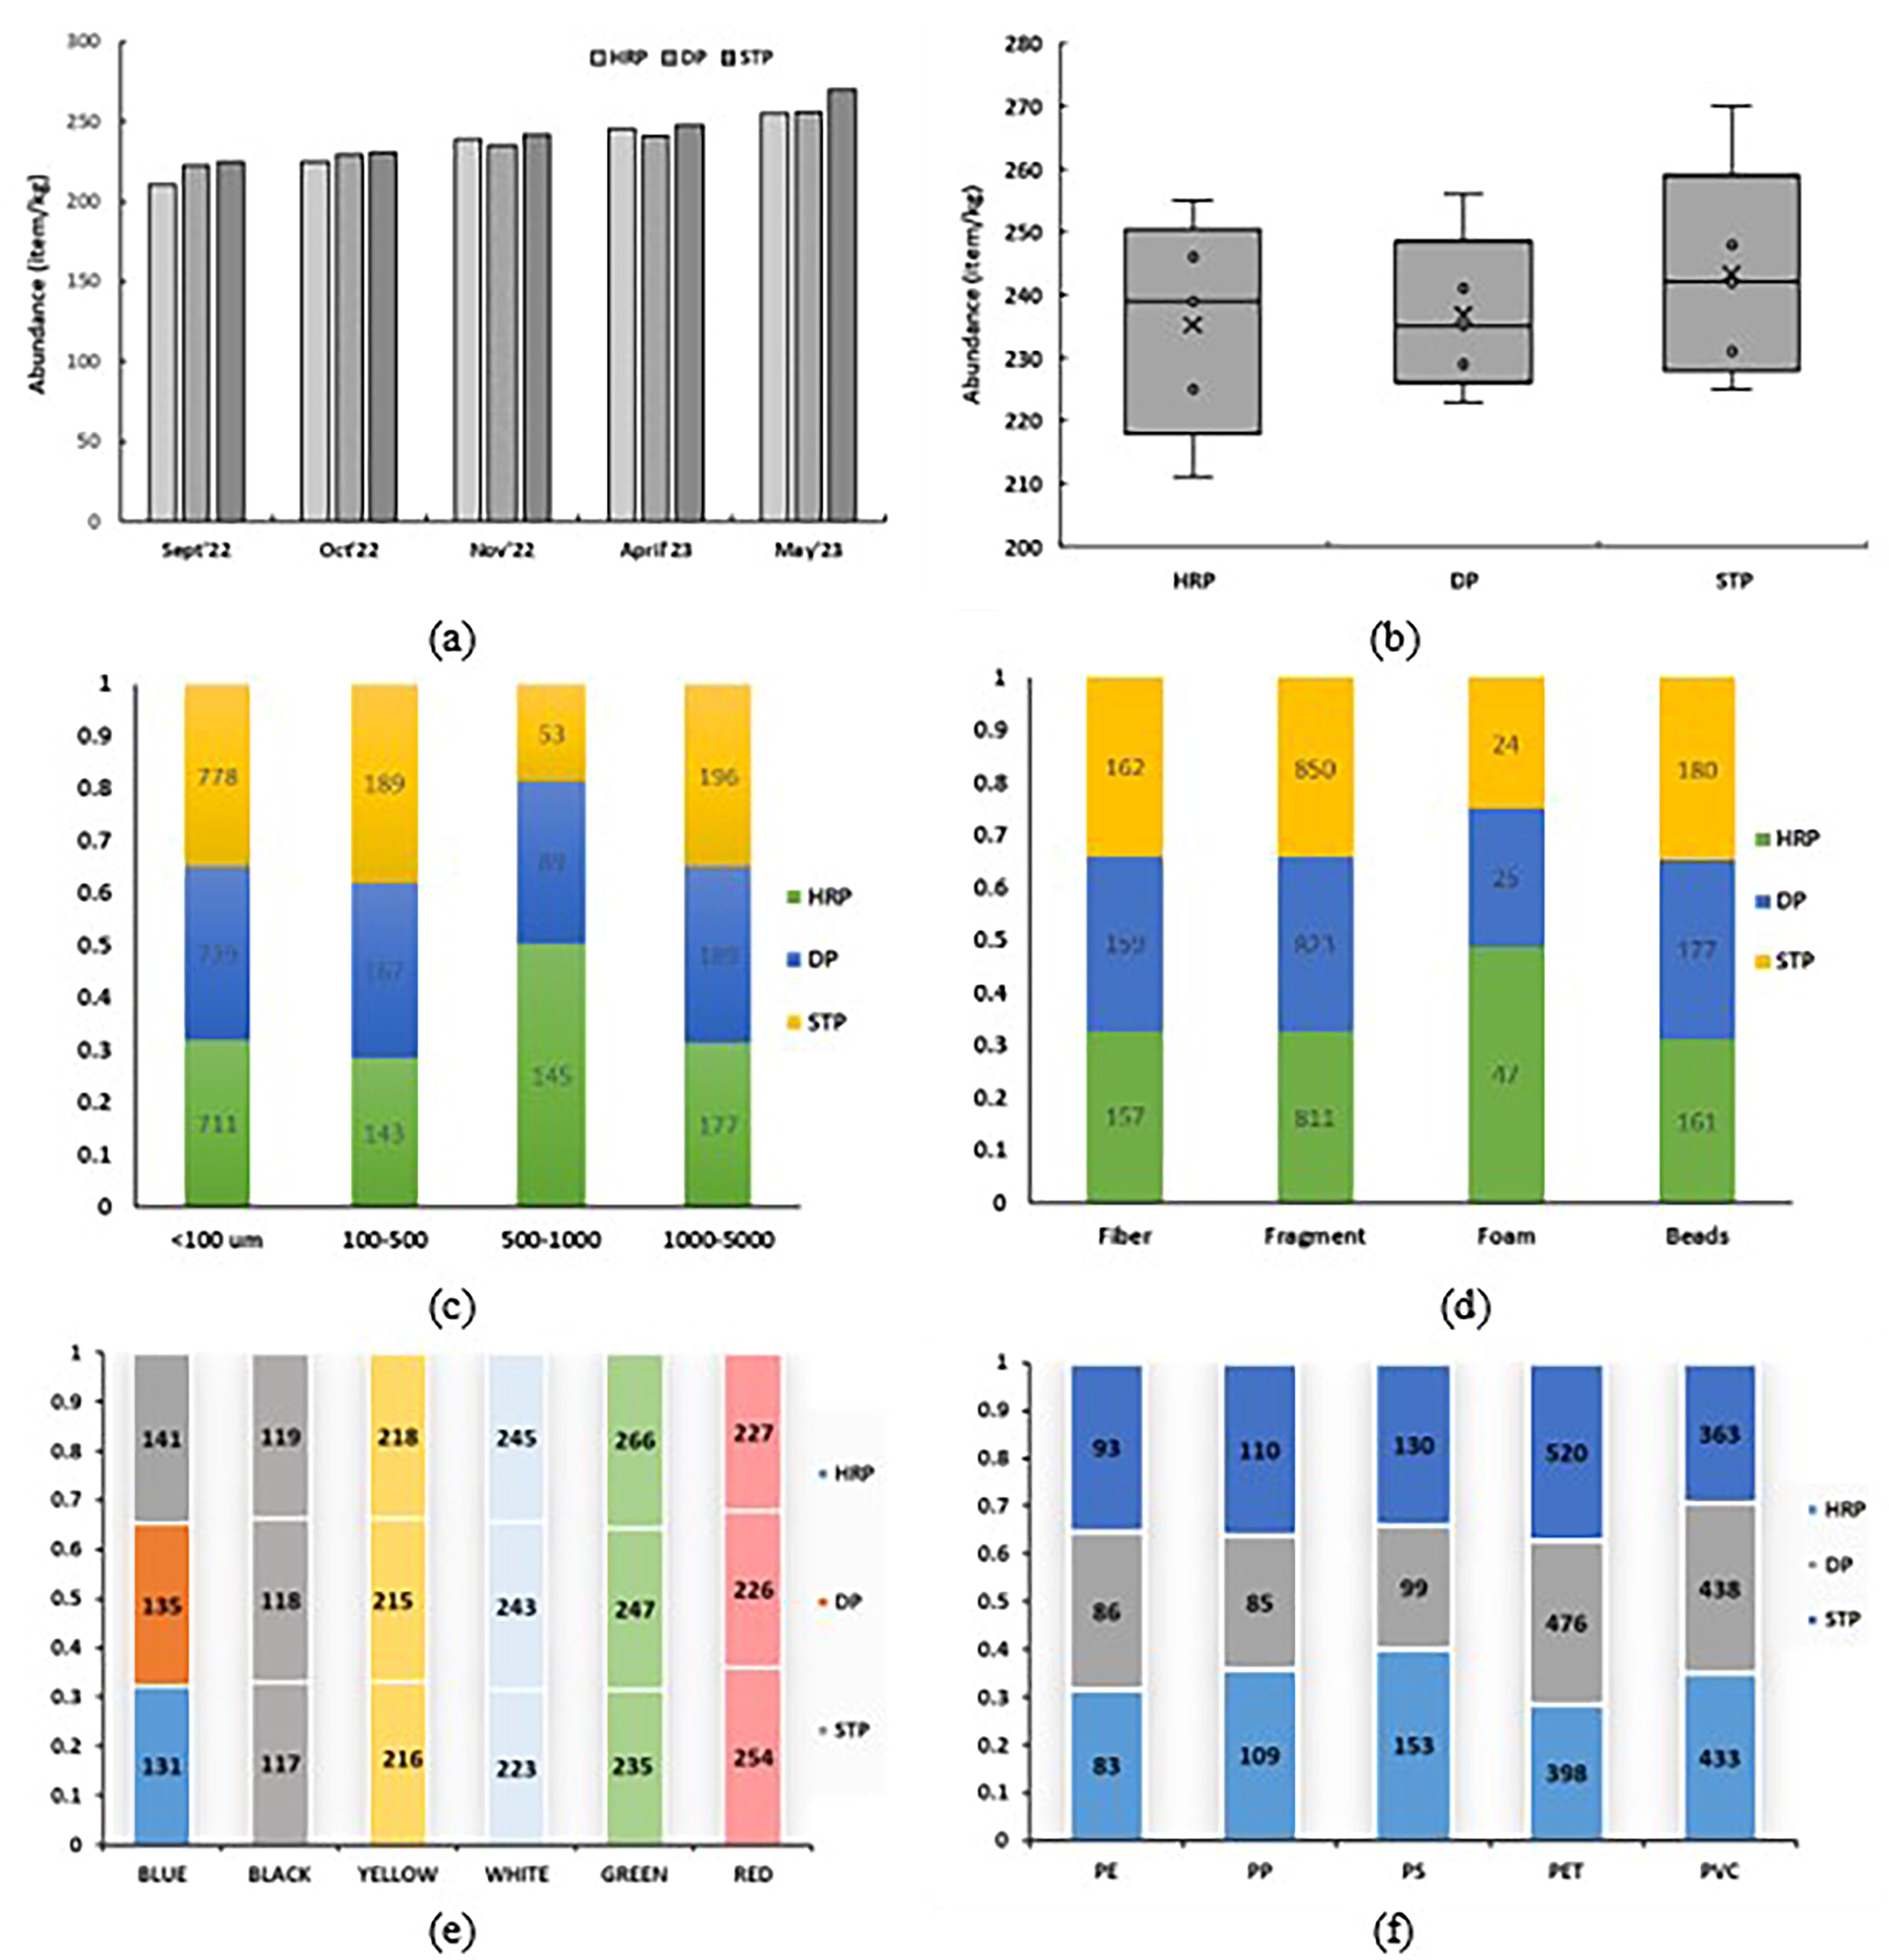
Microplastics in the sediment samples of Fishkill Creek from three sites: HRP, DPP, and STP. Microplastics concentration variation:
In sediment samples, the dominant microplastic: size was <100 µm (61–64%), shape was fragment (69–70%), colors were green (20–22%), white/transparent (19–21%) and red (19–22%); polymer was PE terephthalate (PET) (34–43%) and polyvinyl chloride PVC (30–37%). The high abundance of PET and PVC, and smaller plastics (<100 µm) in sediment is likely due to a combination of their higher density, resistance to degradation, and ongoing fragmentation processes that break down larger plastic debris over time (Fig. 3c–f). This result further explains fragments being the dominant microplastic shape type in the sediments. Wide color variation of microplastics in sediments again supports evidence of plastic accumulation over an extended time from various sources.
Microplastic concentration in suspended sediment load samples
The microplastic concentration in the three parks varied from 1 item/L (at HRB April ’23) to 7 items/L (STP September ’22), with an average of 3.9 ± 1.2 items/L (mean ± standard deviation) (Fig. 4a). The average microplastic concentration was: 2.2 ± 0.77 items/L at HRB, 3.73 ± 1.34 items/L at DPP and 5.73 ± 1.36 items/L at STP (Fig. 4b) and unlike water or sediment samples, no significant (F = 1.03, p = 0.44) concentration difference was observed among the months but a significant (F = 25.27, p = 6.24E-08) concentration difference was observed among the sites. This phenomenon indicates that the microplastic pollution status in suspended sediment load is different and lower than in water or sediment samples. The suspended sediments represent particles that are in a transitional state between floating and settling, potentially capturing fewer MPs as they are more prone to being influenced by water flow, turbulence, and obstacles (e.g., boulders, wooden logs, or vegetation) to the creek flow. Therefore, MPs are more likely to be distributed unevenly and remain suspended in the water column, resulting in higher concentrations in water samples.

Microplastics in the suspended sediment load samples of Fishkill Creek from three sites: HRP, DPP, and STP. Microplastics concentration variation:
The physical and chemical characteristics of microplastics found in suspended sediment load samples (Fig. 4c–f) represent a combination of plastics found in the water and sediment samples. For the suspended sediment samples, the dominant microplastic: size was <100 µm (53–63%), shape was fragment (70–71%), color was blue (31–37%), polymer was PE (29–50%), and PP (27–36%). The high abundance of smaller plastics (<100 µm) is likely explained by the tendency of smaller particles to remain in suspended form. Blue color fragments may enter the creek system from domestic products and recreational facilities in the park area. Again, possibly owing to their low density, plastic types such as PE and PP were found in high concentration in suspension.
Conclusion
This study involved a brief investigation of microplastic pollution in Fishkill Creek at three sites: HRB, DPP, and STP. Results show that the three sites have a similar abundance of microplastics, indicating that there is not a significant difference in sources between sites. The analysis of water column, sediment load, and suspended sediment samples provides a holistic understanding of microplastic pollution in this area, revealing relatively low concentrations compared to findings from other studies. Our methodology effectively recovers a wide range of microplastics from both water and sediment, however, the differences in density separation may affect the comparability of results. Future studies should consider using a uniform density separation approach to facilitate more direct comparisons across matrices or explore the use of multiple-density solutions to capture the full spectrum of microplastic types. Moreover, one limitation of this study is that we did not consider any blank and replicate samples. We recommend analysis of blank and replicate samples in future studies suggested by Dawson et al. (2023) to compare with the existing data. The seasonal variation in microplastic concentration observed in Fishkill Creek should be tested for other urban and rural creek systems. The most common microplastic type was blue smaller fragments (<500 μm). Further research into the weathering rate of microplastics would also help to identify the source of these plastics. The participatory science approach in this study helped in data collection and aims in raising awareness in the community.
Footnotes
Acknowledgments
The research team would like to acknowledge with gratitude, in addition to Beacon Institute’s public volunteers, the following teachers, school districts, and student participants for their essential participation in collecting field data for this study: Mr. Steven Birnbaum, John Jay Senior High School (East Fishkill, N.Y.) A.P. Environmental Science. Mr. Mitchell Manzo, Roy C. Ketcham High School (Wappingers Falls, N.Y.) A.P. Environmental Science. Mrs. Natalie Rieder, Beacon High School (Beacon, N.Y.) Field Biology. The authors would like to thank Dr. Daniel Andreescu and Dr. Siwen Wang for helping with Fourier-transform infrared spectroscopy and stereo microscope, respectively.
Authors’ Contributions
A.H., T.M.H., and A.B.M.B. conceptualized the study. T.S., A.P., and B.W. planned for the study sites and collected the samples from the sites. A.H., A.T., and F.U. processed the samples, performed the analyses, and wrote the article. T.M.H. and A.B.M.B. contributed to the writing, editing, and revising of the article.
Data Availability
The datasets generated during and/or analyzed during the current study are available from the corresponding author on reasonable request.
Author Disclosure Statement
The authors report no conflict of interest.
Funding Information
This study was promoted and supported by the Team Science Project Planning Grant (2022) of Clarkson University and NYS Center of Excellence in Healthy Water Solutions.
References
Supplementary Material
Please find the following supplemental material available below.
For Open Access articles published under a Creative Commons License, all supplemental material carries the same license as the article it is associated with.
For non-Open Access articles published, all supplemental material carries a non-exclusive license, and permission requests for re-use of supplemental material or any part of supplemental material shall be sent directly to the copyright owner as specified in the copyright notice associated with the article.