
Abstract
Anthropogenic litter in the environment is a globally pervasive contamination issue with harmful impacts on human and ecological health from exposure to both macroscale (≥5 mm) and microscale (<5 mm) litter. To assess the prevalence, distribution, and drivers of plastic and nonplastic litter in the environment, we assessed anthropogenic litter abundance and characteristics at 10 sites across an urban catchment (Deer Creek near St. Louis, MO) in October 2022. Macroscale litter was evaluated within the channel bed, and stream water and sediment were sampled to assess anthropogenic microparticle content. The abundance of all macrolitter types ranged from 0.03 to 1.42 counts/m2, while plastic macrolitter ranged from 0.00 to 0.61 counts/m2. Plastic films (e.g., bags) were the most common (34.7%) type of plastic macrolitter that we found. Microparticles in water were below the limit of detection at all sites, while in sediment they had concentrations ranging from below the limit of detection to 84.28 counts/kg (with confirmed detections at 6 of 10 sites). Macroscale and microscale litter abundances across the watershed did not correlate, suggesting different sourcing and distribution drivers for the two debris size categories. Macroplastics correlated strongly and positively with impervious surface area and stream discharge, implying a combined influence of land use and hydrology on their deposition. Our findings suggest that the relationship between macroscale and microscale litter might vary depending on local sourcing and transport mechanisms.
Introduction
Anthropogenic litter, comprising plastic, metal, glass, construction, rubber, textile, and other material (UNEP, 2021), is a global pollution phenomenon (Derraik, 2002). This litter is defined by two main characteristics: (1) manufacture and disposal by humans and (2) persistence in the environment (Serra-Goncalves et al., 2019; UNEP, 2021). Although the litter was initially characterized as “marine” debris due to its final sink in marine environments, the presence of this contaminant suite is largely driven by land-based use with subsequent passage to the ocean via terrestrial waterways (Jambeck et al., 2015). While plastics tend to be the focus of current research due to their prevalence, persistence, and known deleterious effects on ecosystems, other types of anthropogenic litter can also have ecological impacts such as enhancing the spread of invasive species (Mghili et al., 2023; Rochman, 2018).
Plastics are a growing category of anthropogenic litter due to their versatility, low production cost, durability, and widespread use in daily life (Geyer et al., 2017; Laist, 1987). The most frequently produced plastic polymers are often designed for quick disposal, such as plastic packaging (Jambeck et al., 2015), leading to substantial amounts of plastic waste. Because plastics embody a range of polymer types, their distribution in the environment often varies. Some plastics are highly buoyant and stay suspended in the water column in aquatic environments, while others sink and accumulate in sediment (Laist, 1987). Once in the environment, plastic litter can become an environmental hazard through several mechanisms, including (1) colonization of the plastic litter resulting in the spread of nonnative species on a global scale (García-Gómez et al., 2021); (2) entanglement with and ingestion of large plastic litter, which can have easily detectable (e.g., starvation, mortality) and less apparent (e.g., reduced fitness) effects on aquatic life (Lavers et al., 2014); and (3) degradation of large plastic litter (“macroplastics” that are ≥5 mm) resulting in the production of “microplastics,” which are small-sized (<5 mm) plastic particles whose consumption has been reported in aquatic species at every level of the food chain (Rochman, 2018).
Microplastics present additional concerns upon ingestion due to their ability to sorb pesticides, polychlorinated biphenyl compounds, toxic metals, and other chemical contaminants (Gassel and Rochman, 2019; Rochman et al., 2019; Rochman et al., 2014). Microplastics and even smaller nanoplastics (<1 µm) can also cross biological barriers, enter blood, and accumulate in various organs (Fleury and Baulin, 2021; Zarus et al., 2021). In addition to microplastics, other less studied anthropogenic microparticles such as “natural” or “semisynthetic” microfibers (e.g., cotton, viscose) are prevalent in the environment and cause adverse effects to aquatic species (Athey and Erdle, 2022). Plastic and textile litter intruding into the environment thus present cascading risks for ecosystem and human health as evidenced by the ubiquitous presence of microplastics in drinking water and food sources as well as synthetic and nonsynthetic microfibers in the global atmosphere (Cox et al., 2019; Finnegan et al., 2022).
Plastic macrolitter sourcing to the environment is strongly linked to human activity and is thus most prevalent in urban areas with high population densities (He et al., 2024). Concentrations of microplastics in freshwater systems are also frequently positively correlated with urbanization and population density (Browne et al., 2011; de Carvalho et al., 2021; He et al., 2024; Jambeck et al., 2015). Along with increased plastic sourcing, urban areas have high levels of impervious surfaces that might increase runoff of stormwater containing both microplastics and mismanaged larger plastic waste (Piñon-Colin et al., 2020). These factors make urban stream systems an important location for the study of the distribution of plastics and other anthropogenic debris of varying size ranges.
We therefore investigated macroscale (≥5 mm) and microscale (<5 mm) anthropogenic debris across an urban watershed. The goals of this research are to (1) assess the prevalence, distribution, and potential sources of plastic and nonplastic debris across the catchment; (2) determine any correlation between macroscale and microscale debris; and (3) examine potential drivers of the debris’ distribution. These efforts can inform better management and understanding of debris intrusion into urban environments.
Materials and Methods
Study area
We explored macroscale and microscale litter across the urbanized Deer Creek watershed near St. Louis, MO. Deer Creek drains into the Mississippi River via the River des Peres basin, with the latter having been the subject of past water quality and quantity research due to historical combined sewer overflows, contamination issues, and dangerous flooding events (Criss and Nelson, 2022; Hasenmueller et al., 2017). On October 17, 2022, and October 21, 2022, we sampled 10 sites throughout the Deer Creek watershed that spanned an impervious surface area (ISA) gradient of 28.9–44.1% in the contributing subwatersheds (Table 1; Fig. 1). Six sites near the stream’s outlet were collocated with United States Geological Survey (USGS) gauging stations, allowing us to assess the influence of discharge on debris distribution at these locations. For each of the six stations, discharge data were averaged for the 20 days prior to the last sampling event (i.e., October 1, 2022, to October 21, 2022) as well as the prior water year (i.e., October 1, 2021, to September 30, 2022).
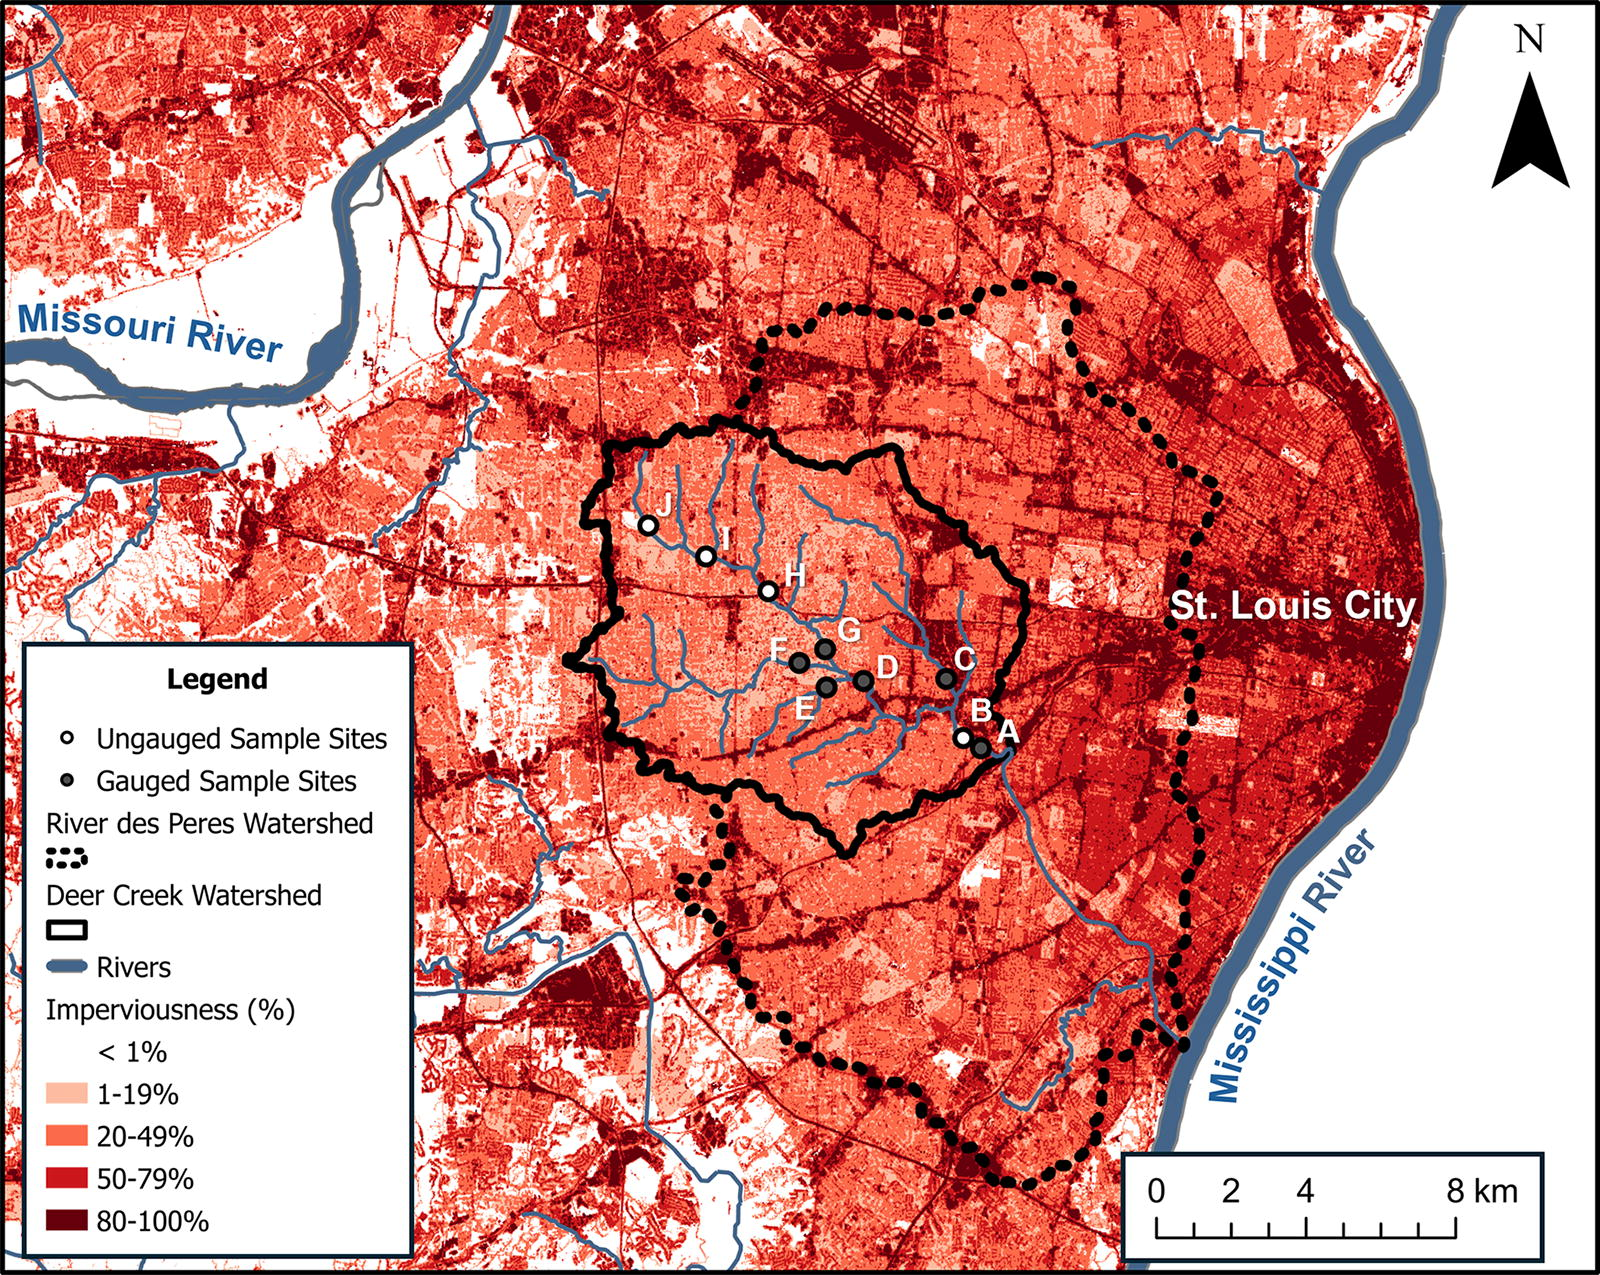
Sampling sites on an imperviousness map (Dewitz, 2023; NLCD, 2021). The Deer Creek watershed is outlined in black within a dashed black outline of the larger River des Peres watershed, which feeds into the nearby Mississippi River. White-filled circles represent sites without associated USGS gauging stations, while gray-filled circles represent sites with USGS gauging stations. Table 1 provides additional information about the sites. USGS, United States Geological Survey.
Characteristics of the Selected Sampling Sites Within the Deer Creek Watershed
The discharge was averaged for the 20-day period leading up to the last sampling date (i.e., October 1, 2022, to October 21, 2022).
The discharge was averaged for the prior water year (i.e., October 1, 2021, to September 30, 2022).
Anthropogenic macroscale debris characterization
To quantify macroscale anthropogenic litter across the watershed, all 10 sites were surveyed for litter types, quantities, and characteristics. Macrolitter data at each site were obtained in a 3 m-wide segment along a lateral cross-section of the stream that spanned from bank to bank. Within each sample section, all litter that was clearly anthropogenic, readily visible without digging into the streambed, and located within the stream’s bankfull channel were counted, except for items tangled in vegetation overhanging the channel. Litter items were categorized into textile, glass, metal, ceramic, rubber, wood, or plastic material (i.e., Supplementary Table S1; Supplementary Fig. S1) and their mass and longest axis length were recorded. Construction materials were also cataloged, but we report their totals separately because they exhibited unique spatial distribution within the watershed and are not typically reported in debris surveys (e.g., Ambrose et al., 2019). While textiles could comprise plastics, natural materials, or a blend of synthetic and nonsynthetic fibers, we classified them separately from plastics as we were unable to identify their material type.
Large items were weighed, then measured along their longest axis in the field using a 3 kg field scale. Any items heavier than 3 kg or partially buried were not weighed or measured for length and were thus excluded from the final average mass and size estimates but were still included in litter totals. Smaller items were taken to the laboratory for additional characterization, including obtaining more accurate weights for the light plastic pieces (e.g., bags). Items composed of multiple materials that included plastic (e.g., foil wrappers with plastic coatings) were categorized as plastic. Plastics were subcategorized (see Supplementary Table S1 for more detail) into films (i.e., bags and other film-like materials), bottles, cigarette butts, food packaging (e.g., wrappers, expanded polystyrene takeout containers), hard plastics, personal protective equipment (PPE; e.g., face masks, gloves), tarps, and other (e.g., shipping labels, packaging tape, garden hoses, toys/game pieces). Debris quantities were normalized to the sampling area (which could differ due to variable channel widths among the sites) for reporting distributions.
Anthropogenic microscale debris characterization
To assess anthropogenic microparticles (i.e., microplastics and microfibers of semisynthetic or modified natural compositions) across the Deer Creek watershed, water and sediment samples were taken at baseflow conditions (i.e., >3 days since the last precipitation event) from the 10 sampling sites (Table 1; Fig. 1; Supplementary Table S2). The anthropogenic microparticle samples were collected prior to the macrolitter survey to ensure that extracting the large litter did not affect our microparticle measurements. Water samples (∼2 L) were obtained in amber glass bottles that had been triple rinsed with filtered deionized water in the laboratory and were triple rinsed with site water in the field prior to sample collection. Streambed sediment samples (∼1 kg) were collected using a custom Hess sampler with a 74–80 µm mesh into ∼1 L glass mason jars that had been triple rinsed with filtered deionized water in the laboratory. In detail, the sediment sampling consisted of (1) placing the Hess sampler on the selected sampling site, (2) removing any armoring rocks from the sampling area within the Hess sampler that would be too large to fit into the sampling jar and then rinsing their surfaces into the Hess sampler to obtain any anthropogenic microparticles on their surfaces, (3) using a metal trowel to scoop the top ∼2.5 cm of sediment into the sample jar, and (4) rinsing any sediment suspended by the collection process that had been captured by the Hess sampler’s net into the sample jar. This method allowed us to collect both the upper layer of the channel bed sediment and any bed sediment that was suspended into the water column during the sampling process. Based on the custom mesh size and microscope power, we set our lower size limit for quantifying microparticles to 100 µm.
To characterize the anthropogenic microparticles, the water samples were vacuum filtered, while ∼250 g subsets of the sediment samples were dried, density separated with a sodium chloride (NaCl) solution, and the supernatant vacuum filtered (see Hasenmueller et al., 2023, for more details on the separation process). The microparticles on the resulting filters were photographed and characterized by their morphology, size, and color. Microparticles were considered anthropogenic if they were dyed with a color that was clearly humanmade (e.g., colors other than black, brown, or clear) or if they met other common criteria for the identification of microplastics (e.g., no organic structures, no tapering of fibers, and resistance to breakage; Hasenmueller et al., 2023). These criteria are intended to isolate microplastics but can also include semisynthetic or treated natural compositions. We did not further subclassify the anthropogenic microparticles by material type (i.e., synthetic, semisynthetic, or modified natural compositions) and therefore refer to them as “anthropogenic microparticles” throughout the results. While we are unable to comment on the harms of specific material types, we discuss the adverse effects caused by synthetic, semisynthetic, and treated natural anthropogenic microparticles (Athey and Erdle, 2022).
Quality assurance and quality control measures for anthropogenic microscale debris characterization
To account for any intrasite variability, assessed sediment samples were a homogenization of subsamples taken at three sampling points spread evenly across each site’s entire channel width (e.g., for a 12 m channel width, subsamples would be taken at 3 m, 6 m, and 9 m across the channel; see Supplementary Table S2). Similarly, we took replicate samples for both water and sediment at Site B. We present these replicate data as a possible indication of how variable water and sediment replicates might be at a single site and time. We acknowledge, however, that the other sites across the watershed may have higher or lower variability than what replication at a single site can encompass. The replicate sample results for Site B are presented in Supplementary Fig. S2. These data were not averaged with the microparticle amounts in the original samples for the site.
To reduce contamination throughout the microparticle sample processing steps, we filtered under a fume hood, prefiltered all working solutions, triple rinsed surfaces and glassware with filtered deionized water prior to their use, and wore 100% bright green, cotton attire. Field and laboratory processing blanks were obtained to calculate our method’s limit of detection (LOD) and limit of quantification (LOQ) values. Field water blanks consisted of pouring filtered deionized water into a precleaned amber glass bottle at a mid-watershed field site (i.e., Site G or Site H; see Fig. 1 and Supplementary Table S3). Sediment processing blanks were obtained by putting a similar volume (∼300 mL) of filtered NaCl solution through the same laboratory treatment as the sediment samples obtained from the field.
One field blank was taken on the day of sample collection. However, to calculate LOD and LOQ values for the water samples, consecutive field blanks from the prior 3 months of our research group’s sampling efforts were also used (n = 4; Supplementary Table S3). Two sediment blanks were processed on the same day as collected samples for this project. Additional blanks from other sediment microparticle assessment efforts in our research group were used from a year of sample processing (n = 6; Supplementary Table S3).
The LOD was defined as the mean of the blank values plus three standard deviations, while the LOQ was defined as the mean of the blank values plus 10 standard deviations (Dawson et al., 2023). These calculations were performed for the total microparticle amounts found in blanks and then were subsequently divided by the average masses of the water or sediment samples to normalize count-based LOD and LOQ values to counts per mass-based LOD and LOQ values. Our calculations are detailed in Supplementary Table S3.
Geochemical data
Other water quality data, including specific conductivity (measured in situ with a YSI Professional Plus Multiparameter Instrument) and total suspended solids [TSS; analyzed ex situ from water samples following United States Environmental Protection Agency (USEPA) Method 160.2; USEPA, 1971], were also acquired at each site to compare with the microparticle debris content. The geochemical data, along with other sampling details (such as the channel widths and depths that were used to normalize the macrolitter abundances), are summarized in Supplementary Table S2.
Data analysis
The ISA percentage for each subwatershed draining to a given sample site was calculated using the methods of Lockmiller et al. (2019) and data from National Land Cover Database (NLCD, 2021) and Dewitz (2023). Statistical relationships among the data were tested using nonparametric Spearman’s rank correlations (with α = 0.05). The sample size was limited to n = 10 when summarizing data across sites, preventing the assumption of normality, and a Shapiro–Wilk test showed a mix of normal and non-normal distributions for the different parameters of interest. All statistical analyses were performed in R. Figures were created using ArcGIS Pro Version 3.0.3, Microsoft Excel, and R.
Results
Anthropogenic macroscale debris distribution and characteristics
A total of 133 nonconstruction macrolitter items were found across the sampling sites (Supplementary Table S4), with plastics as the most common category (36.8%), followed by glass (27.8%), metal (14.3%), ceramic (10.5%), textile (4.5%), rubber (4.5%), and wood (1.5%) items. The highest quantities and varieties of debris were found at sites near the stream’s outlet, while debris abundance and diversity were lowest at sites near the middle of the watershed (Fig. 2A; Supplementary Table S4). While construction debris (n = 111) quantities were similarly low in the middle of the watershed compared with the outlet and headwaters, the highest overall amounts (i.e., a large quantity of clay pipe pieces) were found at the farthest upstream site (Site J) rather than near the outlet like the other debris (Supplementary Table S4). Plastic debris abundances were lowest in the center of the watershed, with two sites (Site F and Site G) featuring no plastics (Fig. 2; Supplementary Table S4 and Supplementary Table S5). Plastic debris increased in amount and variety at downstream sites (Fig. 2B; Supplementary Table S5). Plastic films (especially bags) were the most common item (34.7%), followed by food packaging (20.4%), hard plastic items (18.4%), other plastics (10.2%), PPE (6.1%), tarps (6.1%), bottles (2.0%), and cigarette butts (2.0%).

Debris weight and size (i.e., the length along the items’ longest axes) averages for each site were typically higher at the locations that had more debris overall. However, these data patterns were impacted by the type of litter that was found, with denser items (e.g., metal, wood) having higher weight–length ratios compared with lightweight glass or plastic. Glass had the lowest average weight as a category (12.28 g), followed by textiles (28.60 g) and then plastics (41.32 g). Plastic bottles were the heaviest category of plastics that we found, usually because they accumulated sediment that we did not extract before weighing the items. Glass and ceramic items (which were typically found as shards) had the lowest average lengths (4.41 cm and 7.04 cm, respectively), followed by plastics (23.40 cm).
Anthropogenic microscale debris distribution and characteristics
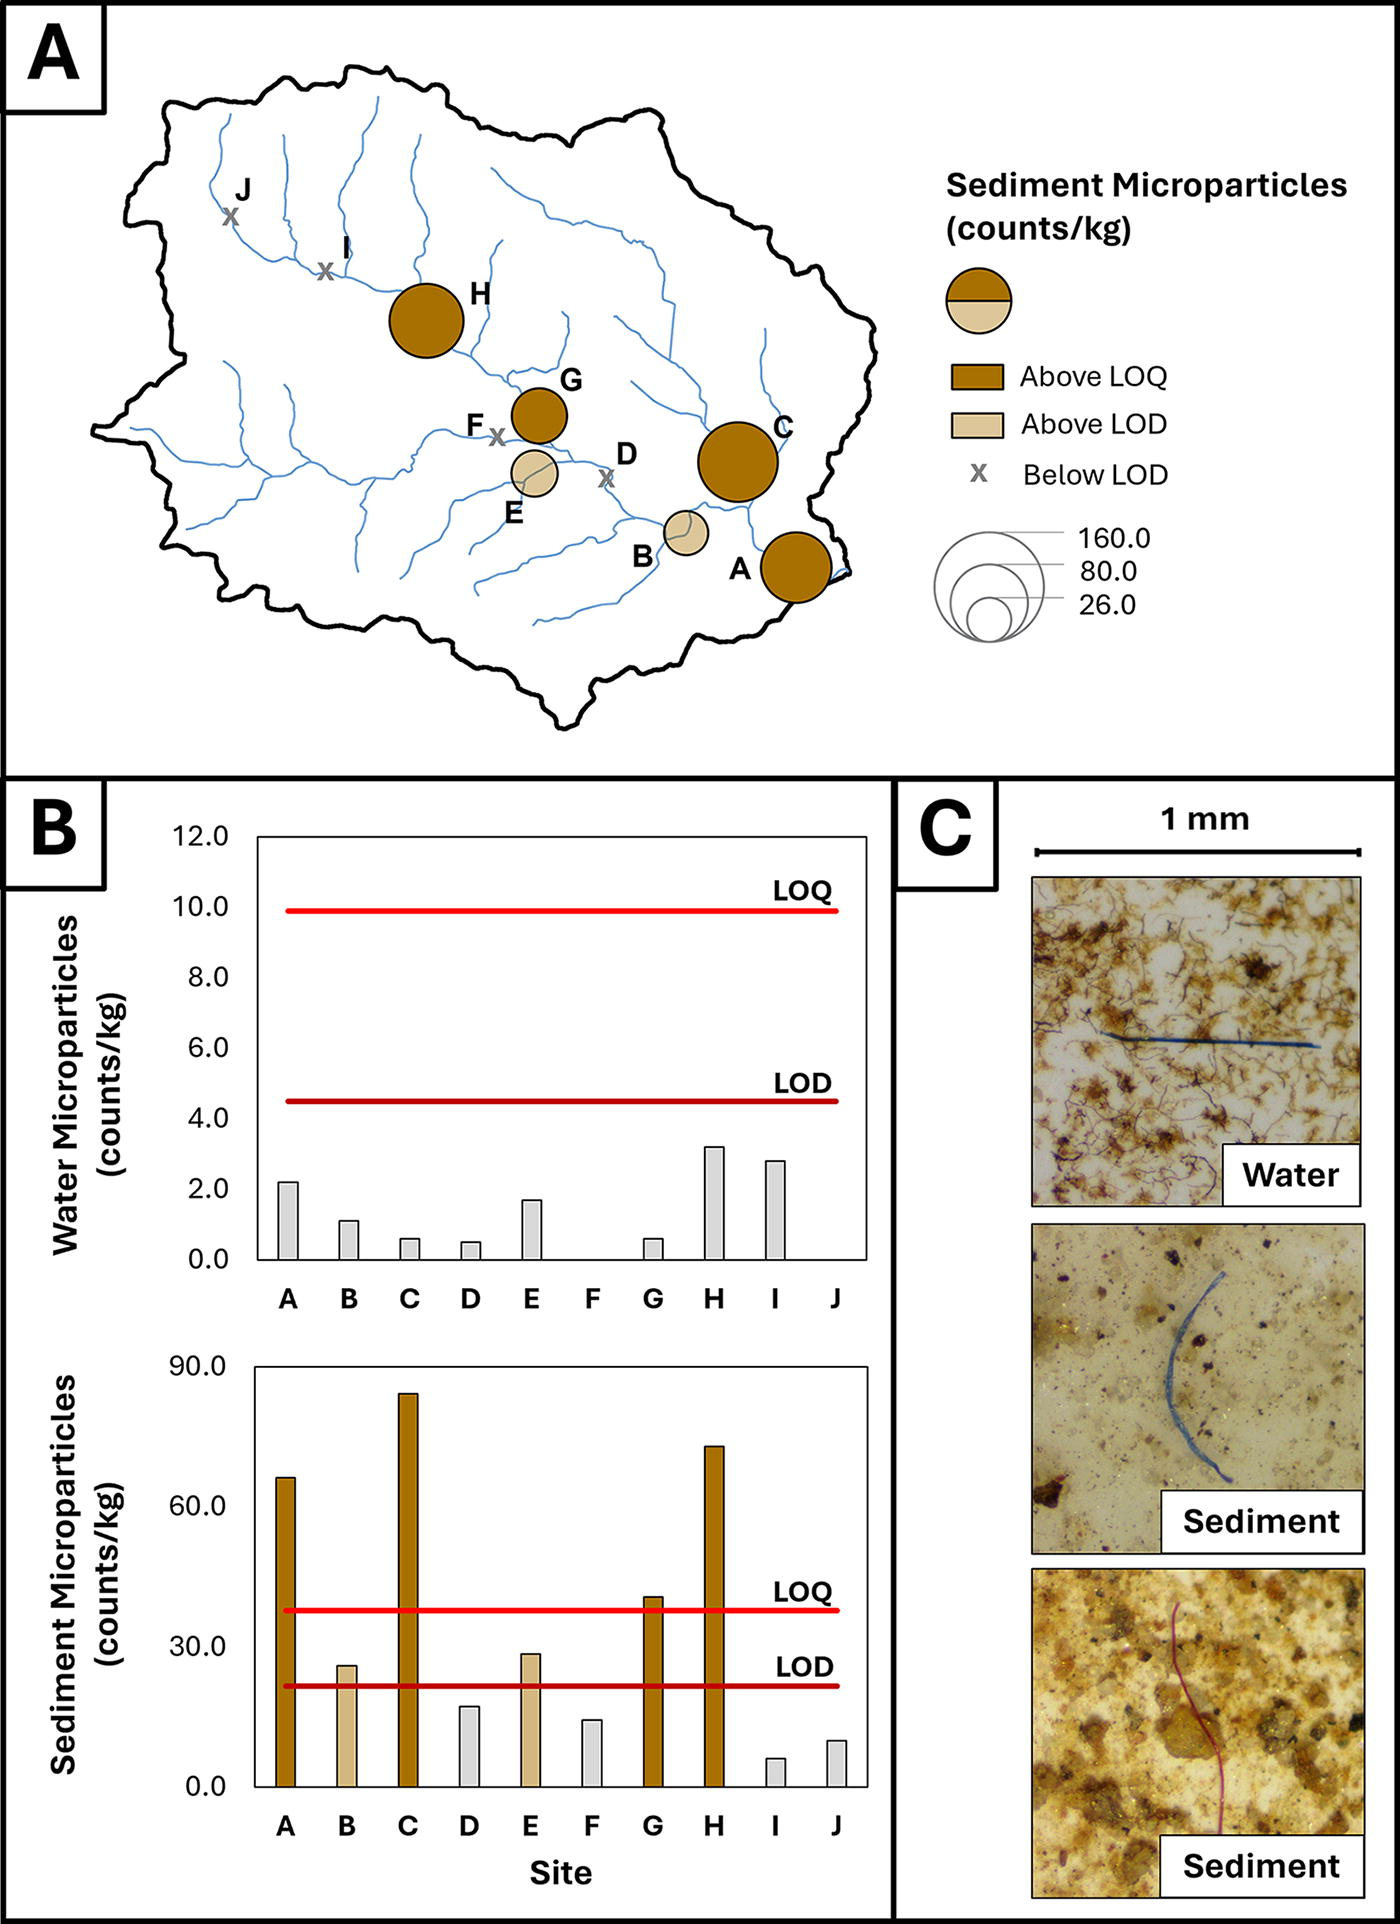
A total of 105 microparticles were identified as suspected anthropogenic debris in our water and sediment samples. However, microparticle levels were respectively detectable (i.e., above background) and quantifiable in 60% and 40% of the sediment samples. Thus, a total of 57 microparticles were quantified in our sediment samples, and the maximum concentration detected was 84.28 counts/kg (Fig. 3; Supplementary Table S6). Microparticle quantities in sediment were highest at Site A, Site C, and Site H, exhibiting no clear spatial trend (Fig. 3). Most of the microparticles in sediment were fibers (91.5%) and clear (52.1%) or blue (28.2%; Supplementary Table S6). Fragments and films were uncommon but found in sediment at Site A, Site C, Site E, and Site H (Supplementary Table S6, Supplementary Fig. S3). Detectable microparticles in sediment had an average size of 1258.88 µm (range = 126.56–4119.75 µm). No sites contained anthropogenic microparticles above the LOD in water (Fig. 3B; Supplementary Table S7).
Correlations among macroscale debris, microscale debris, and predictor variables
We tested the relationships among macrolitter, detectable sediment microparticles, and predictor variables to assess potential controls on anthropogenic debris patterns across the Deer Creek basin. Macroscale litter had no relationship with microparticle debris in sediment across the watershed (Fig. 4A). Plastic macrolitter correlated significantly and positively with total macroscale debris amounts and ISA, and both plastic and total macrolitter correlated significantly and negatively with TSS (Fig. 4A). However, TSS values were generally low across the watershed at baseflow conditions (Supplementary Table S2). Microparticle amounts in the sediment did not correlate with expected predictor variables (e.g., macrolitter abundance, macroplastic amounts, ISA, or TSS).

Correlations between macroscale and microscale debris and
The subset of six sites with USGS discharge gauges (which includes locations at Deer Creek’s outlet and major tributaries but excludes its headwater sites; see Table 1 and Fig. 1) were examined to understand the effect of site hydrology on debris distributions. Significant and positive correlations were present between all discharge variables and plastic macrolitter (Fig. 4B). In contrast to our findings for all sites, we observed that counts of total macrolitter and counts of microparticles in sediment were significantly and positively correlated for the sites gauged for discharge (Fig. 4B).
Discussion
Anthropogenic macroscale debris comparisons to prior studies
Our debris totals cannot be easily compared with prior riverine debris studies due to variations in reported units because of methodological differences (e.g., gram/inhabitants/day in Lahens et al., 2018, items/hour in Castro-Jiménez et al., 2019, and items/cubic meter in He et al., 2024). Even among studies with comparable units, data are sometimes reported only for plastics, for multiple litter types but without outlining the plastic totals, or only in a range or mean format (see examples in Supplementary Table S8). The quantities of macrolitter found in the Deer Creek watershed (range = 0.03–1.42 counts/m2 and average = 0.49 counts/m2) were lower than riverine studies for the Erzen River in Albania (range = 0.6425–4.203 counts/m2 and average = 2.423 counts/m2; Gjyli et al., 2022) and the Manahoz Stream in Turkey (range = 0.93–2.18 counts/m2; Erüz et al., 2023) but higher than the Saigon River in Vietnam (range = 0.06–0.21 counts/m2; Nguyen and Bui, 2023) and the Chicago River in the United States (averages of ∼0.08 counts/m2 and ∼0.09 counts/m2 for two sites; Hoellein et al., 2014; Supplementary Table S8). The amounts of plastic macrodebris at our study watershed (range = 0.00–0.61 counts/m2 and average = 0.19 counts/m2) were lower than a study of macroplastic litter in the Odaw River in Ghana (range = 1.5–32.4 counts/m2; Pinto et al., 2024) but were again higher, on average, than plastic macrodebris found in the Chicago River (averages of ∼0.02 counts/m2 and ∼0.04 counts/m2 for two sites; Hoellein et al., 2014; Supplementary Table S8).
The debris compositions observed in most prior studies (i.e., Supplementary Table S8) included much higher percentages of plastics (typically >50% of the total) than what we observed in the Deer Creek watershed, possibly indicating differences in waste management or retained litter types across watersheds. Our macrodebris composition (which included mostly plastic at 36.8% and glass at 27.8% of all materials) fell between a riparian zone sampling site (with 53% plastics and 16% glass) and a benthic sampling site (with 53% glass and 18% plastics) in the Chicago River study (Hoellein et al., 2014), which may have the most similar sourcing of all the sites listed in Supplementary Table S8. Variations in debris composition could also stem from the comparably low flow of our selected site relative to the larger rivers studied in other macrolitter surveys. Specifically, a mix of benthic and riparian debris deposition could result from the low flow settings of smaller streams compared with the mostly floating debris found in large rivers. Additionally, other river studies identified foam fragments as the predominant plastic type (Gjyli et al, 2022; Nguyen and Bui, 2023) rather than plastic films (i.e., bags) like we observed across the Deer Creek basin. The prevalence of plastic films at our studied watershed might indicate enhanced macrodebris sourcing from urban runoff, which has been found to contain high levels of plastic bags (∼50% of the macroscale litter; Treilles et al., 2021).
Anthropogenic microscale debris comparisons to prior studies
The microparticle amounts in sediment for our studied catchment (range = <LOD–84.28 counts/kg, average = 31.88 counts/kg; Supplementary Table S6) overlap with the rather large range found in prior studies of river sediment (range = 0.3–8.3 counts/kg; Baraza et al., 2022) and cave stream sediment deposits from floods (average = 842.7 counts/kg; Hasenmueller et al., 2023) for sites in the St. Louis, MO, region. Water microparticles (which were always below the LOD; Supplementary Table S7) were lower than the amounts found in local cave stream water (average = 9.2 counts/kg; Baraza and Hasenmueller, 2023) and in Mississippi River water near St. Louis (average = 1.5 counts/kg; Rochman et al., 2022). Deer Creek microparticle levels were also similar to those found in other small streams outside of the study region (e.g., maximum = 80 counts/kg in sediment and maximum = 0.303 counts/kg in water for New Zealand streams; see Dikareva and Simon, 2019, and average = 166.8 counts/kg in sediment and average = 0.705 counts/kg in water in an urban South African stream; see Dahms et al., 2020). These similarities suggest that the microparticle quantities within small watersheds may relate less to the specific study area (i.e., the St. Louis region for our examination) and more to the fundamentally different hydrologic dynamics of small surface water streams compared with larger rivers or groundwater-fed cave streams.
Similar to our results, the prevalence of microfibers, including synthetic, semisynthetic, and natural compositions, has been observed in other freshwater systems (Lahens et al., 2018; Stanton et al., 2019). Sourcing of these microfibers to streams may be driven by atmospheric deposition, as microfibers are commonly found in atmospheric samples near urban areas (Dris et al., 2016; Stanton et al., 2019). Microfibers can also be prevalent in urban runoff (i.e., 68–87% of all microparticles as observed in Piñon-Colin et al., 2020), which could be a common source with macroscale plastics (i.e., plastic bags can be ∼50% of runoff debris as noted by Treilles et al., 2021). However, some studies find other microplastic morphologies to be more common in runoff (e.g., fragments observed by Cho et al., 2023, and films in residential area runoff observed by Sun et al., 2023). Microparticle quantity and diversity could also be enhanced in the benthic sediment compared with the water column due to their accumulation in sediment through hyporheic exchange processes (Drummond et al., 2022).
While other St. Louis area stream or small river studies had comparable microparticle morphological assemblages to our result of >90% fibers for the Deer Creek watershed (i.e., 80% fiber content found by Baraza et al., 2022, 86% fiber content found by Baraza and Hasenmueller, 2023, and 91% fiber content found by Hasenmueller et al., 2023), studies from other regions found fewer fibers in stream samples (i.e., 20–30% fiber content found by Dikareva and Simon, 2019, and 76% fiber content found by Dahms et al., 2020). A nearby study of the larger Mississippi River found 44% fibers or fiber bundles in the river’s water column, but 81% fiber content in wastewater treatment plant (WWTP) effluent (Rochman et al., 2022). High fiber abundances within local WWTP effluent might suggest wastewater as a potential source of microfibers to the region’s hydrologic systems. Overall, microparticle morphological assemblages might be region specific even though their total quantities might be comparably distributed across analogous freshwater environments.
While we did not distinguish what proportion of the microparticles found in our samples were plastics versus other material types (i.e., semisynthetic or treated natural compositions), we can look to local studies to approximate what fraction of different material categories might be expected in the samples from the Deer Creek watershed. Nearby studies of a cave stream system found that water microparticles were 1% plastics, 58% treated cellulose, and 41% unknown cellulose, whereas sediment microparticles were 29% plastics, 31% treated cellulose, 36% unknown cellulose, and 4% natural material (Hasenmueller et al., 2023). In Mississippi River water, 20% of microparticles were plastics, 17% were anthropogenic nonplastics, and 64% were unknown nonplastics (Rochman et al., 2022). Based on these prior studies, we might expect that ∼20–30% of our observed sediment microparticles could be microplastics.
Drivers of macroscale and microscale anthropogenic debris distributions
Across all our sites in the selected watershed, we found that neither macrolitter nor macroplastic prevalence can be used as an indicator for areas of higher microparticle levels in sediment (Fig. 4A). While we did note a significant and positive relationship between all macroscale debris and microscale debris in sediment in our subset of sites gauged for discharge (Fig. 4B), this smaller dataset eliminated data from upstream sites (Table 1; Fig. 1). Thus, the subset of data at the discharge gauge sites simplifies the spatial distributions to reflect increasing debris abundances from the middle of the watershed to its outlet (Figs. 2 and 3). The positive correlation between macroscale and microscale litter at the sites gauged for discharge implies the potential for similar sourcing mechanisms, at least toward the basin’s outlet. However, with such a low sample density (i.e., n = 6), these trends may not be reliable.
Although few studies have compared macroscale and microscale anthropogenic debris (including plastics), some have found correlations between the two size classes (He et al., 2024). The relationship between larger debris and microparticles thus needs further examination as it could differ based on the size of the catchment of interest or the types of debris present. Inconsistencies between the dominant microparticle types (i.e., microfibers that are likely from textile sources) and the most prevalent macroscale plastics (i.e., plastic films rather than textiles) provide further evidence that these microparticles have distinct sourcing mechanisms and are thus probably not the result of macroscale litter breakdown in the watershed. While these size classes of anthropogenic litter may have unique initial sources, they might share some common transport origins (e.g., microfibers and plastic bags are both prevalent in urban runoff; Piñon-Colin et al., 2020; Treilles et al., 2021). Where common sources of the different size classes of plastic pollution exist (e.g., microfibers and plastic bags similarly derived from stormwater runoff), joint solutions such as improved filtration for stormwater could be implemented to reduce pollution at both scales simultaneously.
While our study focuses on anthropogenic microparticles that may be of varying material compositions, prior microplastic-specific studies have suggested that small watersheds may have local factors such as waste dumping or variations in sourcing (e.g., fluctuating microplastic levels in WWTP or stormwater effluents) that drive waterbody microparticle distributions more than large-scale factors such as watershed land use (Dikareva & Simon, 2019; Rochman et al., 2022). Deer Creek’s widespread microfibers might be sourced from atmospheric conditions or legacy wastewater inputs from historical combined sewer overflows, which are both sources that mostly feature microfiber morphologies (e.g., 56–86% of the total microparticles in sewer runoff, sewer sediment, and overflow effluents are fibers, Zhou et al., 2023; and 81% of microplastics in local WWTP effluent are fibers; Rochman et al., 2022). Such large-scale (e.g., the atmosphere) or legacy (e.g., the influence of a removed combined sewer network) sources are challenging to assess through sampling. Nevertheless, they may contribute to the heterogeneity of microparticles across the watershed and explain the seemingly unclear drivers for their spatial distribution across our study site.
Conclusions
Our research demonstrated that macroscale and microscale anthropogenic litter is heterogeneously present across an urban watershed (Deer Creek near St. Louis, MO). Microparticle distribution and characteristics suggest that their sourcing might be unique compared with macroscale litter, with microparticles potentially originating from atmospheric or legacy sewer overflow inputs. The spatial distribution of macroscale plastic debris is possibly driven by both hydrologic conditions (i.e., discharge) and land use (i.e., imperviousness) as evidenced by significant and positive correlations between plastic macrolitter and these predictor variables. Since all macroscale debris across the watershed correlates well with large plastic debris, general debris distribution patterns (such as what is reported in local stream cleanups) could have utility for predicting plastic waste distributions in other watersheds.
None of the predictor variables we assessed explained the microparticle distribution across all the selected sites in the watershed, suggesting that unknown local factors likely drive microparticle dispersal and variability across the watershed (e.g., legacy inputs). Since other research has found correlations between macroplastics and microplastics, which contrasts with our findings, future studies should continue to compare these debris size ranges at other locations to further assess how catchment scale, hydrology, and localized or unique debris sourcing dynamics might influence their relationship. Continued research addressing the varying sizes of plastic pollution is valuable, as both macroscale and microscale debris in the environment can have harmful impacts to ecological and human communities.
Footnotes
Acknowledgments
The authors thank Dr. Teresa Baraza Piazuelo, Carly Finegan, and Julia Theisen for their assistance during field sampling and laboratory analyses and all laboratory assistants who helped with debris characterization. They also appreciate James Faupel’s help with coordinating field sampling for Deer Creek at the Litzsinger Road Ecology Center. The authors are grateful for the input provided by two anonymous reviewers, whose thoughtful comments helped improve the manuscript.
Authors’ Contributions
N.F.H.: Conceptualization, methodology, validation, formal analysis, investigation, data curation, writing—original draft, visualization, and funding acquisition. E.A.H.: Conceptualization, methodology, resources, writing—reviewing and editing, supervision, project administration, and funding acquisition.
Data Availability Statement
The datasets analyzed during this study are available from the corresponding author upon request.
Author Disclosure Statement
No competing financial interests exist.
Funding Statement
This work was supported by a USGS Water Resources Research Act Program grant, administered through the Missouri Water Center (Award:
References
Supplementary Material
Please find the following supplemental material available below.
For Open Access articles published under a Creative Commons License, all supplemental material carries the same license as the article it is associated with.
For non-Open Access articles published, all supplemental material carries a non-exclusive license, and permission requests for re-use of supplemental material or any part of supplemental material shall be sent directly to the copyright owner as specified in the copyright notice associated with the article.