
Abstract
Plastics have been incorporated into everyday life due to their versatility, yet when microplastic particles enter natural fluvial systems, they pollute the surrounding environment and pose potential human health risks. As state and federal agencies develop regulations for microplastics in natural systems, it is important to properly assess potential sources of pollution and the concentration of microplastic particles in freshwater environments; however, microplastic pollution in small streams can be complex to investigate because of their dynamic hydrography and lack of standardization in microplastic sample collection and quantification. In this study, a unique low-cost sampling station was designed to collect microplastics from surface water in a shallow urban freshwater stream. The goal is to understand the variation in microplastic concentrations across a watershed at baseflow. Surface water samples were collected and analyzed from five sites along Hunnicutt Creek, a suburban freshwater stream located in Clemson, SC. The sampling station was deployed in the upper water column long enough to allow 10 m3 of surface water through a sampling net. Seven sampling events occurred at five sampling sites across the Hunnicutt Creek watershed. Surface water samples indicate that the microplastic abundance increased from the top of the watershed (269 ± 30 particles/10 m3) to the bottom of the watershed (715 ± 93 particles/10 m3). Fibers were the dominant morphology identified in the system, which accounted for 99.7% of the microplastic particles sampled. There was a significant difference in the microplastic concentrations between sampling sites moving down the watershed (F = 53.27, df = 4, p < 0.001), with the highest concentrations at the bottom of the watershed (or at the confluence of the tributaries). This work contributes to the understanding of how microplastics move at low-flow/baseflow conditions in small freshwater streams, which are common throughout global communities.
Introduction
Microplastics represent an important and increasingly present contaminant impacting both natural environments and municipal water systems. Increasing in frequency since the widespread use of plastics began in the mid-20th century, these pollutants have been identified in nearly all natural environments (summaries of microplastic occurrence in the literature can be found in review articles by Akdogan and Guven, 2019; Anderson et al., 2016; Auta et al., 2017; Thompson, 2015; and Yu et al., 2020) and are an important consideration in the function of wastewater treatment plants and the microplastics they release (Murphy et al., 2016; Sun et al., 2019). Research on the full effects of microplastics on human health is still ongoing (Braun et al., 2021; Marfella et al., 2024); however, microplastics have been identified in the blood and internal organs of human patients (Enyoh et al., 2023; Leonard et al., 2024). Possibly because the impact of these contaminants on the human body is largely unknown, the Environmental Protection Agency, the body responsible for federal regulations for drinking water in the United States, has not yet taken action to set primary drinking water standards for microplastics. Of the three criteria used to determine the regulation of drinking water, the presence of microplastics in small urban streams is most closely tied to the likelihood of microplastics being detected in public water systems (Lasee et al., 2017; Liu et al., 2021). Surface water sources, such as streams, rivers, and reservoirs, can be important resources for drinking water; therefore, the microplastic concentration in these systems is of direct interest to those stakeholders looking to deliver drinking water to communities.
The measurement of microplastic parameters in aqueous systems has been characteristically difficult, especially within freshwater systems. A majority of microplastic studies quantifying distributions and concentrations are focused on marine settings (see Li et al., 2020 and references therein), perhaps driven by marine debris programs, beach clean-ups, and the attention on the great garbage patch in the Pacific Ocean. Fewer studies focus on microplastics in freshwater systems than in marine environments, even though these systems have a greater potential of introducing microplastics into human systems. Common sampling strategies within freshwater bodies are often derived from marine-focused sampling protocols, which may not always be appropriate for streams—especially those with minimal depth and discharge. As an example, manta trawlers are common in sampling the surface to mid-water column depths in both ocean and lake environments by towing behind a boat (Bikker et al., 2020; Kashiwabara et al., 2021; Tamminga et al., 2018); however, these samplers are too large and cumbersome to deploy in small streams. Even though common microplastic sampling techniques are difficult to translate to small streams, the need to understand surface water transport of microplastics in these environments remains critical. This study describes a unique low-cost sampling station designed to collect surface water in small streams. The study also describes a methodology for attempting to establish a baseline microplastic concentration of a small freshwater system in which the microplastic concentrations are unknown and to determine if the microplastic concentration varies throughout the watershed. Its effectiveness is demonstrated by sampling the surface water of small streams in a suburban watershed at base flow.
Methods
Geographic setting
The Hunnicutt Creek watershed is located in the northwestern corner of South Carolina, spanning the eastern half and southern border of the campus of Clemson University, in Clemson, SC. The total area of the Hunnicutt Creek watershed is 5,117,209.36 m2 (∼5 km2) and is located in the eastern portion of the Upper Seneca River watershed (HUC-12: 030601010803). Within this watershed lies a portion of the town of Clemson (2020 population = 17,681; census.gov) and Clemson University, a medium-sized university with a total student population of 28,747 (The Office of Institutional Research, Clemson University, 2023) that more than doubles the area population when the university is in session.
A Geographic Information Systems (GIS) map was made in ArcGIS Pro to better understand the Hunnicutt Creek watershed. To get an accurate representation of the Hunnicutt Creek watershed, stream data were aggregated for the Upstate of South Carolina from the National Hydrography Dataset and land use data from the National Land Cover Database. Figure 1 illustrates the Hunnicutt Creek watershed, sampling locations, and stream path map generated by GIS. A more iterative description of the process to make this map and the land use analysis can be found in Bowman (2023) and Supplementary Tables S1 and S2.

Sampling sites and determination of baseflow conditions
Hunnicutt Creek is a suburban freshwater stream that runs through the eastern and southern sides of Clemson University’s main campus with multiple tributaries off the main branch (Fig. 1). Its watershed contains several areas of anthropogenic influence, most notably the eastern portion of Clemson’s campus. In order to assess the microplastic concentrations throughout the Hunnicutt Creek watershed, it was important to sample different sections of the creek including sites downstream or at the confluence of two branches.
Five sampling sites were selected based on the following criteria: the sampling sites had to (1) be deep enough for the sample station to be deployed, (2) have consistent streamflow as some stretches dry up in drought periods, and (3) be representative of the branch or confluence the study is trying to sample in order to properly assess the microplastic concentration throughout Hunnicutt Creek. Site 1 was taken downstream towards the end of Hunnicutt Creek, with consecutive sites moving progressively upstream to avoid contamination and sediment disturbance from upstream sampling. All five sampling sites were sampled on the same day and considered a sampling event. Sampling events occurred until a normal distribution of microplastic concentrations was reached at each perspective sampling site. Normative distribution was tested by a Shapiro–Wilk test, with all five sites having a significance value >0.05 before being normally distributed. Having microplastic concentrations being normally distributed at all five sampling sites indicates the data is symmetric around the mean and enough samples have been collected in order to gauge a baseline concentration for the perspective sampling sites. A total of seven sampling events occurred between March 2023 and May 2023.
To ensure none of the sampling events occurred during significantly different rainfall conditions, total precipitation from the 4 days prior to each sampling event was aggregated from the closest National Oceanic and Atmospheric Administration (NOAA) weather station (NOAA weather station USC00387687) to the Hunnicutt Creek watershed (Table 1). The mean 4-day precipitation value across all sites was 21.84 ± 36.32 mm. One sampling event, SE4, had a total precipitation of 100.58 mm, which is greater than two standard deviations of the mean precipitation [21.84 + 2 (36.32 mm) = 94.48] and was removed from analysis due to the likelihood it represented a precipitation event that altered base flow conditions of the stream.
Sampling Site Locations, Average Instantaneous Flow Velocity (Flow), and Deployment Time (Time) of Sampling Station
Mean 4-day pre-sampling precipitation = 21.75 (standard deviation = 33.52). SE4 (italicized) is an outlier in the dataset and not included in average microplastic concentration calculations.
SE, sampling event.
Net sampling
Sampling for microplastics in the surface waters of a small stream required the design of sampling instrumentation that could be deployed within a stream of minimal depth. The instrumentation also needed to be completely submerged in a continuously flowing stream section to determine the volume of water flowing through the sampling equipment in a given amount of time. The ways in which these considerations were addressed through sampling instrument design are described in detail below.
The nets selected for the project are Fieldmaster 12.7 cm diameter, 38.1 cm long nylon plankton nets with a mesh size of 80 μm (Fig. 2). The 12.7 cm net opening is surrounded by a stainless-steel ring with three smaller stainless-steel rings from which two lines converge on a swivel. The bottom of the net contains a dolphin adapter connected to a 125 mL bottle (Fig. 2). A total of five plankton nets, one for each sampling site, were used to reduce cross contamination between sites. The net was attached to a foam kickboard with two metal hooks to ensure the net remained at the stream surface and also completely submerged. This sampling strategy, in tandem with the determination of instantaneous flow velocity, allowed for the collection of a set volume of water for each sampling event at each location (described in more detail below in “Sampling Volume and Instantaneous Flow Calculations” section). To keep the kickboard and net floating in relative place instead of flowing downstream, a carabiner was attached to the end of the net tow lines and hooked to two fiberglass construction reflection rods. This sampling station was installed at each individual sampling site for each sampling event. Figure 2 shows the components of the sampling station and an image of the sampling station during sample recovery.

Net sampling design, highlighting each component in the field
Sampling volume and instantaneous flow calculations
Instantaneous flow velocity was measured using a Swoffer model 2100 flow meter before the sampling station was deployed at each sampling station for each sampling event. This instantaneous velocity was used to determine the deployment time of the sampling net so 10 m3 of surface water flowed through the net. While regulatory bodies have tried to harmonize freshwater collection methods (United Nations Environment Programme, 2021), there is still little to no consensus on the volume of water to be sampled from surface water, with anywhere from 1 L to 8 m3 reported in the literature (Liu et al., 2019; Prata et al., 2020; Tamminga et al., 2019). Often this volume is not measured at all and is simply reported as a towing time or distance (Malla-Pradhan et al., 2023; Pasquier et al., 2022). Since the amount of microplastics in the stream was unknown prior to this study, a larger volume than similar studies was chosen to ensure a representative sample of microplastics was being taken. The flow meter was calibrated to a low-flow system with shallow stream depth. Once calibrated, an average flow velocity was calculated using 10 instantaneous flowmeter measurements taken directly in front of where the net opening and sampling station were deployed and averaged. The average instantaneous flow velocities were used to determine sampling time using the volumetric flowrate equation (Table 1):
Sample processing
Once the sampling station was removed from the sampling sites, the bottle attached to the net was removed and capped, and the plankton net was folded in aluminum foil and placed in an aluminum tray with the bottle to transport back to the lab. A 63-micron stainless steel sieve was then placed in the laboratory sink and the sample water bottle was poured over the sieve and washed with ∼500 mL of laboratory water to ensure all the residual sediment was removed. This size was selected since microplastics smaller than 80 μm (the mesh size of the nylon net) are expected to pass through the net in situ and not be collected in the net. The net was then held vertically by the stainless-steel rings and washed onto the stainless-steel sieve. A squirt bottle was used to carefully rinse away any residual plastic material or sediment inside the net onto the sieve. When finished, the opening of each plankton net was covered with aluminum foil and hung up to dry.
Plastic abundance quantification
The dried sieves containing each sample were carefully brushed with a natural fiber paint brush to dislodge all material from the sieve surface onto a black 45-square picking tray. Microplastics were counted under a Leica S9D trinocular stereomicroscope square by square with forceps and a metal rod to sift through sediment present in the sample. Microplastic concentrations were reported in gross number of particles per 10 m3 of surface water. Counted particles were not removed due to their small size. Particles were categorized under the four main types of plastic morphology: fibers, fragments, films, and pellets. Because counting was done under a microscope by hand, microplastics were recorded under their morphological definitions, not by their chemical composition. Once the microplastic abundance was recorded, the picking tray contents were stored in a glass vial. A completed sampling event produced five vials, one vial for each sampling site.
Particle verification was conducted on a subset of fibers from five samples. Since the majority of microplastics were fibers, 20 fibers from each of the five samples for one sampling event (Sampling Event #7) were separated, placed in clean glass vials, and shipped to the Baruch Institute of Coastal Ecology and Forest Science with the blanks (described below in “Quality Assurance and Quality Control” section). The fibers were suspended in 99% ethanol directly in the vials before processing on the Laser Direct Infrared (LDIR) as below. The chemical characteristics of the fibers were identified and matched with the provided spectral library (Microplastics 2.0, Agilent Technologies). All spectra were manually confirmed and had a high hit quality value related to the reference spectra >0.70 to account for the potential aging of microplastics that are likely to be found in the stream environment (Jia et al., 2022).
Descriptive statistics were calculated to understand the distribution of plastics found during each sampling event. An analysis of variance was performed to determine if there was a significant difference between the average in microplastic abundance between sampling sites using SPSS (SPSS, v.29.0, 23).
Quality assurance and quality control
To minimize potential cross contamination of plastic materials and microplastic particles, a series of quality assurance and quality control (QA/QC) measures were taken to use nonplastic products at all possible stages of sample retrieval and lab processing. When transporting samples, aluminum foil and trays were used to minimize plastic use and each aluminum tray was assigned a specific sampling site to avoid cross contamination between sites. The trays were washed and dried in between sampling events to ensure no contamination between sites. To reduce plastic contamination from clothing in the lab environment during sample processing, 100% cotton lab coats were worn that were stored in cotton garment bags when not in use. During the sample drying process, wet samples were covered with aluminum foil to prevent any cross contamination from the oven and laboratory air.
To determine if the nylon nets shed and introduce particles into the samples, three lab blanks were produced with 500 mL of water from the lab washed through the sampling nets. This water was collected by washing the 500 mL of water through the net and having the water collected in the plastic bottle at the bottom in a manner identical to the sample processing procedure. Once the bottle was full, it was then poured into a mason jar and sealed for transport. The blanks and microplastic fiber samples were sent to the Baruch Institute of Coastal Ecology and Forest Science for analysis on the Agilent 8700 LDIR Chemical Imaging system (Agilent Technologies). The blanks were filtered onto 400 mesh (37 μm) stainless steel filters and sonicated in 99% filtered ethanol for 10 min. The solution was transferred to 20 mL glass scintillation vials until processed on the LDIR (Jia et al., 2022). The blanks were put onto a low-e microscope slide (Kevley Technologies, Chesterland, USA) using a glass pipette. Since >99% of the particles in Honeycutt Creek were fibers, only fibers were analyzed. All visible fibers were selected and scanned with the Agilent Clarity software (version 1.6.83). The chemical characteristics of the fibers were identified and matched with the provided spectral library (Microplastics 2.0, Agilent Technologies) (Jia et al., 2022). These blanks ensure that QA/QC was considered not only for the nylon net and the attached plastic bottle but also for the lab water that could also potentially be introducing microplastics into the samples. This series of QA/QC steps took meaningful measures to limit cross contamination and the unintended introduction of microplastic particles from sample collection to sample analysis.
Results
Determination of baseflow conditions
The precipitation data obtained from the NOAA station show the rainfall pattern in the Clemson area during the study (Fig. 3). These data provide insight into the hydrologic conditions of Hunnicutt Creek leading up to each sampling event. The above-average precipitation event prior to SE4 (Fig. 3) indicated stream flow was above base flow. Smaller spikes in precipitation were also recorded in advance of SE6; however, outlier testing did not identify it to be above base flow. While baseflow conditions in a small fluvial system are complex, this study captured microplastic concentrations at a consistent low-flow regime for six of the seven sampling events used in the analysis. Future work could consider parameters such as seasonality, storm runoff, and other effects of higher flow velocity on microplastic transport (Talbot and Chang, 2022), especially if the system is known to have prolonged reactions to heavy precipitation events such as Hunnicutt Creek (Bowman, 2023).
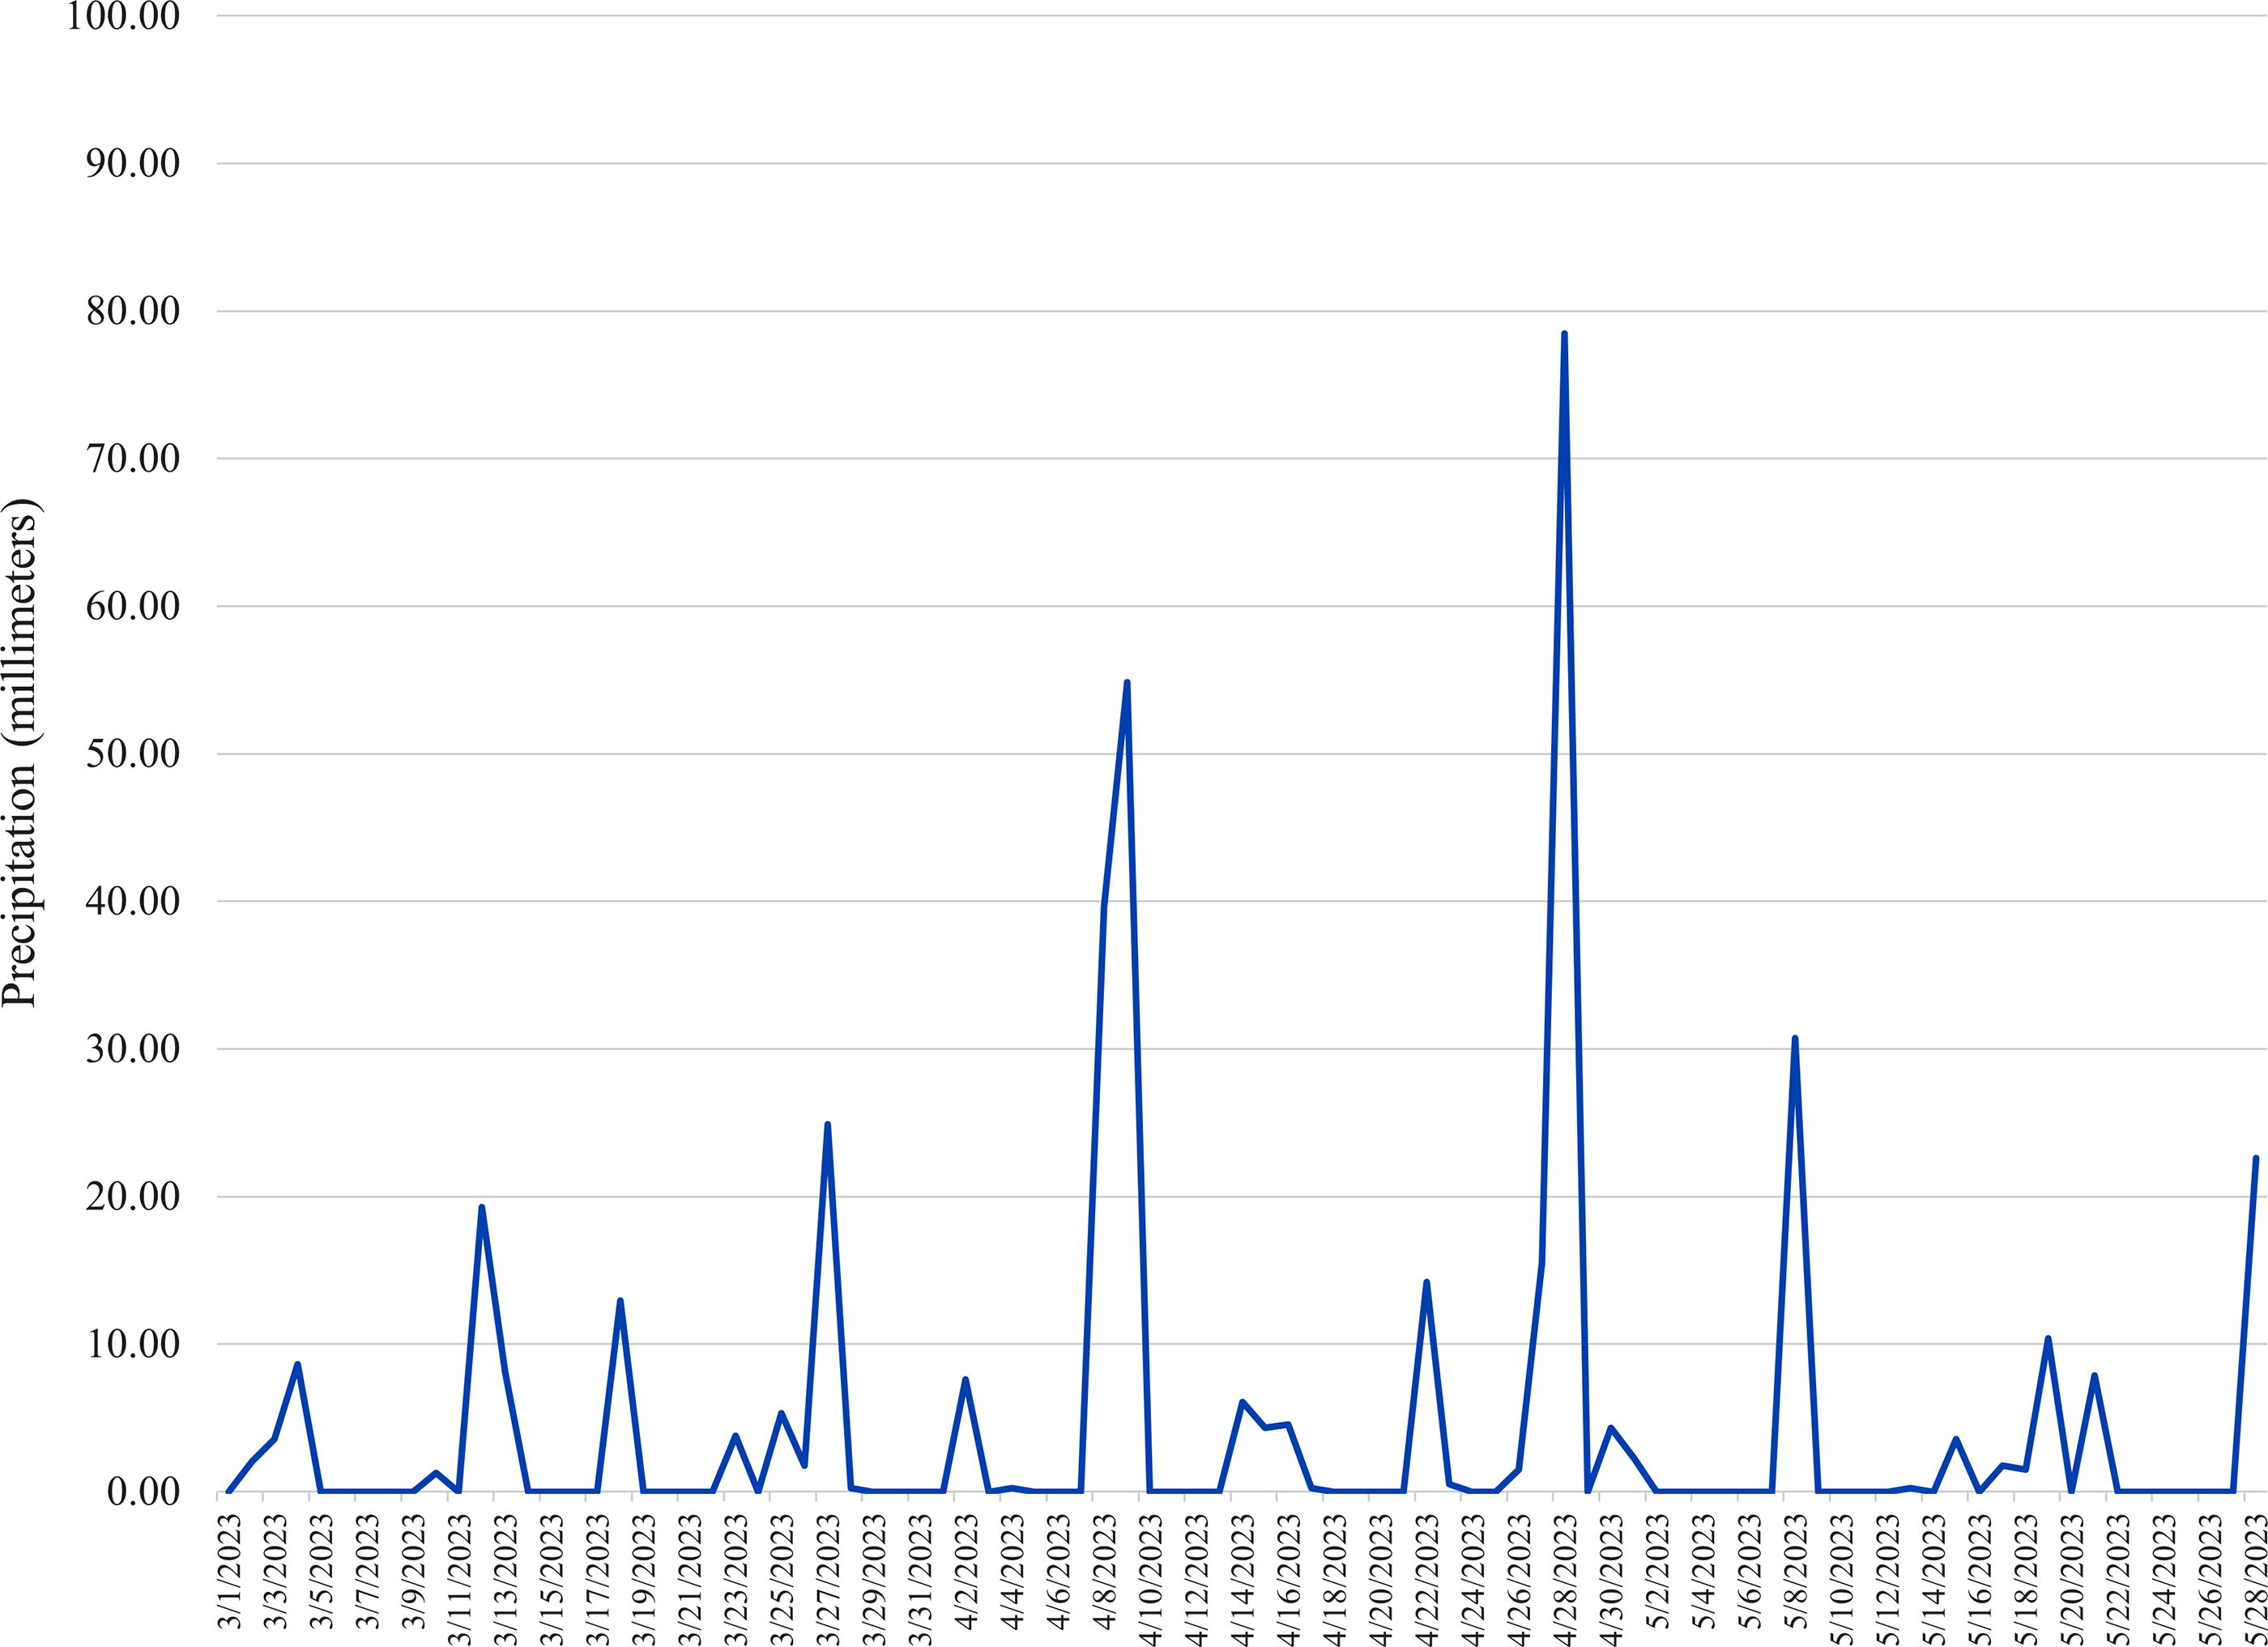
Precipitation data obtained from NOAA weather station USC00387687 for the range of the study. Sampling event dates are highlighted by the black arrows.
Microplastic concentrations
Microplastic concentrations from each of the seven sampling events at each sampling site were averaged to determine site-specific microplastic concentrations (Table 2), reported in gross number of particles (>80 μm) per 10 m3 of surface water.
Microplastic Concentrations (Gross Particles per 10 m3 of Water) for Each Sampling Event at Each Sampling Site
SE4 (italicized) was not included in the mean/standard deviation for each sampling site as it was determined to be an outlier.
Site-specific microplastic concentrations were different between sites across the watershed (F = 53.27, df = 4, p < 0.001; Fig. 4), with Site 5 having the lowest concentration of microplastics (269 ± 30 particles/10 m3) and Site 1 the highest (715 ± 93 particles/10 m3). To test the results, a Tukey post hoc analysis was run to test the significance of microplastic concentrations between sites. With the exception of Site 5, which is dissimilar from all sites, microplastic concentrations were generally similar to an adjacent site (e.g., Sites 1 and 2, p < 0.203) or a site in a similar part of the watershed (e.g., Sites 3 and 4, p < 0.978). While the sampling sites in the middle of the watershed do not have significantly different microplastic concentrations, microplastic concentrations overall increase significantly from upstream (Site 5) to downstream (Site 1) in the Hunnicutt Creek watershed (p < 0.001).
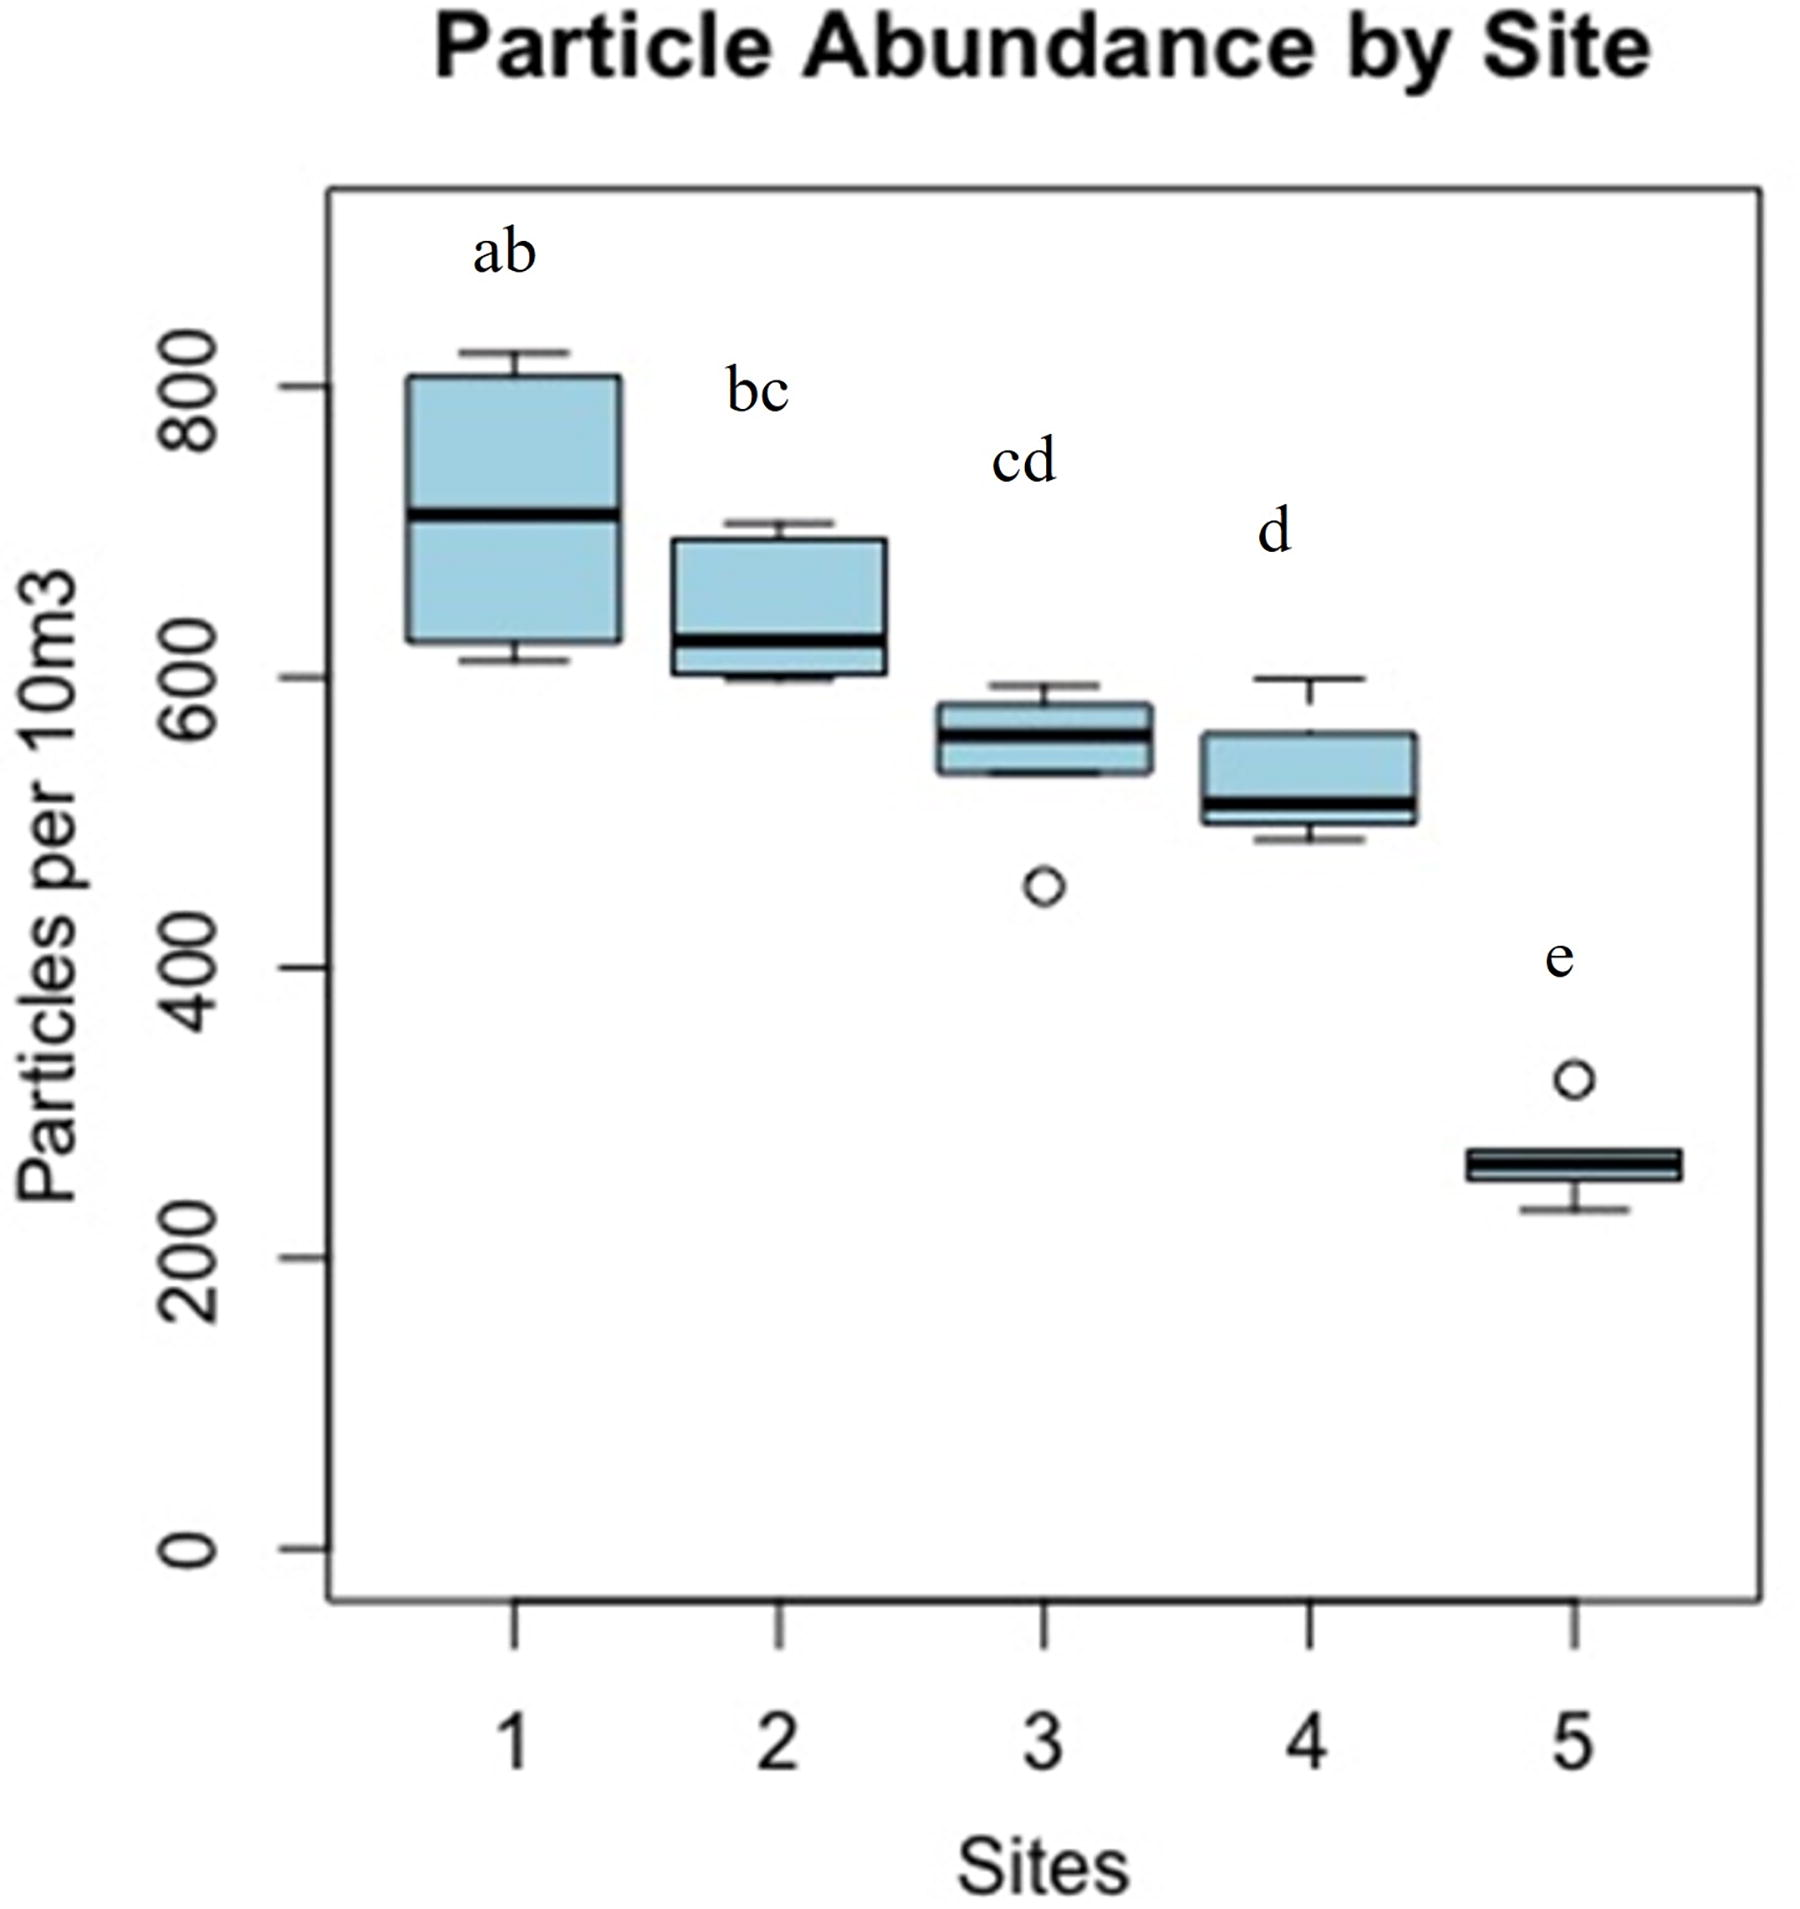
Box plot of the microplastic load for the six averaged sampling events at each sampling site in Hunnicutt Creek. The mean microplastic load is indicated by a thick black line on each box and circles indicate outliers. The lowercase letters above the boxes in the plot represent sites with the same microplastic load based on post hoc Tukey test.
While it was not a primary goal of this study to investigate the morphology of the collected microplastics, they were counted and categorized based on their physical descriptions. Of the 30 samples investigated, a total of 16,112 microplastic particles were counted. Of those particles, a total of 16,060 particles were classified as fibers, 49 as fragments, 3 as films, and 1 as a pellet. This indicates that fibers were the dominant morphology found in the surface water of Hunnicutt Creek during baseflow conditions, accounting for 99.7% of the microplastic particles counted. Figure 5 shows the microscope view of a sample on the picking tray, which displays the high amount of fibers (the white/translucent strings; Fig. 5A) compared with other microplastic morphologies; exemplar fibers are outlined in Figure 5B. These results are in line with other microplastic studies in surface freshwater system studies indicating that fibers are the dominant microplastic morphology collected in these environments (Lares et al., 2018; Wang et al., 2021).
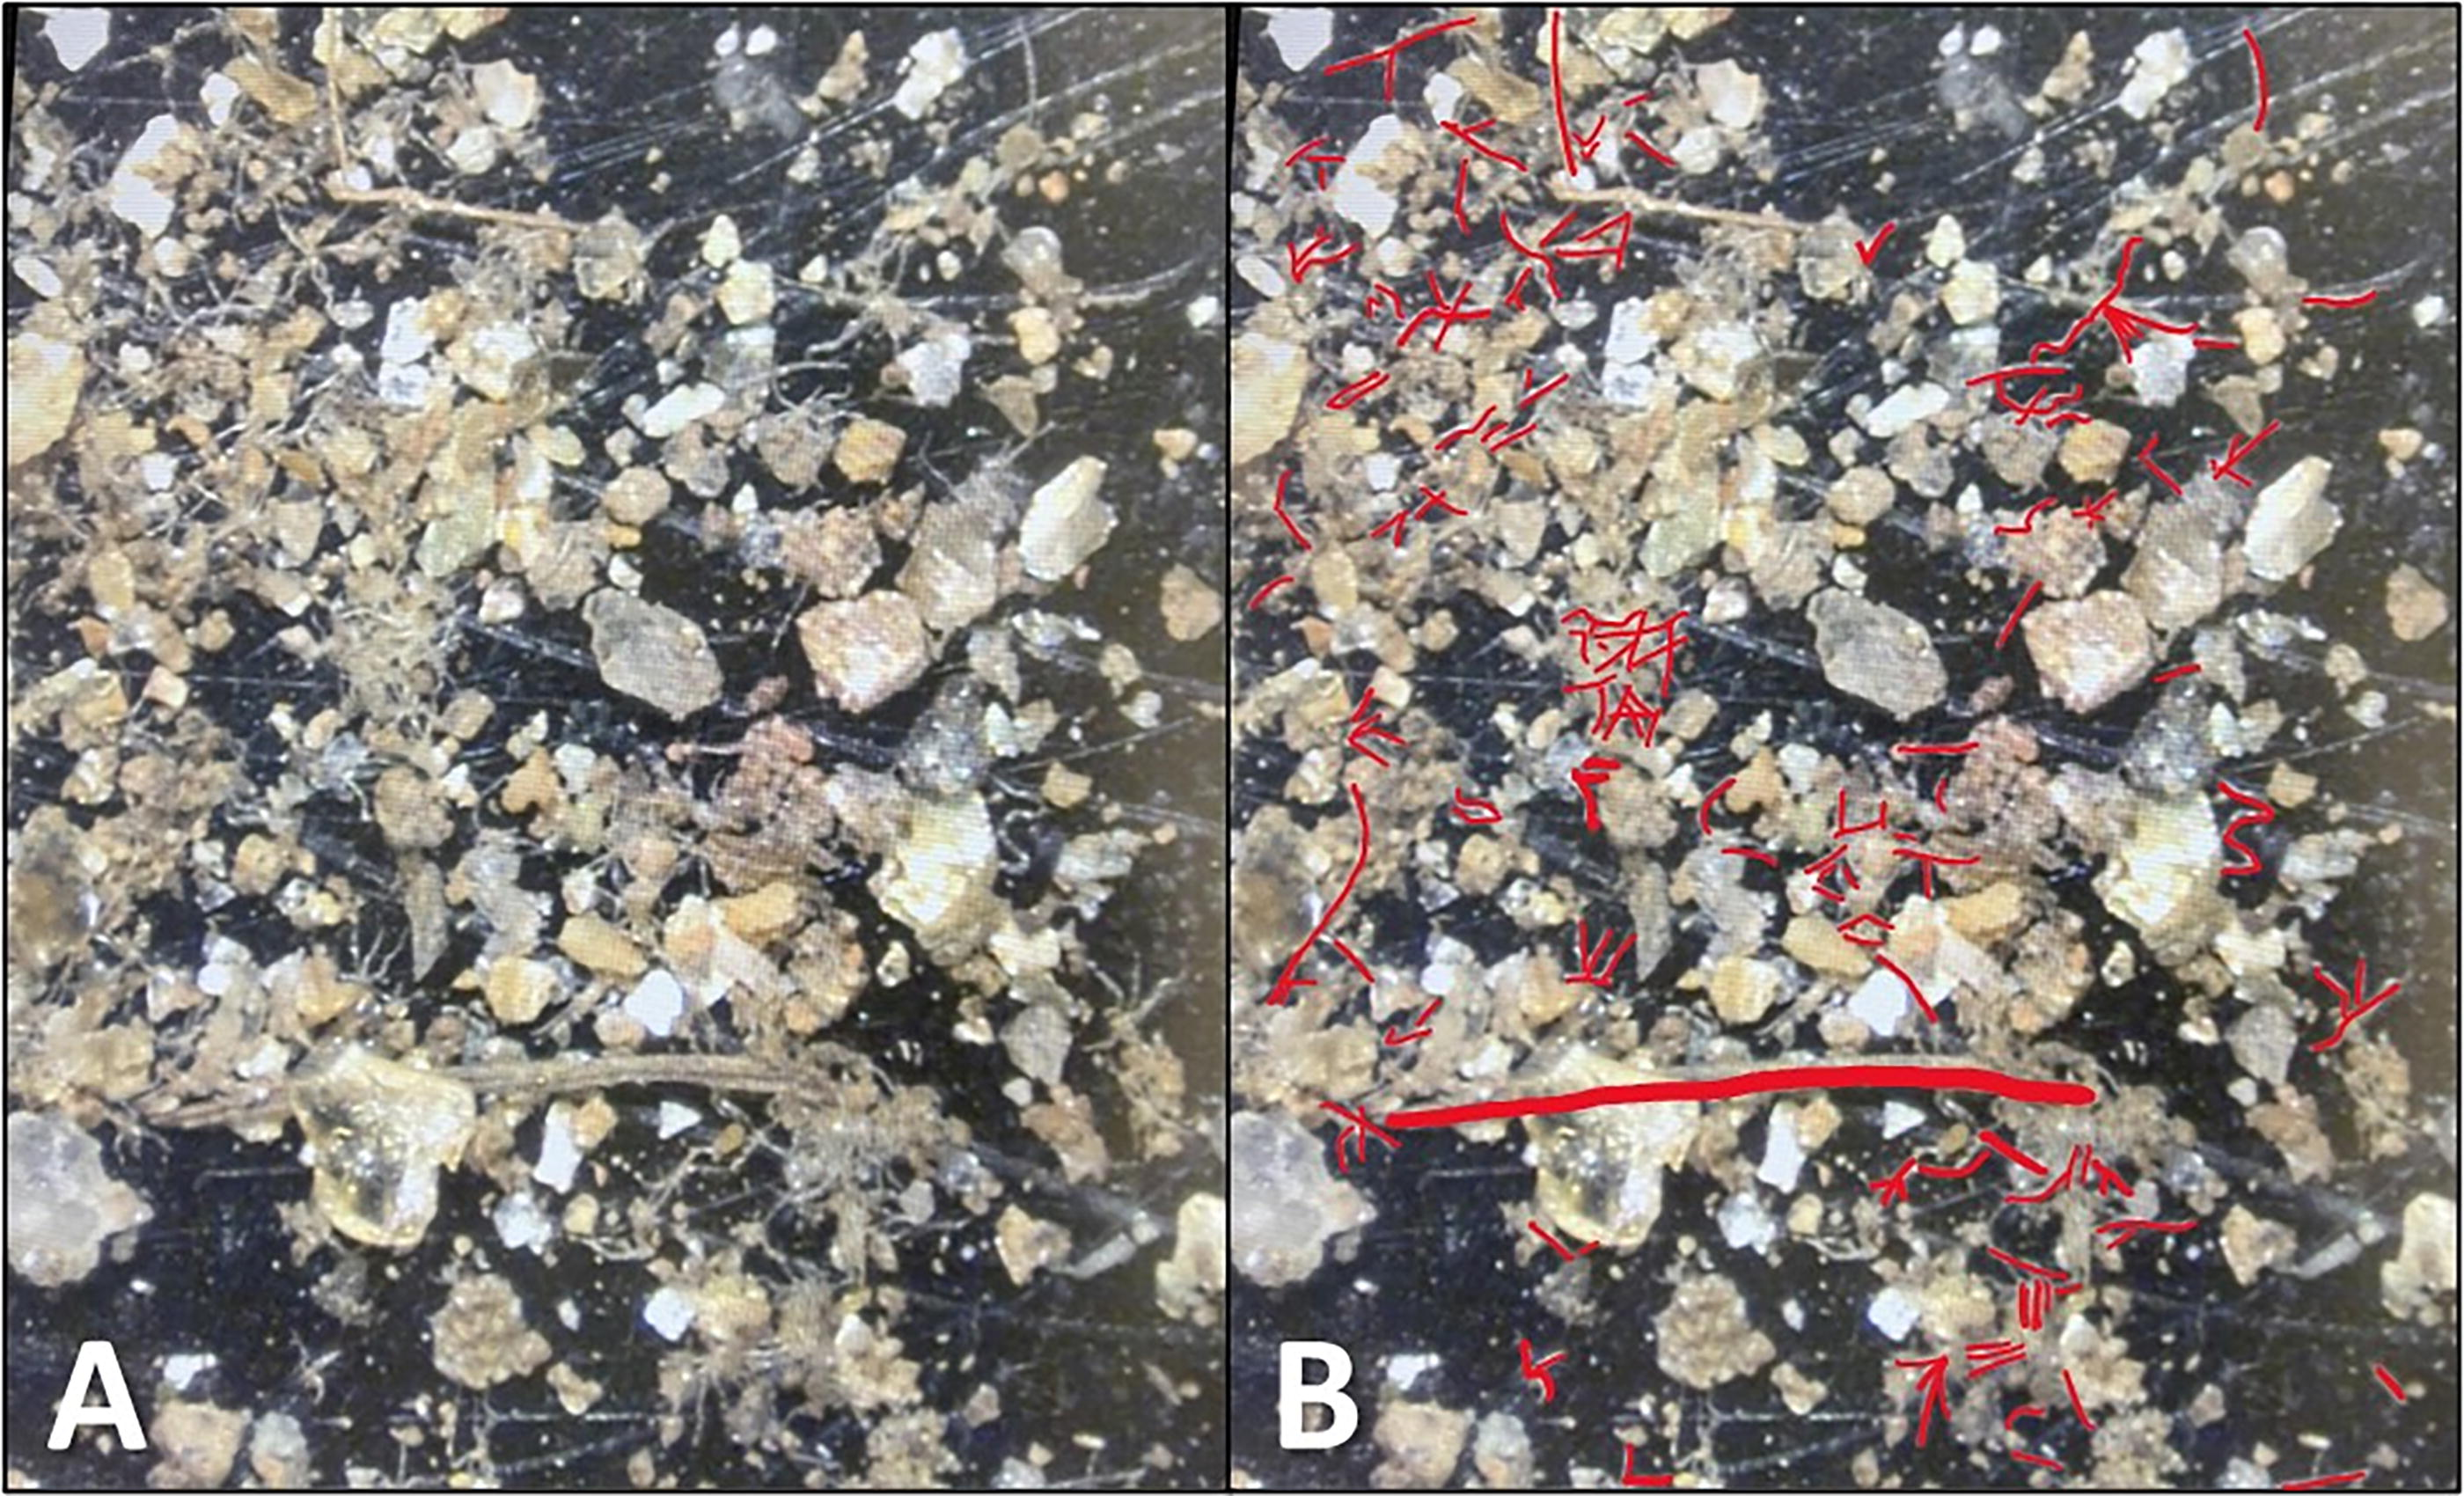
Example view of a sample on the black picking tray highlighting the high concentration of microplastic fibers compared with other particle types. Original image
As many studies have reported, not all particles counted are microplastic (Song et al., 2015; Yu et al., 2017). Twenty representative fibers from five samples were analyzed by LDIR. While the majority of the fibers were cellulosic, and 5% were naturally occurring polyamides, plastic material made up between 25% and 40% of the fibers. Fibers were made of rubber, polyethylene terephthalate, polyoxymethylene, polycarbonate, polyvinyl chloride (PVC), polypropylene, and polyamides.
Discussion
Sampling technique
The design of the sampling station focused on collecting surface water in a small freshwater watershed where sampling with a large manta trawl would not be practical. This adds a new method to the toolbox of available techniques for microplastic sampling (Razeghi et al., 2021). The plankton nets were selected based on their mesh size (80 μm), which is smaller than that of the mantra trawls (335 μm) traditionally used in larger bodies of water (Du et al., 2022; Malla-Pradhan et al., 2023). Additionally, when comparing the microplastic concentration at both mesh sizes, previous studies in urbanized freshwater systems have reported a higher microplastic concentration when sampling with plankton nets than manta trawls (Dris et al., 2015).
It was an important goal of this study to be minimally invasive to the surrounding environment while also making sure to not introduce plastic material to the system. Cross contamination between sampling equipment and microplastic concentration were a concern throughout this study, which is why as little plastic as possible was used in the sampling station design and the lab analyses. Additionally, the QA/QC measures taken helped to minimize the potential for microplastic contamination in samples. Even with these measures, there was still some contamination; however, it was much lower than the actual microplastic counts (mean of 40 particles vs. >269). Adjusting results for background contamination levels confirms our overall findings that microplastic content increases significantly from upstream to downstream positions in this small stream. Floating the net on the water’s surface allowed the water to naturally flow through the net opening, which is less invasive than using pumps to extract the water out of Hunnicutt Creek. Similarly, care was taken to not disturb the water and sediments upstream of the sampling station (e.g., by walking through the stream) and to not resuspend plastics that may be stored on/in the sediments or release microplastics trapped in small pools.
The sampling station design successfully supported the plankton net on the surface of the water column for the duration of the sample event without failing (e.g., did not dig into stream bed or rise above the water surface), which ensured the material collected was only floating material. This suggests the reflecting rods were a good choice to hold the kickboard and plankton net, which are very lightweight, in place. This is significant because the plexiglass reflecting rods have a small diameter in comparison to other materials such as metal, wood, or PVC pipes. Additionally, the small diameter of the reflecting rods allowed for minimal disturbance in the streamflow moving through the plankton nets.
Microplastic quantification
The focus of the study was the quantification of microplastic concentration in surface water during baseflow conditions using a novel sampling station design. The mean microplastic concentration between sites did vary, with the lowest microplastic concentration occurring upstream (Site 5) and the highest microplastic concentration occurring downstream (Sites 1 and 2). The pattern of mean microplastic concentration through each sampling site indicates that microplastic abundance increases from the start to the bottom of the watershed. Although some individual sites did not display statistical differences when comparing their average microplastic concentrations (such as Sites 3 and 4), the overall trend demonstrates an increase at downstream sites in the Hunnicutt Creek watershed. A possible explanation as to why the middle of the watershed experienced a similar microplastic concentration during baseflow conditions is that the branches of Hunnicutt Creek act as a losing stream, which means that certain sections of Hunnicutt lose water downstream. This would mean that certain branches do not contribute equally to the overall flow of Hunnicutt Creek and could potentially leave microplastic particles behind. Additionally, portions of certain branches of Hunnicutt Creek experience little to no flow, so it is possible microplastic particles are being deposited with other suspended solids in these lower flow areas. While this study did not determine whether Hunnicutt Creek is a gaining or losing stream, the results demonstrate that even in small watersheds, microplastic material has the potential to be transported and aggregated in the lower reaches of the watershed.
Conclusion
Microplastics have been identified in freshwater fluvial systems throughout the world, and as the awareness for this emerging contaminant continues to spread, it is increasingly important to investigate the full effects of microplastic pollution on human health, the environment, and potential legislation related to water quality standards. Current research efforts deploy a variety of collection techniques in fluvial systems that can vary based on the size and flow of the system. This study describes a new sampling station design and strategy for small and shallow suburban streams and successfully demonstrates the reproducibility of microplastic concentration results at a constant flow regime across a small suburban watershed. To properly assess the extent of microplastic pollution in fluvial systems, state and federal agencies must come to a consensus on best practices around microplastic sampling and concentration limits in media such as natural waters. An effective microplastic sampling design, such as that used in this study, will be essential in determining appropriate microplastic concentrations in water as well as for identifying areas of concern in the watershed. Employing this novel, cost-effective sampling device could lead to installation of potential remediation efforts to reduce microplastic pollution in freshwater systems in a timely manner.
Footnotes
Acknowledgments
The authors wish to thank Meredith Brock and Dr. Calvin Sawyer for helping them determine suitable sampling sites throughout the Hunnicutt Creek watershed. The authors also thank Elizabeth Small for aid in the processing of fibers for the LDIR. This paper is technical Contribution No. 7348 of the Clemson University Experiment Station and is based upon work supported by the National Institute of Food and Agriculture/U.S. Department of Agriculture, under project number SC-1700590.
Authors’ Contributions
C.B.: Conceptualization, methodology, formal analysis, investigation, writing—original draft, and writing—review and editing. K.B.L.: Conceptualization, methodology, resources, formal analysis, writing—original draft, supervision, writing—review and editing, project administration, and funding acquisition. E.C.: Conceptualization, methodology, formal analysis, and writing—review and editing. D.A.L.: Conceptualization and writing—review and editing. S.L.W.: Conceptualization, methodology, formal analysis, investigation, resources, writing—original draft, writing—review and editing, and visualization.
Author Disclosure Statement
The authors declare no conflicts of interest.
Funding Information
Funding for this work was provided by
References
Supplementary Material
Please find the following supplemental material available below.
For Open Access articles published under a Creative Commons License, all supplemental material carries the same license as the article it is associated with.
For non-Open Access articles published, all supplemental material carries a non-exclusive license, and permission requests for re-use of supplemental material or any part of supplemental material shall be sent directly to the copyright owner as specified in the copyright notice associated with the article.