




Abstract
Increased organic waste generation in the residential, industrial, and agricultural sectors results in massive amounts of organic waste that are landfilled and incinerated, thereby contributing to environmental pollution. Opportunities exist to recover valuable resources from organic waste to potentially leverage economic and environmental benefits. One common strategy for managing organic waste is anaerobic digestion (AD). The liquid effluent from AD, called digestate, is a concentrated source of phosphorus and nitrogen. These nutrients can be recovered via struvite precipitation. The overall study goal was to quantify the effectiveness of five statistical and machine learning (ML) models in predicting the percentage of nutrients recovered from digestate derived from different organic waste streams via struvite precipitation. Nine combinations of parameters were developed to quantify the effects of multiple parameters on nutrient recovery efficiency. These five models were multiple linear regression (MLR), polynomial regression (PLR), K-nearest neighbors (KNN), random forest (RF), and eXtreme Gradient Boosting (XGBoost). RF and XGBoost had the best performance in predicting nutrient recovery efficiency among the five developed models. Both models had a regression coefficient (R2) for phosphate and ammonium recoveries above 0.90 and a root mean square error of 2–7.67. The comparison of different combinations indicated that predicting PO43− and NH4+ recoveries (%) was most influenced by the following input variables: pH, Mg:P and N:P molar ratios, mixing speed, reaction temperature, hydraulic retention time, and concentrations of sodium, potassium, calcium, magnesium, ammonium, and phosphate. We concluded that ML models can provide useful nutrient recovery predictions via struvite precipitation. As a result, the operation of resource recovery systems can be optimized using ML models.

Introduction
The discharge of untreated or undertreated organic waste (e.g., animal manure and sewage sludge) into surface water is a key source of eutrophication (Möller and Müller, 2012; Orner et al., 2020; Sampat et al., 2019), which is adversely impacting accessibility to clean drinking water and safe water recreation (Kakade et al., 2021; Kogler et al., 2021). In the United States, eutrophication affects 50–80% of freshwater ecosystems, contributing to an annual economic loss of $2.2 billion (Kogler et al., 2021). Sustainable organic waste management practices such as anaerobic digestion (AD) and composting could help divert these wastes to reduce eutrophication while also producing valuable resources such as fertilizer and energy (Sganzerla et al., 2023; Wang et al., 2023a, Wang et al., 2023b; Wang and Ng, 2019).
Resource recovery technologies can reduce the negative impacts of conventional organic waste management (e.g., landfilling, untreated discharge) on the economy, environment, and human health (Ddiba et al., 2022; Wu and Vaneeckhaute, 2022). The United Nations Sustainable Development Goals (SDGs) address nutrient pollution and the damage that it may cause to ecosystem functions (United Nations, 2022) (Supplementary Data S1 (Section A), Supplementary Fig. S1). AD is one of the most popular resource recovery technologies to treat organic waste streams (Rocamora et al., 2020). It can be a sustainable method for treating wastes rich in organic matter and moisture content such as organic waste (e.g., food waste), industrial waste (e.g., dairy waste), and municipal waste (e.g., sewage sludge) (Avinash and Mishra, 2023; Bella and Rao, 2023; Di Capua et al., 2020; Prasanna Kumar et al., 2024; Xu et al., 2018). The primary products from AD are biogas and digestate (Agarwal et al., 2022; Lorick et al., 2020; Tariq et al., 2024). Natural gas can be obtained from biogas after carbon dioxide (CO2), and other products have been removed via posttreatment (Angenent et al., 2022). Globally, large amounts of digestate are produced each year as the number of AD plants increases (e.g., in the European Union, 180 million tons are produced annually) (Doyeni et al., 2021; Weckerle et al., 2023). Untreated digestate poses a serious threat to soil, water bodies, and the atmosphere (Weckerle et al., 2023). Digestate is a source of nutrients, toxic elements (e.g., heavy metals), and pathogens (Golovko et al., 2022; Zhu et al., 2014). The excess discharge of these sources could lead to water and soil pollution. Pathogens from digestate could also cause food contamination, affecting human health. The digestate could release volatile emissions that could pollute the air. It was estimated that digestate releases 139 g of CO2-eq per kg produced (Barampouti et al., 2020). The digestate contains high levels of inorganic compounds such as nitrogen and phosphorus (Campos et al., 2019). These compounds are considered beneficial to the environment when recovered and used as fertilizers to minimize the use of synthetic fertilizers in agriculture (Ekstrand et al., 2022; Orner et al., 2021b; Pan et al., 2019).
Our study focused on recovering the liquid fraction of the digestate, and many nutrient recovery technologies are used to recover nutrients in digestate including struvite precipitation and ammonia stripping (Fig. 1) (Wu and Vaneeckhaute, 2022). Struvite precipitation is a chemical process with high efficiency in removing phosphorus and nitrogen from digestate (Mousavi et al., 2024; Pandey and Chen, 2021; Zhou and Wu, 2012). Struvite is a slow-release fertilizer that could reduce global reliance on synthetic fertilizers produced from phosphate rock (Battaz et al., 2024). It is considered better than other technologies for many reasons. It can recover ammonium and phosphorus simultaneously compared to ammonia stripping, which removes only ammonia from wastewater (Corona et al., 2021). Additionally, struvite precipitation is regarded as an economically viable option if used in wastewater treatment plants (Achilleos et al., 2022). Constructed wetlands or lagoons are other low-cost technologies that can provide further treatment for the liquid effluent from struvite precipitation, which can be used later for irrigation or aquaculture (Orner et al., 2021a; Styles et al., 2018). Recent literature studies have been conducted using life cycle assessment and techno-economic analysis to assess the sustainability of deploying struvite precipitation integrated with anaerobic digesters. Multiple studies have found that struvite precipitation can simultaneously reduce carbon footprint and eutrophication and be economically beneficial using struvite as fertilizer (Aghdam, 2022; Mayor et al., 2023; Orner et al., 2021a).
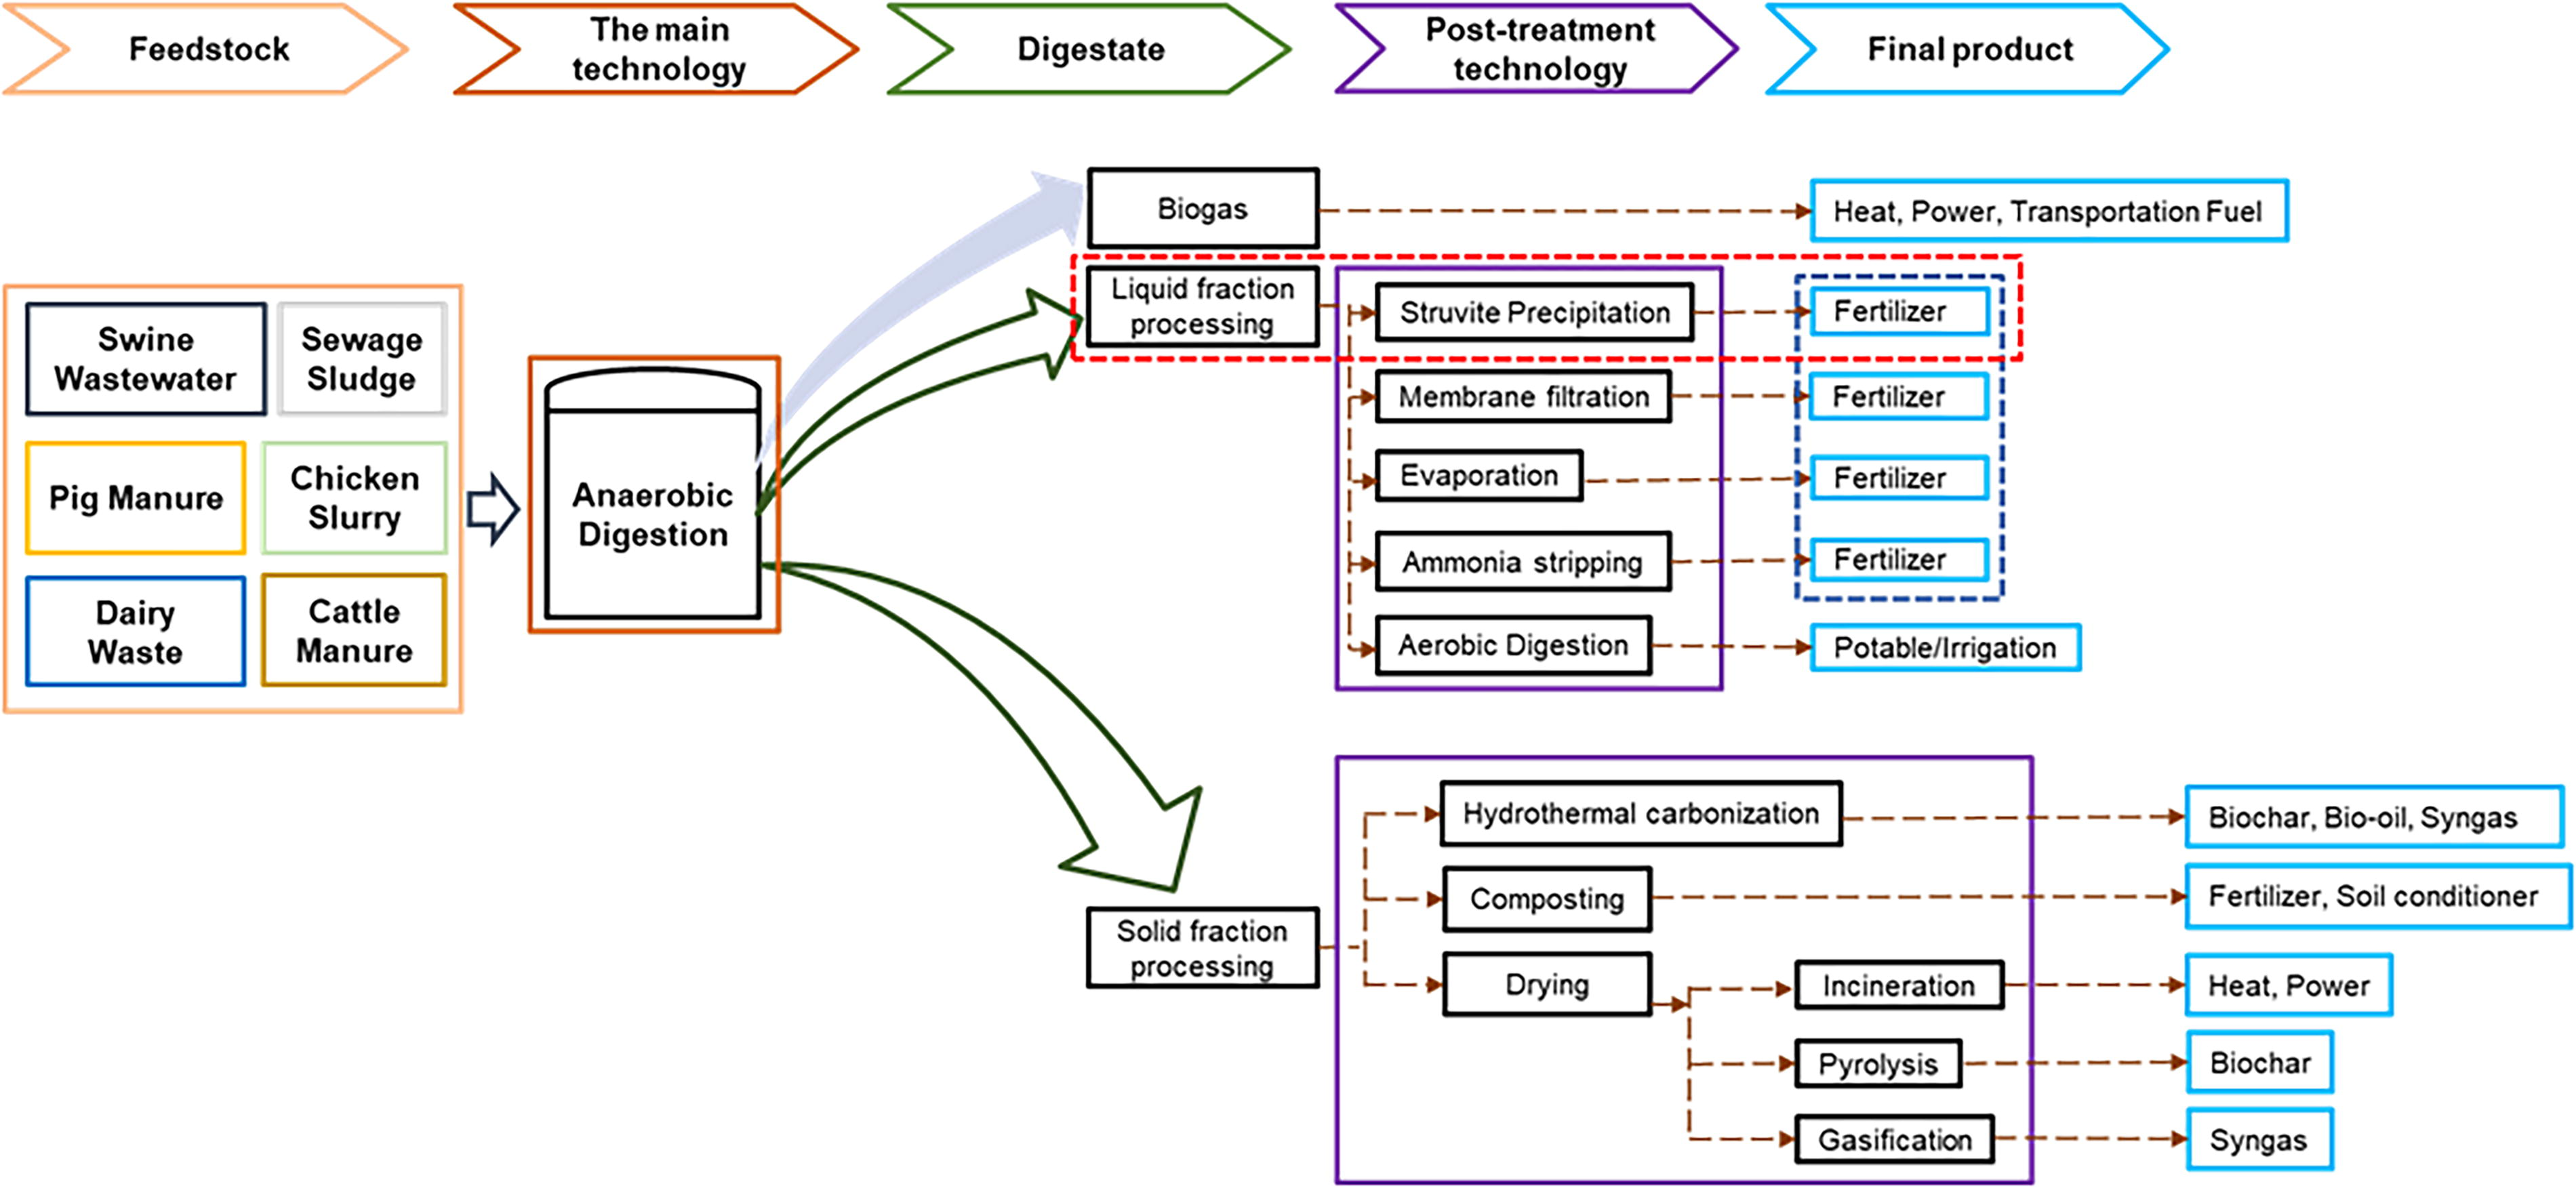
Resource recovery feedstocks, technologies, and final products. The red dashed box represents this study’s main treatment track.
Predicting the efficiency of nutrient recovery technologies like struvite precipitation is time- and cost-consuming utilizing conventional methods such as laboratory experiments (Leng et al., 2024; Pavan et al., 2022; Soo et al., 2023). Alternative approaches, such as computer modeling, are increasingly being investigated to achieve cheaper, faster, and more accurate outcomes (Vaneeckhaute et al., 2020). Different prediction models have been used in literature for this purpose, such as regression models, equilibrium-based models (thermodynamic), and kinetic-based models (Hurairah et al., 2021; Liao et al., 2020; Saadabadi et al., 2020). Recently, machine learning (ML) applications have gained considerable attention for addressing sustainability challenges through the development of highly accurate predictive models. ML algorithms rely on statistical analysis and computer software to analyze and identify hidden patterns in datasets (Rodrigues et al., 2021; Tsui et al., 2023).
Few scientific publications have used ML tools to model the nutrient recovery efficiency of phosphorus in the form orthophosphate (PO43−) and nitrogen in the form of ammonium (NH4+) during struvite precipitation compared to statistical models (Li et al., 2021). Supplementary Table S1 summarizes the previous studies that used the statistical and ML models to predict the efficiency of nutrient recovery of PO43− and NH4+ by struvite precipitation. The application of data-driven models to investigate struvite precipitation was commonly used to recover nutrients from a single organic waste stream, although the investigation of digestate as a source for nutrient recovery by struvite precipitation has not been well studied (Astals et al., 2021; Lavanya et al., 2019; Leng et al., 2024; Nageshwari et al., 2022). Furthermore, only statistical models were widely used to predict nutrient recovery (McIntosh et al., 2022). Additionally, Nageshwari et al. (2022) used small datasets to predict the efficiency of struvite precipitation (n = 100), and less than 5% of the collected data were for digestate, which is problematic considering that larger sample sizes can give more reliable outcomes (Zaki et al., 2023). Another study used struvite precipitation to recover phosphorus and nitrogen from synthetic wastewater (Leng et al., 2024). The study suggested that ML models such as gradient boosting regression and random forest (RF) could be used to optimize the phosphorus and nitrogen recoveries using struvite precipitation. According to the sensitivity analysis of the models developed by Leng et al., P initial concentration, pH, and Mg:P:N molar ratio played an important role in maximizing nutrient recovery by struvite precipitation. Therefore, ML models can assist organic waste management facilities in optimizing the control parameters by testing the developed models with a larger sample size and then increasing the statistical significance of the optimizing process. In summary, using ML tools to model nutrient recovery for the struvite crystallization process of organic waste digestate needs further study.
The overall goal of this research was to investigate the effectiveness of statistical and ML models in predicting the nutrient recovery efficiency of struvite precipitation from different organic waste digestates and then compare the effectiveness of the two types of data-driven models. The three objectives of the study were the following: (1) to investigate the effect of different parameters on nutrient recovery efficiency (e.g., pH, molar ratio, and reaction temperature), (2) to identify the effective sample size for modeling, and (3) to identify the most accurate model in predicting nutrient recovery efficiency.
Materials and Methods
Data sources
The database used in this study was developed from The Research Repository at West Virginia University, ProQuest, and Google Scholar search engines. The following keywords were used in the search engines using different combinations: “organic waste,” “struvite,” “struvite precipitation,” “digestate,” “anaerobic digestion,” “regression,” and “machine learning.” From this keyword search, the dataset for this study was derived from 26 peer-reviewed publications that provided data on nutrient recovery efficiency by struvite precipitation (both laboratory- and pilot-scale applications) from digestate of organic feedstocks such as sewage sludge, swine manure, and chicken slurry (Fig. 2). Supplementary Table S2 shows the number of studies used in this study and the number of data points used from each one. The number of data points used confirms that the data source is not biased to one study.
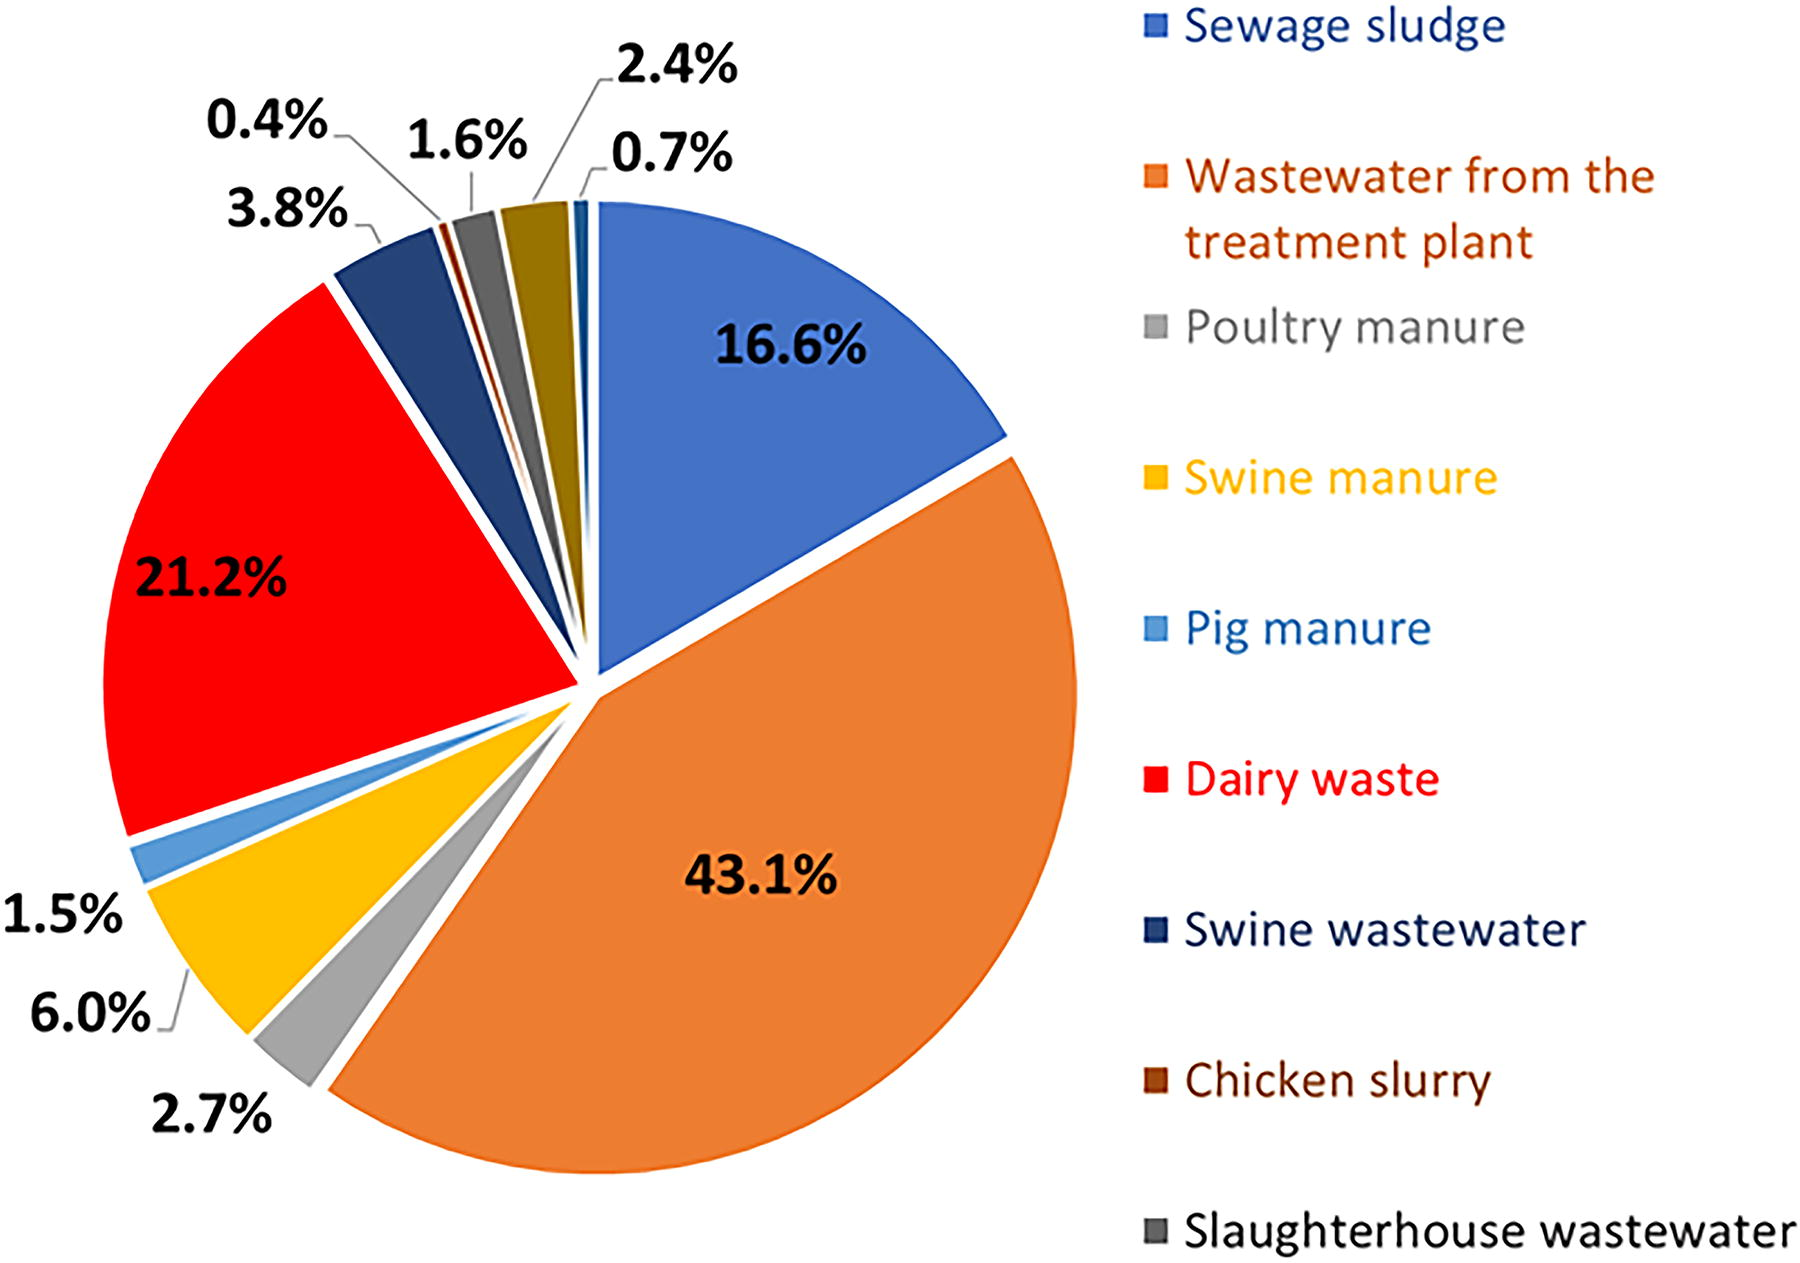
The distribution of digestate derived from organic feedstock sources in the dataset used by this study.
Typically, struvite precipitation consists of two tanks: a mixing tank for the organic waste digestate and a settling tank for the precipitate. The organic waste digestate goes into a process where NaOH is added to maintain pH and Mg to achieve efficient struvite precipitation from digestate, rich in PO4 and NH4. The production of struvite can be shown in the following equation (Jabr et al., 2019; Zhang et al., 2024):
Struvite formation is affected by several factors including organic waste composition, pH, degree of supersaturation, and molar ratios of magnesium to phosphorus (Mg:P) and nitrogen to phosphorus (N:P) (Corona et al., 2021; Korchef et al., 2023; Zhang et al., 2024). The cumulative effects of these factors have not been studied. For example, there were limited studies that have reported the effects of some parameters such as reaction temperature on the yield of struvite precipitation and particle size for different wastewater sources (Moyo et al., 2024; Shaddel et al., 2020). Therefore, we focused on the chemistry of the process (i.e., effects on nucleation and nutrient recovery), while the biology was not considered.
Based on the availability of data in the literature, two different scenarios were developed for identifying the effects of multiple parameters on nutrient recovery efficiency. Scenario I analyzed a lower number of parameters, such as pH and the molar ratios of Mg:P and N:P. Scenario II analyzed a higher number of parameters, including pH, mixing speed, reaction temperature, hydraulic retention time (HRT), and concentrations of sodium, potassium, calcium, magnesium, ammonium, and phosphate. These two scenarios have not been well studied in the literature.
Preprocessing of the dataset
Data preprocessing is essential to ensure the preparation of a robust dataset before evaluation using statistical and ML models (Zaki et al., 2023). Preprocessing involves data cleaning, imputation, and normalization.
Data cleaning and imputation
Data cleaning is the process of reducing noise in the data by removing outliers and improving data quality. In most cases, keeping outliers in the dataset causes low confidence in the prediction models (Soo et al., 2023). The developed models were first processed through imputation, followed by the removal of the outliers. The dataset of Scenario I did not have any missing values. Missing data in Scenario II were imputed using the mean imputation method (Altuhaifa et al., 2023). In this method, the missing values in each variable are filled with the average of the total data points (Chen and McCoy, 2024).
Additionally, cleaning the dataset by removing the outliers can help achieve more reliable and accurate predictions. The interquartile range (IQR) rule was applied to all observations in Scenario I and Scenario II to remove outliers. The IQR calculates the difference between the lower quartile and the higher quartile of the dataset. Data points that lie outside the range of the upper quartile plus 1.5 times IQR and the lower quartile minus 1.5 times IQR are considered outliers (Jeong et al., 2020). An average of 10% of the data was removed via this cleaning process for both scenarios and different combinations.
Data normalization
The normalization of data is a preprocessing step that transforms the input features into a comparable range to facilitate an unbiased analysis of all data, thereby improving prediction accuracy (Chen et al., 2022; Singh and Singh, 2020). The input data were normalized using the z-score technique as shown in Equation (2):
Feature relationship
The understanding of features is a crucial step in the development of statistical and ML models. The purpose of this step is to understand the relationships between the input variables (i.e., predictors) and the target variable. Pearson’s correlation coefficient (r) determines the linear relationship between different variables, where r = 1 indicates a strong positive relationship, r = −1 indicates a weak negative relationship, and r = 0 indicates no relationship (Ghasemi and Naser, 2023). The corr() method within the Pandas Dataframe in Python was used to determine r between all the parameters in the dataset. Pearson’s correlation analysis is an effective way to identify the impact of multicollinearity in a dataset. However, despite showing pairwise multicollinearity between the input variables, the Pearson’s correlation analysis cannot identify the degree order of multicollinearity. Therefore, we used variance inflation factor (VIF) to identify predictors with high levels of multicollinearity from the dataset. VIF values exceeding 5 indicate moderate levels of multicollinearity, while VIF values exceeding 10 indicate high levels of multicollinearity (Chan et al., 2022). The VarianceInflationFactor within the statistical model’s library in Python was used to quantify multicollinearity.
Data splitting
The dataset was split into two subsets (one for training and one for testing) for both scenarios to develop accurate models and avoid overfitting. Overfitting usually occurs when models fit the training dataset well but fail to fit unseen testing data (Kernbach and Staartjes, 2022; Yeom et al., 2018). Two common methods have been typically used in the literature for data splitting in resource recovery literature: the single hold-one-out approach and the k-fold cross-validation (Zaki et al., 2023). In the single hold-one-out approach, the dataset is split into a 70:30 ratio, a 80:20 ratio, or a 90:10 ratio for the training and testing datasets (Hany et al., 2021; Jha, 2023; Nguyen et al., 2021). The sklearn train_test_split function in Python was used to split the datasets applied to the single hold-one-out approach. A k-fold cross-validation approach splits the dataset into k subsets, or folds, where (k − 1) folds are used for training the model, and the rest of each fold is used for testing. The average of k values was calculated and used to estimate the generalization performance of the final model (Zhang and Liu, 2023). The KFold function in sklearn Python package with k = 5 was utilized to perform this operation. Considering the large variations of sample sizes across the different combinations (n = 74–1062), we applied various training/testing splitting ratios such as 70:30, 80:20, and k-fold typically found in organic waste resource recovery literature since different splitting ratios in past studies have provided best-performing models for a range of sample sizes (Zaki et al., 2023). The training/testing ratios mentioned above were investigated to determine which had the greatest influence on the accuracy of developed models. After that, the best train-to-test ratio for each developed model was selected for modeling the outcomes.
Model selection and development
Two statistical models and three ML models were developed to predict PO43− and NH4+ recovery efficiency via struvite precipitation from the digestate of different organic waste streams. The statistical models included multiple linear regression (MLR) and polynomial regression (PLR), and the ML models included K-nearest neighbors (KNN), RF, and eXtreme Gradient Boosting (XGBoost). More details about each model utilized in this study are available in Supplementary Data S1 (Sections A.2–A.6). The framework for developing the five statistical and ML models to predict the efficiency of PO43− and NH4+ recovery is shown in Figure 3. The study was developed based on different combinations that vary in sample size and the number of input variables. A combination of different input variables and a number of data points were used to predict the NH4+ and PO43− recovery efficiency (Table 1). Zaki et al. (2023) found that there can be a variety of ways to select the predictor variables, such as utilizing correlation analysis and stepwise regression. Based on this, we leveraged correlation analysis, VIF, and feature importance approach in our study because past studies found this procedure to be more effective for small sample cases, such as those in our study. For each combination, the five statistical and ML models were developed to predict the nutrient recovery efficiency of struvite precipitation. For Scenario I, Combinations 1, 2, and 3 were utilized to predict the PO43− recovery (%) with different predictors such as pH, Mg:P, reaction temperature, Mg:P, and N:P molar ratios (Table 1). Additionally, Combinations 4, 5, 6, and 7 were utilized to predict NH4+ recovery (%) with different predictors such as pH, N:P, Mg:P, and reaction temperature (Table 1). For Scenario II, Combinations 8 and 9 utilized a higher number of predictors to predict the PO43− and NH4+ recoveries (%), such as reaction temperature, mixing speed, HRT, and concentrations of sodium, potassium, calcium, magnesium, ammonium, and phosphate. Scenario I focused on the effect of sample size on the prediction models, while Scenario II focused on the influence of the number of input variables. It is important to highlight that the feedstock type is not considered a predictor because aggregating datasets based on feedstock type will significantly reduce the sample size, eventually impacting the explanatory power of the developed models.

Theoretical framework of this study.
The Data-Driven Models for Different Combinations of Input-Output Variables for Scenario I and Scenario II
Each combination was analyzed with the Multiple Linear Regression (MLR), Polynomial Regression (PLR), K-Nearest Neighbors (KNN), Random Forest (RF), and eXtreme Gradient Boosting (XGBoost) models.
T, Reaction temperature; MS, Mixing speed; HRT, Hydraulic Retention Time; SC, Sodium concentration; KC, Potassium concentration; CC, Calcium concentration; MC, Magnesium concentration; NC, Ammonium concentration; PC, Phosphate concentration; SW, Slaughterhouse wastewater; CW, Cattle manure; DW, Dairy waste; FW, Food wastewater; PM, Pig manure; PMO, Poultry manure; SS, Sewage sludge; SM, Swine manure; SW, Swine wastewater; WW, Wastewater; SWW, Swine wastewater.
Model evaluation
The five models were compared to determine which model performed best and what sample size was most effective for future predictions. The performance of the models was evaluated using two criteria: coefficient of determination (R2) and root mean square error (RMSE) because all these models were calibrated for regression, not classification. The training and testing predicted values were compared using R2. The formula used for the R2 calculation was the following:
The RMSE represented the difference between the predicted target values from a model and actual target values from a dataset. The ideal RMSE value is 0, which means there is no residual error between the actual and predicted values. The RMSE was calculated using Equation (4) (Shyu et al., 2023):
Feature importance using tree-based algorithms
The feature importance analysis, which is the last step in the process, was used to determine the contribution of each variable to the target variable in the ML prediction. A weight was assigned to each predictor based on how significantly it influenced the output variable (Wei et al., 2024). The technique is a postmodel sensitivity of parameters that is only available for tree-based models (e.g., RF and XGBoost) (Zaki et al., 2024), and it is not available for KNN. The scores were calculated based on the assigned weight of each input parameter in the trained dataset. The higher the score for the input variable, the more influential it had in making predictions, which increases its possibility of being used for feature selection.
The variability of the predictors was covered in the feature importance section. Additionally, because the feature importance attribute is only available for RF and XGBoost, and not for the other models, these variations have been further discussed through Pearson’s correlation analysis. The variance in the dataset could affect the predictability of the models. We used the data preprocessing step (remove outliers, imputation, and normalization) to build a robust dataset before developing the models (see the Preprocessing of the Dataset section).
Results and Discussion
A description of the dataset and statistical analyses can be found in Supplementary Data S1 (Sections A.7–A.14, Supplementary Table S3, and Supplementary Figs. S2–S8). Information regarding data correlation is also in Supplementary Data S1 (Section A.15, Supplementary Figs. S9–S16, and Supplementary Tables S4–S11). Results of nutrient recovery prediction, the role of input variables, and study implications are detailed in the following subsections.
Predictions of PO43− and NH4+ recovery (%)
Effects of input variables and the sample size on prediction
Input variables and sample sizes were investigated to identify the best model to predict PO43− and NH4+ recovery during struvite precipitation of various organic waste digestates. In this case, Table 2 summarizes the results of the most accurate models for each combination from Supplementary Tables S12–S15 based on the different splitting ratios for training and testing and values of R2 and RMSE. Additionally, the emboldened data from each row per combination (see Table 2) represented the best-performing model of the five models developed (either statistical or ML). For example, for Combination 3, RF with a splitting ratio of 90:10 provided the most accurate model since R2 values were the highest (training = 0.94 and testing = 0.72) than that of the other models (training = 0.38–0.86 and testing = 0.34–0.71). Additionally, the RMSE values were the lowest (training = 2.00 and testing = 4.40) compared with the other models (training = 2.84–5.87 and testing = 4.92–7.48). Both statistical models (MLR and PLR) of Combination 3 (R2 = 0.38–0.56, RMSE = 5.00–5.87, Table 2) achieved slightly better predictions compared to Combination 1 (R2 = 0.06–0.08, RMSE = 26.81–27.01, Table 2) and Combination 2 (R2 = 0.28–0.37, RMSE = 16.78–17.90, Table 2). Combination 3 had the lowest sample size (n = 251) compared with Combination 1 (n = 1,026) and Combination 2 (n = 538). The ML models had superior predictive accuracy (R2 = 0.59–0.94, RMSE = 2.00–18.00, Table 2) compared with statistical models for Combinations 1–3. The ML model of Combination 3 had better prediction performance (R2 = 0.83–0.94, RMSE = 2.00–3.11, Table 2) compared with similar models in Combinations 1 and 2 (R2 = 0.59–0.90, RMSE = 6.87–18.00, Table 2). Interestingly, Combination 3 had the lowest sample size (n = 251) compared with Combinations 1 (n = 1,026) and 2 (n = 538).
Summary of the Best Performance Statistical and ML Models Based on Different Splitting Ratios Used
Emboldened rows represent the best-performed model for each combination.
KNN, K-nearest neighbor; ML, machine learning; MLR, multiple linear regression; PLR, polynomial regression; RF, random forest; RMSE, root mean square error; XGBoost, eXtreme Gradient Boosting.
The effect of the sample size and the number of input variables was inconclusive on the remaining developed models in Combinations 4–7. The ML models in Combinations 4 and 5 exhibited superior prediction performance (R2 = 0.86–0.98, RMSE = 6.11–15.10, Table 2), surpassing the performance of other models (R2 = 0.28–0.94, RMSE = 1.28–18.00, Table 2). Scenario II had lower sample sizes (n = 74) and more input variables than Scenario I. The results of the statistical models in Scenario II (MLR) had slightly better prediction performance (training R2 = 0.7–0.82 and testing R2 = −0.54 to 0.53, Table 2) when compared with the same models in Scenario I (training R2 = 0.06–0.67 and testing R2 = 0.06–0.65, Table 2). In contrast, the prediction performance of the ML models in Scenario II outcompeted the performance of similar models in Scenario I.
The study indicated that changing the sample size had no clear impact on developing data-driven models, as the only two sample sizes that positively impacted the ML models were in two different ranges: n = 506 (Combinations 4 and 5) and n = 74 (Combinations 8 and 9). At the same time, the comparison of different combinations indicated that the input variables (pH, Mg:P and N:P molar ratios, mixing speed, reaction temperature, HRT, concentrations of sodium, potassium, calcium, magnesium, ammonium, and phosphate) were the best choices to predict PO43− and NH4+ recovery (%).
This study has similar findings to Nageshwari et al. (2022), who studied the effects of different parameters on the recovery of nutrients from different wastewater sources. Several factors common to both studies had a positive impact on the results, including pH, mixing speed, reaction temperature, and magnesium, ammonium, and phosphate concentrations. However, their study did not discuss the effect of sample size on the developed models. The only sample size used was 100, which differs from our study’s range of sample sizes. Alternatively, the results of our study are in agreement with those of Leng et al. (2024) when it comes to the use of different sample sizes. Using a sample size of 210 and 510, they showed a significant effect with their results, which is partly aligned with our results (e.g., n = 506). Furthermore, the pH and Mg:P:N molar ratio were common factors employed in both studies, and they had a significant impact on the outcomes. Finally, we would like to point out that the different combinations of data utilized for this study did not indicate a consistent trend based on the different training-to-testing ratios (see Table 2, where some models with a small sample size performed best with a 70:30 ratio while others with a small sample size performed best with a k-fold splitting ratio).
Prediction performance of the statistical and ML models
Among all models, the results showed that MLR and PLR (Combinations 1–9) had lower prediction accuracies (R2 = 0.06–0.95, RMSE = 2.61–37.05, Table 2) than ML models in both scenarios (R2 = 0.59–0.98, RMSE = 1.28–18.00, Table 2). This was especially relevant to Combinations 8 and 9, where multicollinearity may have contributed to the low statistical performance (VIF for sodium, potassium, and ammonium concentrations >10). It should be noted that all statistical models were prone to overfitting (training R2 = 0.70–0.95 and testing R2 = −0.55 to 0.53, Table 2). Nevertheless, some of the KNN models showed robust and accurate prediction in many developed models, such as Combination 4 and Combination 5 (R2 = 0.93–0.96, RMSE = 8.09–10.68, Table 2). However, other KNN models had low prediction performance due to overfitting, such as Combination 1 and Combination 6 (training R2 = 0.65–0.75 and testing R2 = −0.19 to 0.49, Table 2). The RF model (Scenario I) and XGBoost model (Scenario II) had superior prediction accuracy (R2 = 0.92–0.98, RMSE = 2.00–7.67, Table 2, Fig. 4a and b) in modeling the efficiency of PO43− and NH4+ recovery than all the other models (R2 = 0.06–0.97, RMSE = 1.90–37.05, Table 2).
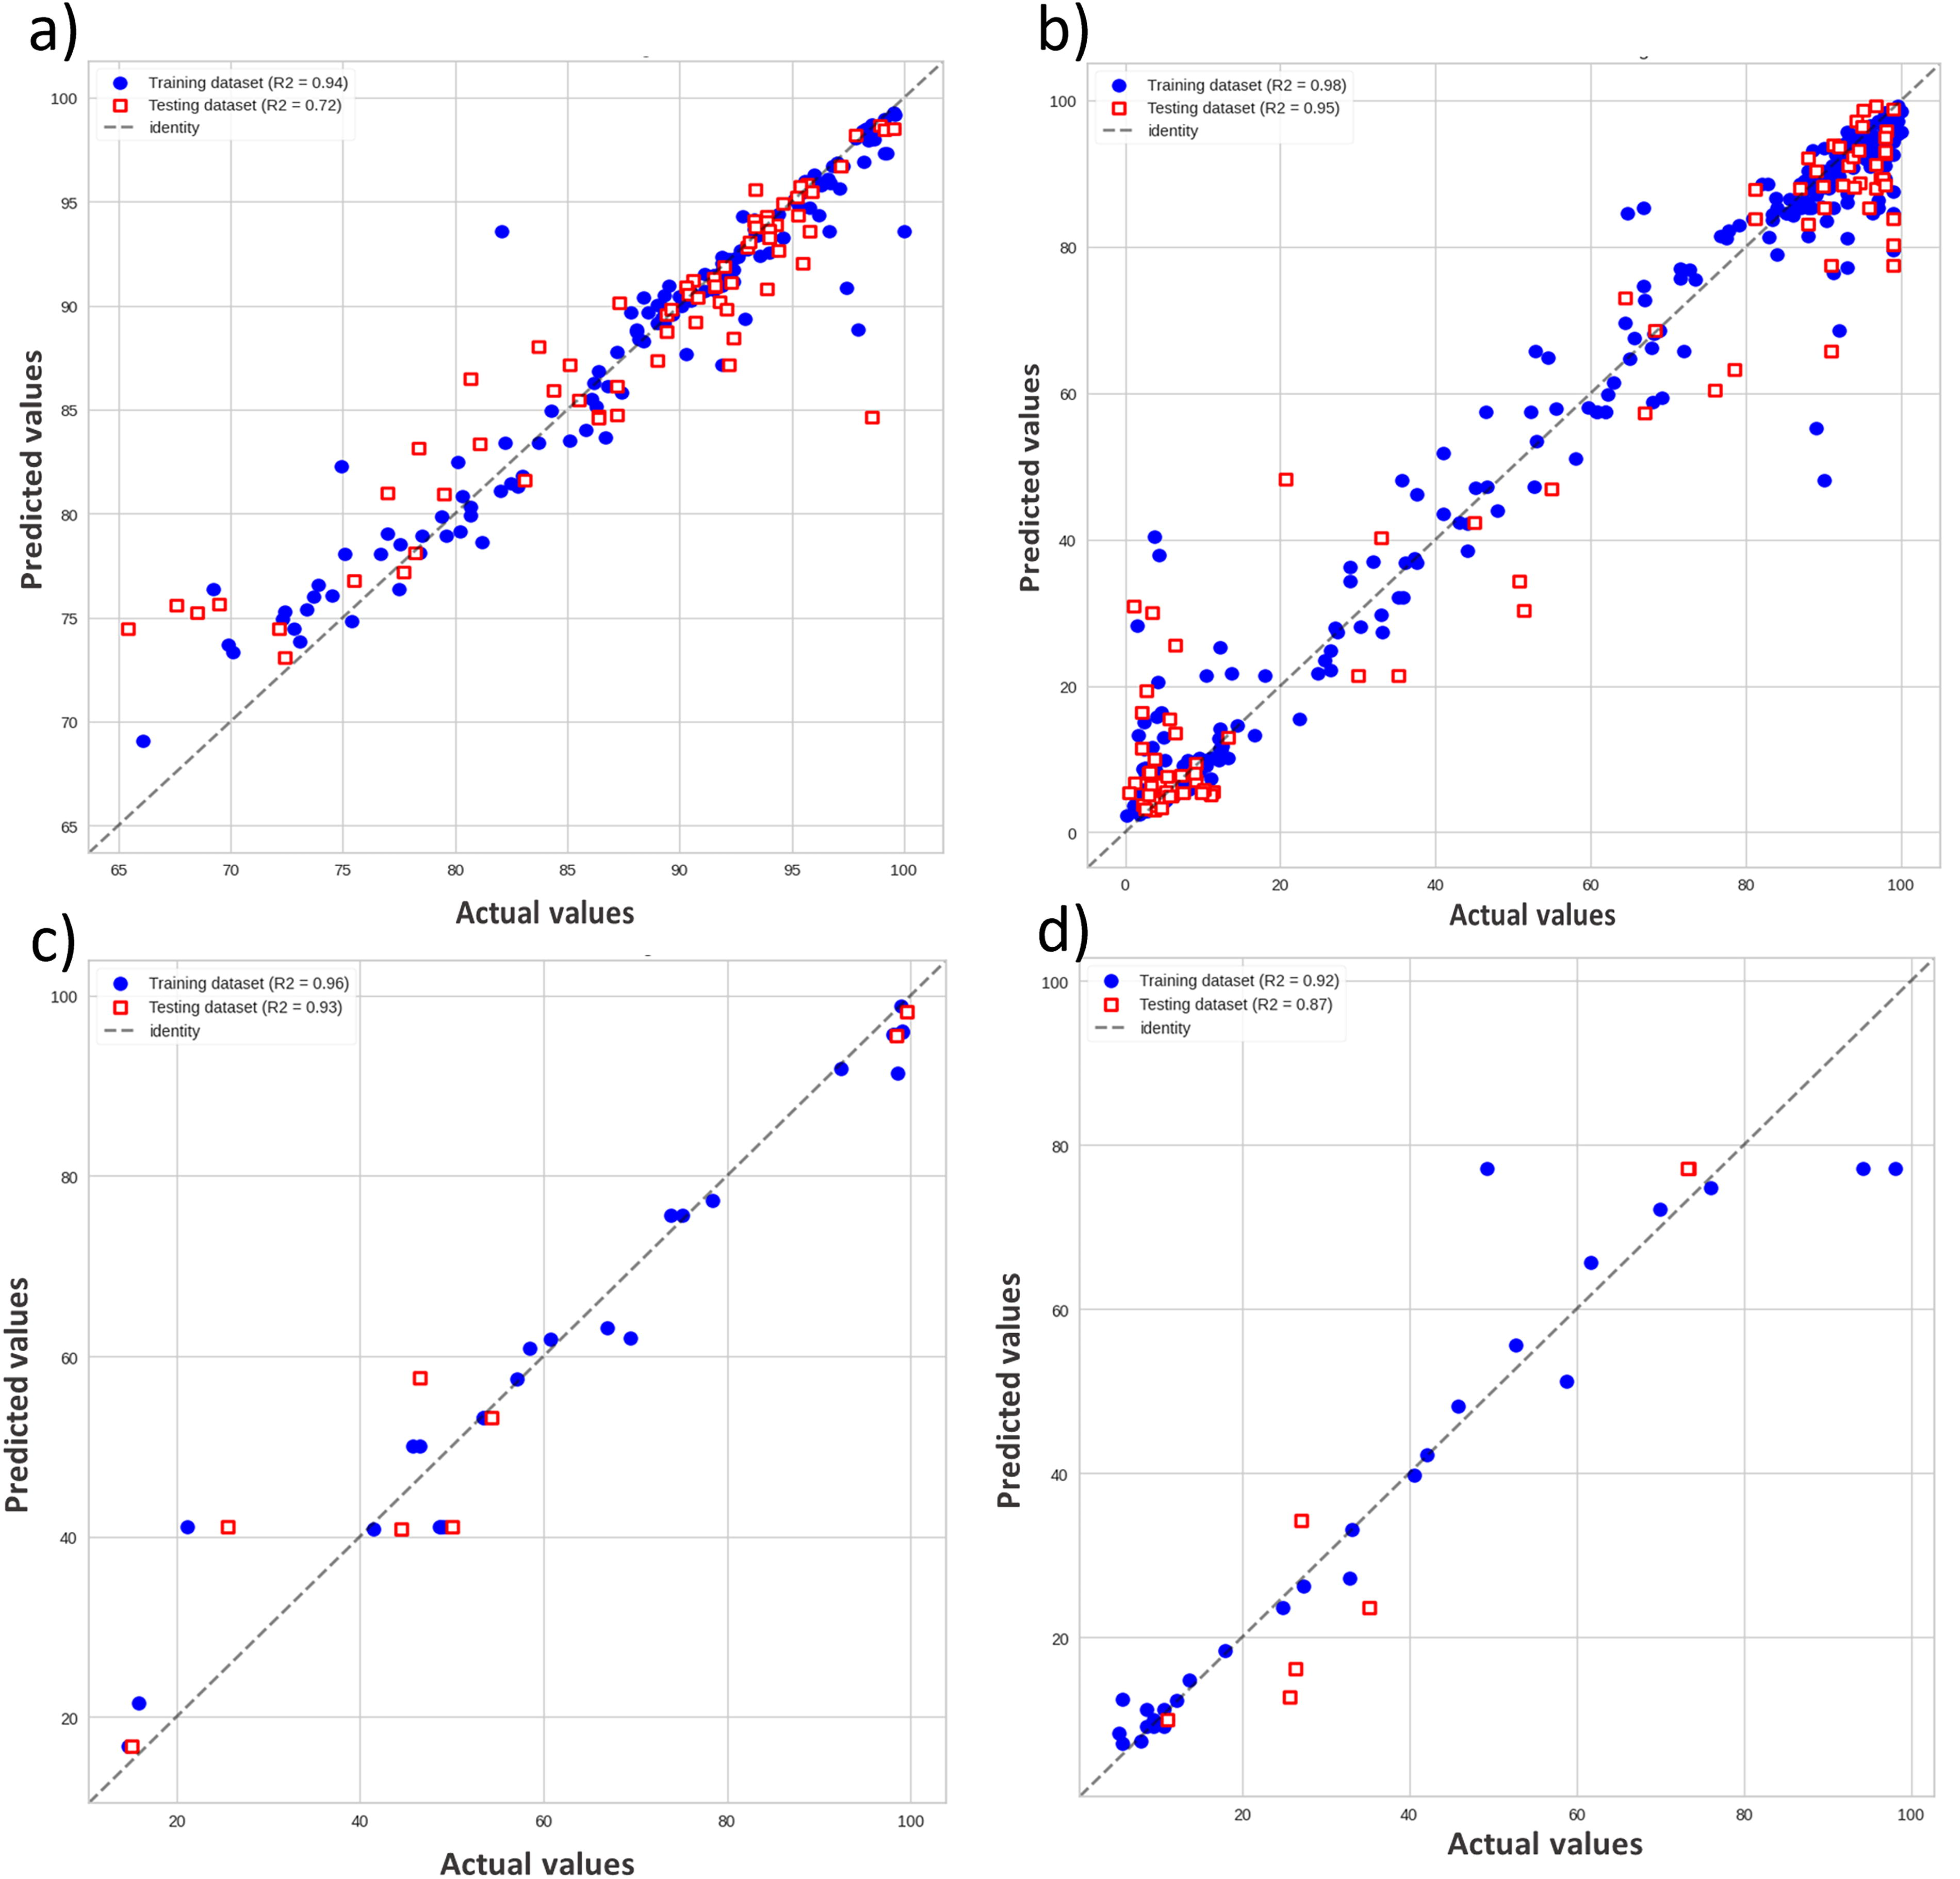
Linear fitting results for the actual versus predicted values for ML models developed for
In Combinations 8 and 9 (Scenario II), the XGBoost models were more accurate for predicting PO43− and NH4+ recovery than RF and KNN (XGBoost [Combination 8], training R2 = 0.92–0.96 and testing R2 = 0.87–0.93, Fig. 4c and d). The results across different combinations indicated that RF (RF [Combination 3] and RF [Combination 5]) was the best prediction model for Scenario I and XGBoost (XGBoost [Combination 8] and XGBoost [Combination 9]) for Scenario II. Overall, the results showed that the tree-based models (RF and XGBoost) performed better than the KNN model. Additionally, the ML models performed better than statistical models.
The role of input variables in prediction
Based on the best performing models, as discussed in the “Prediction Performance of the Statistical and ML Models” section, across different scenarios and combinations, we investigated the role of input variables in prediction (RF [Combination 3], RF [Combination 5], XGBoost [Combination 8], and XGBoost [Combination 9]). The Mg:P molar ratio significantly impacted the efficiency of PO43− recovery, followed by N:P (RF [Combination 3], Fig. 5A). This is understandable because the proportion of magnesium and nitrogen ions relative to phosphate ions in the wastewater is essential for struvite formation and PO43− recovery (Wang et al., 2021). Typically, struvite precipitation requires a molar ratio (Mg:N:P) of (1:1:1) (Wang et al., 2021). Additionally, some studies showed that the increase in PO43− recovery is related to the increase in the N:P molar ratio (Moyo et al., 2023; Wang et al., 2021). In our study, results from the feature importance analysis indicated that the reaction temperature and pH had less impact on the performance of the model when compared with Mg:P and N:P molar ratios, which had a relatively higher effect (RF [Combination 3], Fig. 5a). The reaction temperature influences the solubility of struvite crystals and then the precipitation in wastewater (Shaddel et al., 2020). A high Mg:P molar ratio could reduce the effect of reaction temperature on the efficiency of PO43− recovery (Otieno et al., 2023). The N:P molar ratio was the second important factor (with <30% of the contribution), and the pH was the third contribution with the prediction model (with <20% of the contribution). In RF, Combination 5, the N:P molar ratio had a significant effect on predicting the efficiency of NH4+ recovery with more than 70% of the total contribution. However, the Mg:P molar ratio and pH had a low contribution to NH4+ recovery (<30%) (Fig. 5b).
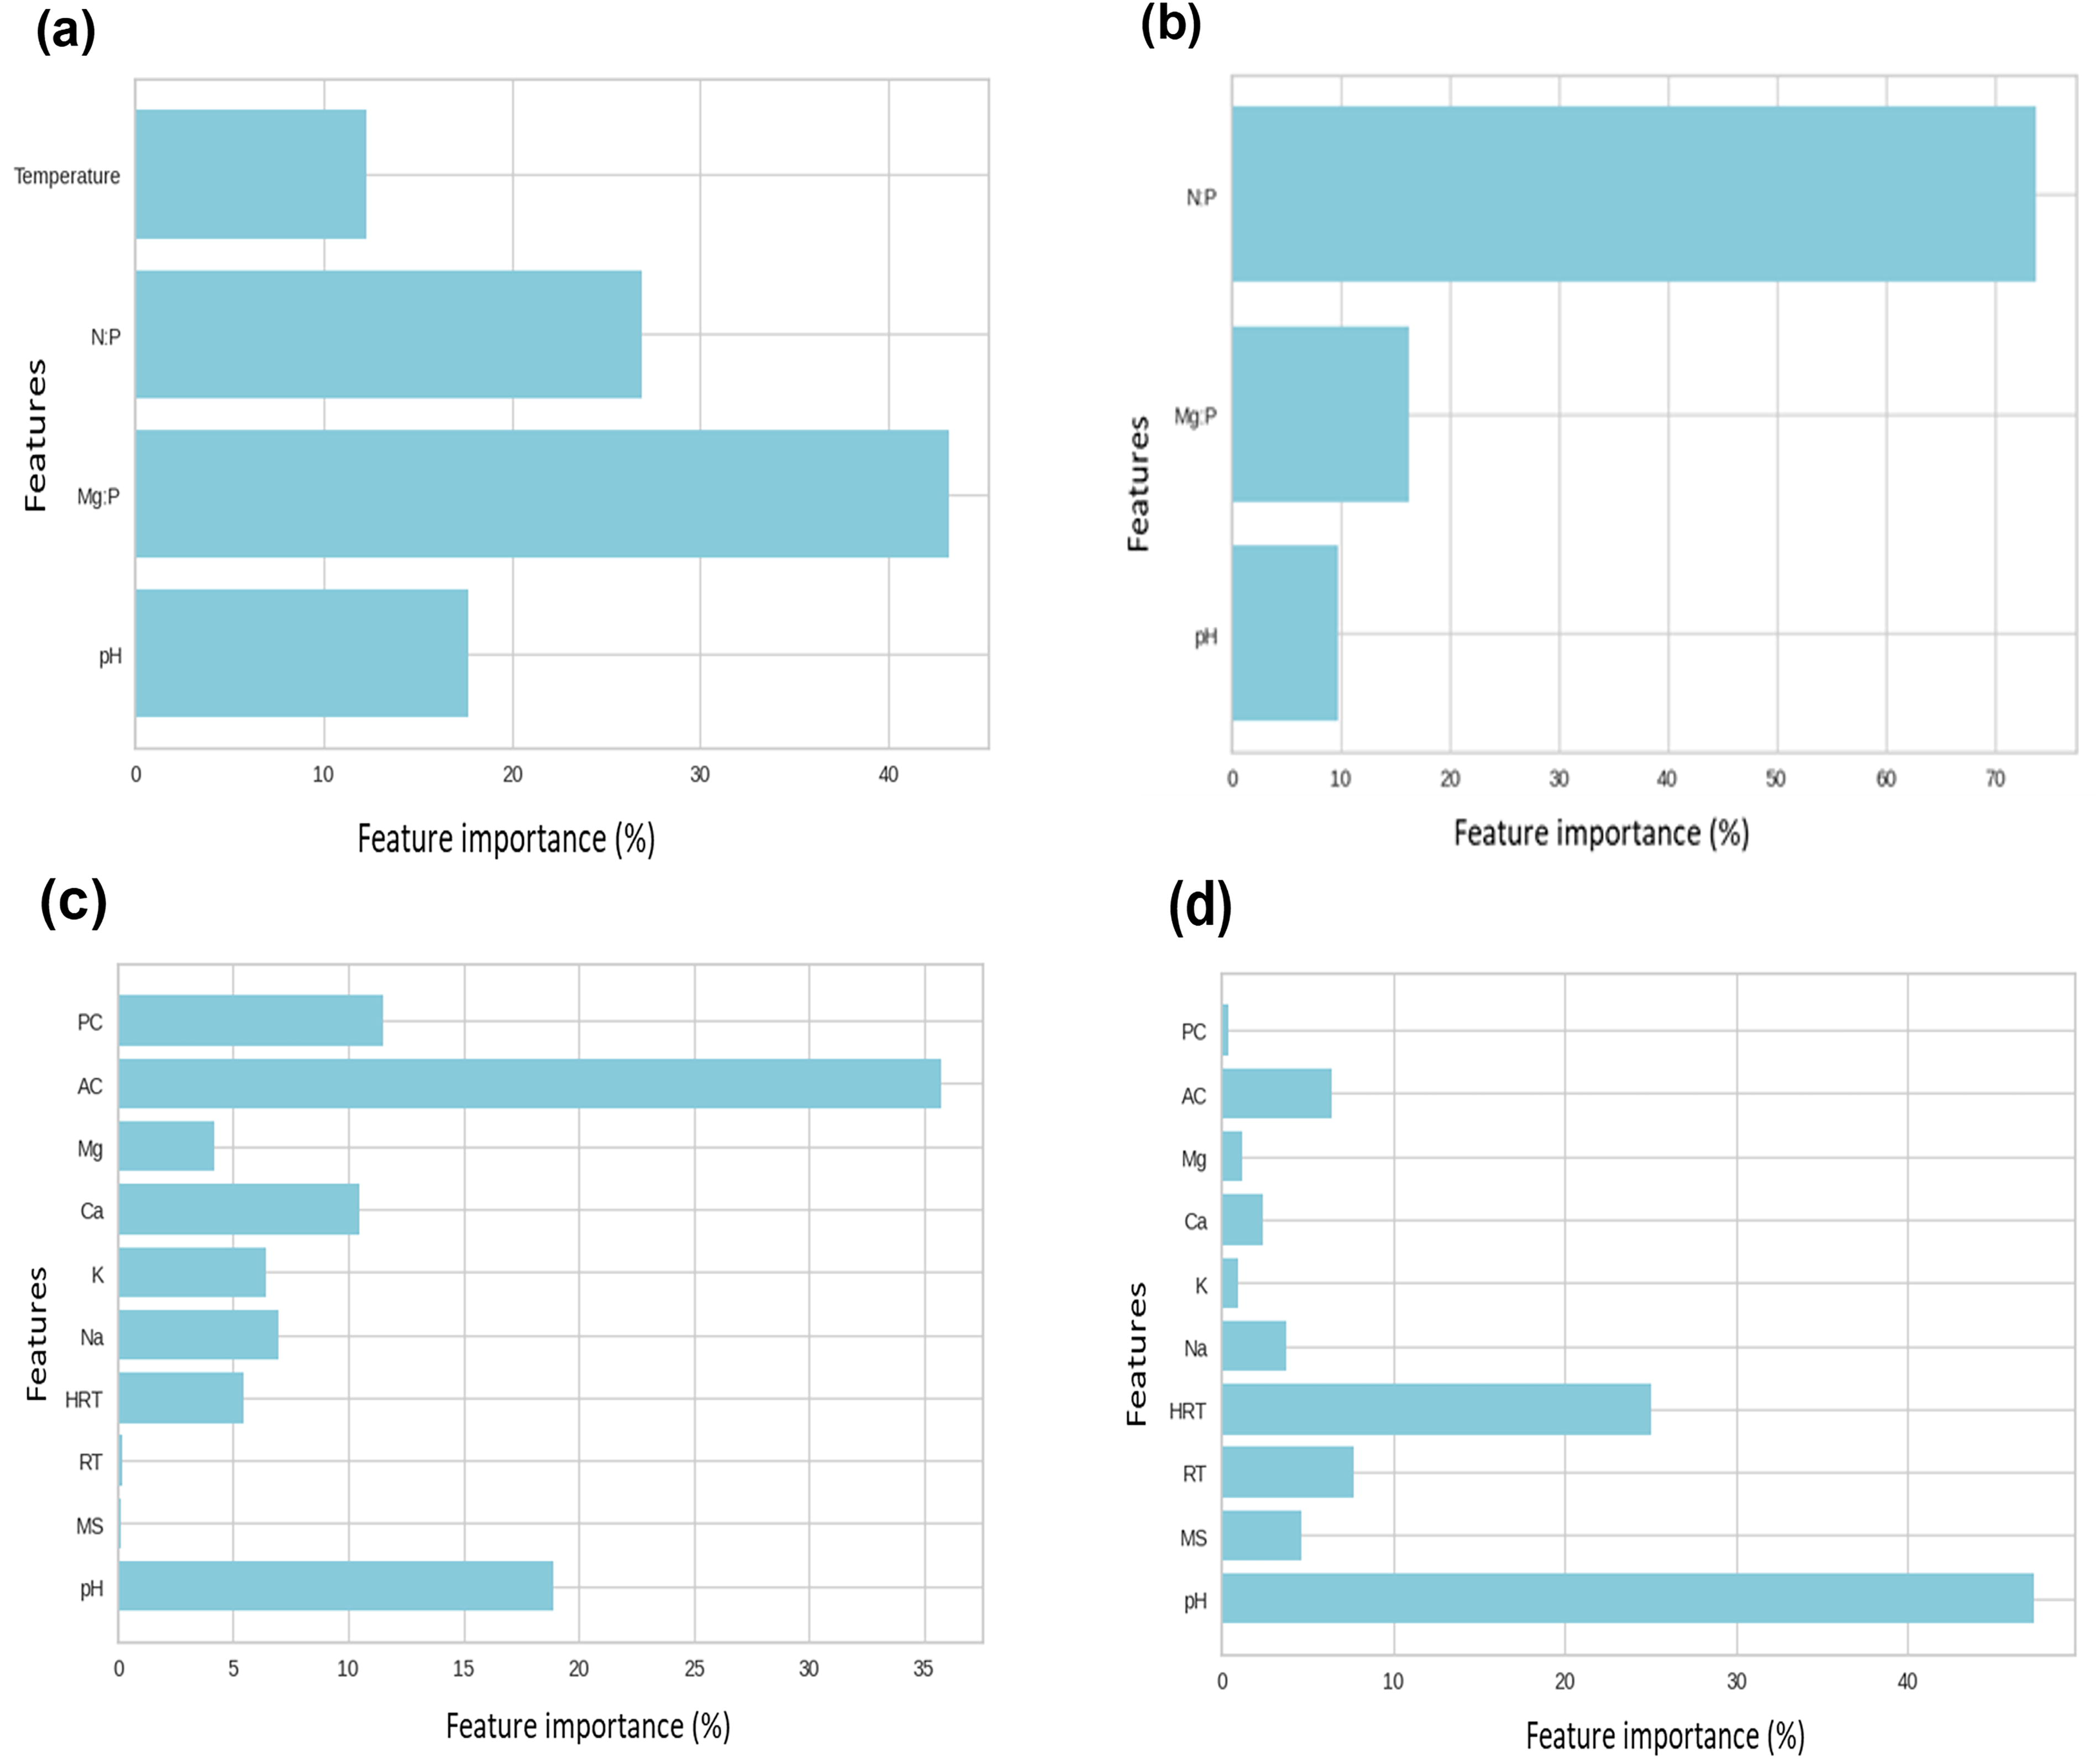
Feature importance analysis results. RF model for
Figure 5C shows the association between different input variables and the efficiency of PO43− recovery in XGBoost, Combination 8 (Scenario II). The ammonium concentration is the most important parameter influencing PO43− recovery (>35% of the contribution). According to the literature, pH values of 7–11 are considered the optimum value for PO43− and NH4+ recovery (Balaguer-Barbosa, 2018; Hakimi et al., 2020; Otieno et al., 2023). Consistent with previous literature, pH values ranged from 8 to 11 (Supplementary Table S3) showed the second highest impact on PO43− recovery with more than 15% of the total contribution in our study (Fig. 5c).
The results indicated that mixing speed played a relatively minor role in predicting the outcomes of the models using Combinations 8 and 9. Mixing speed usually enhances crystal nucleation and the process of struvite growth (Korchef et al., 2023). The optimum mixing speed values that enhance the production of large crystals range between 100 and 200 rpm (González-Morales et al., 2019). The range mixing speed in this study was 150–700 rpm, which is slightly higher than the optimum range reported in the literature, which could explain its limited effect on nutrient recovery (Korchef et al., 2023; Perwitasari et al., 2023). High values of mixing speed could increase the breaking of struvite crystals, affecting the struvite growth and PO43− recovery (Siciliano et al., 2020). The intensity of mixing speed affects other factors as well, such as the reaction time (which was not considered in this study) and the molar ratio of Mg:N:P, thereby affecting the nutrient recovery by struvite (Rodlia et al., 2020). González-Morales et al. (2019) found that the PO43− recovery was not affected by the mixing speed, which is consistent with our findings. On the contrary, the contribution of the reaction temperature (ranging between 20°C and 25°C; Supplementary Table S3) to the prediction model was very low compared with the other parameters.
Struvite precipitation is usually influenced by the presence of foreign ions in the solution, such as calcium, potassium, and sodium (Hakimi et al., 2020). According to a previous study (Kubar et al., 2021), calcium and potassium concentrations enhance PO43− recovery efficiency. Our results showed that calcium had the third higher contribution to the prediction model along with PO43− concentration (around 12%), while potassium concentration ranked fourth along with sodium (around 8%) (Fig. 5c).
The low contribution of magnesium (<5%) to the model could be explained by the low variability of Mg2+ concentrations compared with that of NH4+ concentration in the wastewater source (Supplementary Table S3). Also, the results showed that HRT (operational parameter) had less contribution (<6%) on the model compared to pH (around 19%). According to the results, ammonium concentration and the reaction pH had the highest contributions to the prediction decision (>53%).
For NH4+ recovery, most of the significant influence on the prediction model was carried out by the operational parameters, HRT, and pH (around 85% of the total contribution) (Fig. 5d). The reaction pH (8–11) had the most significant impact, with more than 47% of the total contribution. It was reported by previous studies (Otieno et al., 2023; Rodlia et al., 2020) that when pH values are within the optimum ranges (7–11), an ideal effect on struvite crystallization and NH4+ recovery can be achieved. The contributions of HRT, reaction temperature, and mixing speed in the NH4+ recovery prediction model were higher than those of the PO43− recovery prediction decision (25%, 8%, and 5%, respectively). The concentrations of coexisting cations such as calcium, sodium, and potassium had a low significant impact on NH4+ recovery. The presence of coexisting cations in wastewater, such as calcium, sodium, and potassium cations, can replace magnesium ions in wastewater and hinder the formation of struvite and reduce the recovery of NH4+ (Ye et al., 2018). Results showed that phosphate and magnesium concentrations (<1% and <5%, respectively) had a low contribution in predicting the outcome.
Implications of the developed models
This study is considered the first to predict nutrient recovery efficiency from digestate of various organic waste streams using multiple statistical and ML models. In previous literature, only small sample sizes (∼7 data points) of digestate along with a combination of other wastewater sources were used to develop ML models (Nageshwari et al., 2022). Comparing the performance of different ML models (e.g., compare R2 values) with previous studies can be quite challenging due to the variation in data collection procedure that includes input variables and sample sizes. As part of our study, we investigated the influence of various sample sizes, the number and type of input variables, and the use of statistical and ML models to predict the efficiency of recovering phosphorus and nitrogen from organic waste digestate by struvite precipitation. The overall results showed that ML models performed better than statistical models in predicting nutrient recovery efficiency using struvite precipitation, and the effect of sample size was less apparent compared to the effect of input variables. Notably, there is a dearth of literature addressing the application of data-driven models to assess the struvite precipitation efficiency of digestate. We utilized literature studies to develop a general model that organic waste management facilities can use to mitigate eutrophication and generate fertilizer to support food security. Therefore, the potential impact of this work on the general public is to cost-effectively promote nutrient recovery in existing organic waste using data science.
In the past, only theoretical models, such as the chemical equilibrium model, were used to estimate nutrient recovery efficiency. Using Visual MINTEQ, a chemical equilibrium model, Çelen et al. (2007) estimated PO43− recovery from liquid swine manure through struvite precipitation. The model’s input variables were magnesium, calcium, potassium, orthophosphate concentration, NH4+ concentration, alkalinity, and pH. The results showed that the PO43− recovery efficiency was 97% based on actual experimental values. The same model, Visual MINTEQ, was applied by a previous study (Jia et al., 2017) to optimize the NH4+ recovery from anaerobic digester effluent. This study showed that Mg2+:PO43− significantly affected NH4+ recovery and achieved over 96% efficiency through the prediction model. Based on the results of the studies, it is possible to use data-driven models to achieve similar outcomes without the necessity of performing laboratory experiments and consuming money on the supplies for such experiments. Future researchers can integrate the RF and XGBoost models developed in this study with theoretical models like MINTEQ to develop hybrid models to inform further improved predictions (Mehrani et al., 2022). One way to develop hybrid models would be to predict the efficiency of nutrient recovery using theoretical models first and then predict the errors of the actual and predicted values using the ML models (Quaghebeur et al., 2022; Xu et al., 2024).
The results suggest that ML methods can benefit the modeling, forecasting, and decision-making processes related to the process of struvite precipitation. This could be very effective for large-scale integrated systems (anaerobic digesters and struvite precipitation) as an integrated resource recovery system for energy and fertilizer. ML models could help solve problems related to feedstock fluctuations and optimize the treatment of digestate for each digestion case (e.g., monodigestion and codigestion). Accordingly, the ML models presented in this study may assist system operators in better-optimizing control parameters, for example, using response surface methodology (RSM). RSM is a statistical method that investigates the relationship between different factors and responses and helps optimize the process outcomes (Pereira et al., 2021). The developed models could be tested using the optimal conditions of the experiments. This could help validate these models’ predictions and ensure the desired results. For example, typical RSM applications in literature are conducted using small datasets (n = 10–30) depending on the experimental procedures (Zaki et al., 2023). Therefore, a potential way to further improve the optimization capabilities of RSMs in struvite precipitation could be to utilize our developed models with higher sample sizes (n = 74–1,026). This could help operators further improve decision-making through increased statistical significance of the optimized control parameters. Additionally, using this approach could increase the amount of nutrients recovered for fertilizer production (such as nitrogen and phosphorus) and improve the economic viability of AD systems to manage organic wastes. Finally, the optimization of different parameters controlled by the system could contribute to achieving other relevant SDG goals such as SDG 1 (No Poverty), SDG 2 (Zero Hunger), and SDG 12 (Response Consumption and Production).
In many rural areas of the world, improper disposal of organic waste from organic waste management facilities is causing pollution in the environment. Our model can help the managers of these facilities to effectively integrate nutrient recovery into their facilities, which can help accelerate not only the reduction of nutrient pollution (addressing SDG 6 and 14) but also help local communities to gain revenues by selling the struvite as fertilizers (SDG 1 and SDG 12).
Conclusion
This study investigated the efficiency of nutrient recovery (PO43− and NH4+) from organic waste digestate via struvite precipitation. Determining nutrient recovery efficiency for any source of organic feedstock typically requires a series of laboratory experiments, which can be expensive and time-consuming. Statistical and ML models were employed to predict the nutrient recovery efficiency of struvite precipitation. After testing different scenarios, results indicated that ML models could provide better predictions compared to statistical models. The tree-based ML models (RF and XGBoost) showed the best predictions for PO43− and NH4+ recovery. Changing the sample size had no clear impact on developing data-driven models, as the only two sample sizes that positively impacted the ML models were in two different ranges: n = 506 and n = 74. At the same time, the comparison of different combinations indicated that the input variables (pH, Mg:P and N:P molar ratios, reaction temperature, HRT, concentrations of ammonium, and phosphate) were the best choices to predict PO43− and NH4+ recovery (%). More experimental data are needed to improve the models in the future. Additionally, ML models need to be developed, considering a feedstock type as a predictor in future studies. The practical application of our models has three benefits. First, the model can be used as a cost-effective tool by organic waste management facilities to promote nutrient recovery in rural areas. Second, the scientific communities can utilize this model to develop hybrid models for improved predictions. Third, the model can promote a circular economy and address SDGs to mitigate global climate change issues related to waste management.
Footnotes
Authors’ Contributions
H.A.: Conceptualization, data curation, formal analysis, investigation, methodology, validation, visualization, writing–original draft, and writing–review and editing. M.T.Z.: Investigation, methodology, software, and writing–review and editing. K.D.O.: Conceptualization, project administration, supervision, and writing–review and editing.
Author Disclosure Statement
No conflict of interest.
Funding Information
No funding to disclose.

References
Supplementary Material
Please find the following supplemental material available below.
For Open Access articles published under a Creative Commons License, all supplemental material carries the same license as the article it is associated with.
For non-Open Access articles published, all supplemental material carries a non-exclusive license, and permission requests for re-use of supplemental material or any part of supplemental material shall be sent directly to the copyright owner as specified in the copyright notice associated with the article.
