
Abstract
Microplastics are ubiquitous environmental pollutants, yet little is known about their transport and distribution in large rivers. This study quantified and characterized microplastics under varying flow conditions and throughout the water column of the Mississippi River (United States). Temporal samples were collected from the river’s surface at St. Louis, Missouri, every ∼4 days during a historic flood in 2019 (n = 21) and biweekly under lower flow conditions in 2019–2020 (n = 7). The microplastic concentrations (6.0 ± 3.0 counts/L) and compositions (predominantly fibers that were frequently clear, blue, black, and red) in our temporal samples did not fluctuate as a function of discharge or other indicators of new water inputs (e.g., specific conductivity and turbidity). When we assessed samples collected throughout the Mississippi River’s water column (n = 10) at East Alton, Illinois, we found that the microplastic amounts (7.0 ± 3.5 counts/L) and assemblages (mostly clear, blue, black, and red fibers) were similar to the time series samples. We observed no relationship between water velocity and microplastic abundances across the channel. Instead, microplastic quantities near a developed bank with heavy barge traffic were higher than those found near the opposite, forested bank. Localized variations in land use may thus explain the minor differences in microplastic concentrations across the river. The microplastic amounts did not change as a function of water column depth. Nevertheless, we saw some evidence of varying microplastic compositions between surface and deeper samples, which is potentially the consequence of dissimilarities in polymer buoyancy. Microplastic chemostasis and homogeneity at our Mississippi River sites during a historic flood event contrast with prior observations of changing microplastic amounts and assemblages during discharge perturbations. Our results may therefore indicate variable transport processes with river scale that could be applicable to additional segments of the Mississippi River or other large river systems.
Introduction
Microplastic pollution of terrestrial and aquatic ecosystems has become a global concern as evidence rises for their ubiquity (Akanyange et al., 2022). However, controlling and mitigating microplastic contamination represents a significant challenge to resource managers because microplastics are a diverse suite of pollutants that vary in morphology, size, polymer composition, and chemical additives (Athey and Erdle, 2022; Frias and Nash, 2019; Rochman et al., 2019). Moreover, because of their small size (<5 mm), a variety of species, including humans, can easily inhale or ingest microplastics, leading to negative health consequences (Cox et al., 2019; Jenner et al., 2022; Leslie et al., 2022; Rochman et al., 2014).
Rivers connect terrestrial sources of microplastic pollution to their ultimate sink in the global ocean (Eriksen et al., 2014; Jambeck et al., 2015; Law and Thompson, 2014; Rochman, 2018). Despite enhanced particulate transport during periods of high flow (Karimaee Tabarestani and Zarrati, 2015), past studies of microplastics in fluvial systems have largely focused on their quantification and characterization during low flow conditions (Baldwin et al., 2016; Dris et al., 2015; McCormick et al., 2016). The few assessments of perturbations in microplastic conveyance during floods typically obtain a limited number of samples during events (usually only before and after flooding or during and after flooding, with samples commonly collected weeks to months apart). Researchers have thus reached conflicting conclusions about microplastic transport mechanisms in riverine settings, with studies finding that flood events entrain (Hurley et al., 2018), do not change (Treilles et al., 2022), or dilute (Scircle et al., 2020) microplastics in rivers. A few efforts to explore microplastic transport at higher temporal resolutions (e.g., weekly, daily, or hourly) in small streams have concluded that microplastic conveyance is positively correlated with discharge (e.g., Baraza and Hasenmueller, 2023; Hitchcock, 2020). However, we have not yet assessed microplastic movement at high temporal resolutions through large river systems during flooding conditions, despite the significant implications of fluctuating pollutant loads to the global ocean.
Spatial studies exploring microplastic distributions through the water columns of surface water features are also uncommon, particularly in fluvial environments (Liu et al., 2020). While longitudinal assessments of rivers are becoming more prevalent, most studies do not incorporate cross-sectional or depth sampling regimes (Range et al., 2023), despite the potential for lateral and vertical changes in plastic amounts and assemblages due to variable water velocities through rivers (Haberstroh et al., 2021) combined with the diverse range of plastic sizes, morphologies, densities, and biofouling (Horton and Dixon, 2018; Kaiser et al., 2017; Khatmullina and Isachenko, 2017; Waldschläger and Schüttrumpf, 2019). For example, assessments of lateral distributions of microplastics and floating macroplastics (plastics ≥5 mm) in rivers have demonstrated their heterogeneous abundances across channels (Dris et al., 2018; van Emmerik et al., 2018). Furthermore, specific morphologies like microfibers have been shown to be homogeneously distributed with river depth (Dris et al., 2018), but lower density polymers can be more prevalent near the water’s surface (Lenaker et al., 2019; Pasquier et al., 2023). Ascertaining the distribution of microplastics laterally and vertically through rivers is critical because of the potential for underestimating or overestimating their loads when sampling from a fixed point at the water’s surface.
We therefore tested how microplastic concentrations and characteristics vary with flow and within the water column for the Mississippi River, which is the largest river system in North America. To achieve this goal, we investigated microplastic amounts and assemblages across the historic 2019 flood event (the longest and second largest flood on record for the river), then compared those results to lower flow conditions following flooding. We also analyzed the spatial distribution of microplastics laterally and vertically within the water column of the Mississippi River to assess if they varied with river velocity or other channel characteristics.
Study Site
We sampled two locations on the Mississippi River close to its confluence with the Missouri River near St. Louis, Missouri, (Fig. 1) to test how microplastic amounts and characteristics vary during flow perturbations on large river systems. With a total watershed area of 3.2 million km2 and annual discharge of ∼530 km3 to the Gulf of Mexico (USGS, 2024), the Mississippi River is the largest river in North America by both area and volume. The combined effects of river engineering, land use alterations, and climate change have contributed to increasing flood frequency and severity on the river (Criss and Luo, 2017). Indeed, in 2019, the second largest flooding event on record occurred along the Mississippi River, with its peak flow at St. Louis reaching levels 4.88 m above flood stage. The 2019 peak stage value was only 1.09 m below St. Louis’s record stage during the Great Flood of 1993 (USGS, 2024). The Mississippi River 2019 flood was also the longest flood on record, lasting from 16 March 2019 to 20 July 2019 (totaling just over 125 days) and causing 6.2 billion dollars in damage (Reed et al., 2020). Given the uniqueness of this extreme flow event, we selected this flood to investigate microplastic abundances and assemblages during discharge perturbations on large river systems.

Materials and Methods
Field data and sample collection
We collected water samples for our temporal microplastic assessments from the Mississippi River at St. Louis, Missouri, which is situated below its confluence with the Missouri River (Fig. 1). The samples were obtained approximately every 4 days across the 2019 flood (i.e., sampling dates from May 6, 2019, to July 30, 2019; n = 21) and biweekly under lower flow conditions (i.e., sampling dates from October 15, 2019, to January 16, 2020; n = 7). All samples were collected from the river’s surface in white, 1-L polypropylene bottles housed inside a white, polyvinyl chloride sampling apparatus lowered from the Eads Bridge to the river on a bright orange nylon rope. The river water was collected from the bridge to obtain samples from the channel’s midpoint and because boat traffic was banned near St. Louis for much of the flood event. We opted for plastic sampling equipment at the Eads Bridge because prior attempts to sample with glass and metal materials resulted in damaged equipment and sample loss (e.g., shattered glass bottles and bent metal buckets) due to rapid river currents and the >27 m between the water’s surface and the bridge’s deck. We accounted for potential contamination of our samples due to our use of plastic field equipment via our quality control and quality assurance methods.
We also obtained spatial samples of microplastics within the Mississippi River’s water column at East Alton, Illinois, by boat on June 6, 2019, for five sites at two depths (Fig. 1). This sampling date was 2 days before the record stage for the 2019 flood event (i.e., 14.03 m on June 8, 2019; USGS, 2024). The East Alton location (which is 31.8 river km upstream of the St. Louis site) was selected for the water column microplastic distribution analysis because boat traffic was banned on the Mississippi River at St. Louis during portions of the flood event. During our assessment, samples were collected at five stations (Stations A–E) spanning the width of the channel (Fig. 1). At each lateral sampling station, one surface water sample was collected by hand using a 1-L white, polypropylene bottle. The water velocity at 60% of the total river depth (i.e., 0.6-depth) generally represents the average velocity of the water column, so a second sample was collected at this depth increment using a weighted, clear, acrylic Van Dorn sampler and decanted into a 1-L white, polypropylene bottle. Plastic equipment was used at the East Alton sampling location to be consistent with our field methodologies at the St. Louis site (see our quality assurance and quality control measures). We recorded water velocity with a Teledyne Marine RiverRay Acoustic Doppler Current Profiler (ADCP) to determine its relationship with microplastic distribution in the channel at the East Alton site. The ADCP was attached to a three-hull catamaran connected to the boat via a cable and pulled across the width of the river. Data were processed using Teledyne Marine’s WinRiver II software. The ADCP’s accuracy was ±0.25% for velocity, ±1% for depth, and ±3 mm for spatial coordinates (Teledyne Marine, 2018).
During all our field visits, river water was analyzed for basic water quality parameters. A YSI Professional Plus Multiparameter handheld meter measured specific conductivity, temperature, dissolved oxygen, and pH data. A Hach 2100P Portable Turbidimeter was used to collect turbidity data.
Laboratory sample analyses
Upon our return to the laboratory, water sample volumes were measured, then the samples were filtered through 0.45-μm mixed-cellulose acetate filters using a glass vacuum filtration device. Each resulting filter was placed in a glass petri dish that was loosely covered with aluminum foil to air-dry for 24 h. The dried filters were then visually assessed for suspected microplastics using a Motic SMZ-168 Series stereomicroscope at 5× magnification, allowing for their quantification down to 100 µm. Microparticles were identified as “suspected” microplastics if they lacked cellular or organic structures, had distinct and homogeneous color, and were malleable and resistant to breakage. Fibers were classified as suspected microplastics only if they had uniform thickness across their entire length. The microparticles were categorized by their shape (i.e., fiber, fragment, film, bead, or foam), size, and color.
All suspected microplastics were then confirmed to be comprised of plastic or plastic blends using the “hot needle test” (Campbell et al., 2017; Kapp and Yeatman, 2018; Lusher et al., 2017; Silva et al., 2018), which entailed exposing the microparticles to a hot needle to see if they would deform or melt (i.e., a positive result) versus burn or have no response (i.e., a negative result). We acknowledge that the hot needle test has several limitations, including its tendency to destroy samples, potential to generate false negatives for thermally resistant polymers, and inability to distinguish among polymer types (which contrasts with material characterization techniques like Fourier transform infrared spectroscopy, Raman spectroscopy, and pyrolysis gas chromatography mass spectrometry). Nevertheless, the method has been shown to identify a variety of synthetic materials with >90% accuracy when following established procedures (see Beckingham et al., 2023).
Quality assurance and quality control measures for the microplastic analyses
To reduce and account for contamination of our microplastic samples from the Mississippi River, we wiped down all workspace surfaces before handling samples, triple rinsed all equipment in deionized water before use, opted for nonplastic equipment when possible (except in the field due to the risks of damaged gear and sample loss), used gloves when handling samples, wore white cotton laboratory coats while assessing samples, limited the number of people that entered the laboratory during sample treatments, and kept samples and equipment covered when the samples were not being processed (Brander et al., 2020; Wesch et al., 2017). We also assessed replicate environmental samples (to determine the reproducibility of our methods) as well as blanks comprised of deionized water (to evaluate the level of background contamination from our sample collection and processing techniques). At the St. Louis site, triplicate river water samples were collected on May 6, 2019, and June 9, 2019, and triplicate blanks were collected in the same manner as the environmental samples on May 6, 2019. At the East Alton site, duplicate river water samples were collected at both the surface and 0.6-depth intervals at Station A on June 6, 2019. Triplicate blanks were collected on the same day using both the hand sampling method (to simulate sample collection at the river’s surface) and the Van Dorn sampling method (to simulate sample collection at 60% of the river’s total depth). Microplastic concentrations in our blanks are presented separately from the data for river water samples (i.e., our environmental sample data are not background-corrected).
Results
Temporal variations in water quality parameters and microplastics
Discharge for the Mississippi River at the St. Louis site (Fig. 1) was significantly and negatively correlated with specific conductivity (r = −0.39, p = 0.04; Fig. 2A), dissolved oxygen (r = −0.63, p < 0.01), and pH (r = −0.79, p < 0.01) but significantly and positively correlated with turbidity (r = 0.51, p = 0.01; Fig. 2B) and temperature (r = 0.60, p < 0.01). Of the water quality parameters we evaluated, specific conductivity demonstrated two distinct trends with discharge (where r ≤−0.82 and p < 0.01 for the individual trends; Fig. 2A), which likely resulted from changes in the dominant water signature we sampled at our selected monitoring location. Because boat traffic was banned on the Mississippi River near St. Louis for much of the 2019 flood, we had to sample from a pedestrian path on the Eads Bridge to access the center of the river. At this bridge location, the Mississippi River and Missouri River are not fully mixed (Jordan, 1965; Meade and Moody, 2010). The Missouri River typically has a higher specific conductivity signature than the Mississippi River for the same discharge value at the site because it drains the drier western United States (Winston and Criss, 2003). Thus, the two distinct trends in these data likely resulted from variations in which river signature was being sampled.

The relationships between discharge and
All 28 of the time series samples from the Mississippi River at the St. Louis site contained microparticles comprised of plastic or plastic blends (Fig. 2C–E) that deformed or melted when exposed to a hot needle (i.e., confirmed microplastics). The average and standard deviation of the microplastic concentrations for all the samples was 6.0 ± 3.0 counts/L, with a range of 1.1–13.0 counts/L. However, the microplastic concentrations did not have significant correlations with discharge or any of the other water quality parameters we measured (i.e., specific conductivity, turbidity, temperature, dissolved oxygen, or pH), even when we accounted for potential differences in the dominant river chemical signals (see examples in Fig. 2C–E).
We found diverse assemblages of microplastics in the Mississippi River across the sampling period (Fig. 3). Most of the microplastics were fibers (97.9%), while 2.1% were films. Fibers were longer than films, with length averages and standard deviations of 2.1 ± 2.2 mm (range = 0.1–15.0 mm) and 0.1 ± 0.1 mm (range = 0.1–0.4 mm), respectively. When the fibers and films were further categorized by color, we found that the fibers were 45.2% clear, 21.7% blue, 11.6% black, 10.0% red, and 11.5% other colors (see Fig. 3 for details on other color assemblages), while the observed films were 56.9% blue, 33.3% red, and 9.8% clear. We found that microparticle attributes (i.e., morphology, length, and color) did not correlate with discharge or the measured water quality parameters.
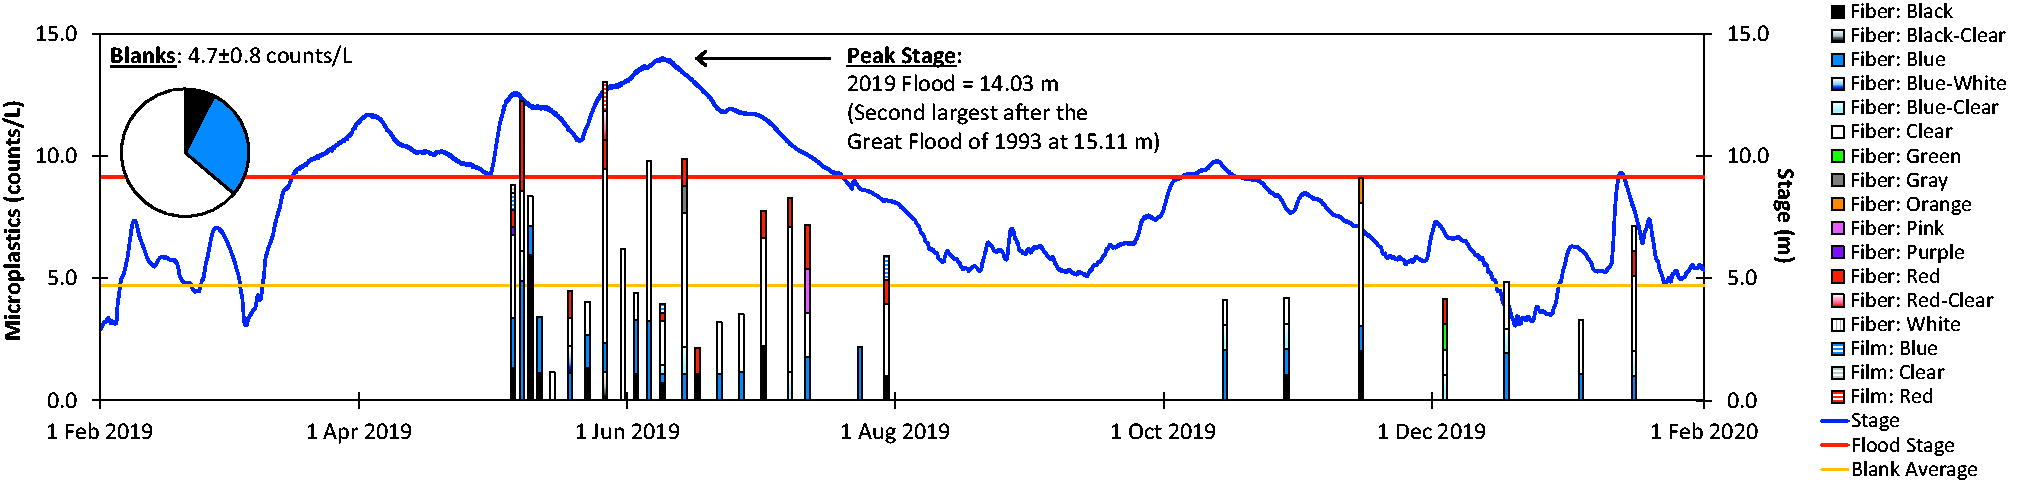
Microplastic concentrations and categorizations for each sample collected from the Mississippi River at St. Louis as well as the average concentration and categorization of microplastics in triplicate field blanks. Stage for the Mississippi River (blue line; data from USGS, 2024), the flood stage value for the Mississippi River (red line), and the average blank concentration (yellow line) are shown.
The average and standard deviation of microplastic concentrations for the triplicate blanks collected on May 6, 2019, was 4.7 ± 0.8 counts/L, which was a higher concentration than we observed in 14 of our 28 environmental samples (Fig. 3). The blanks were comprised only of clear (63.9%), blue (28.6%), and black (7.5%) fibers. While these fiber colors were frequently found in our environmental samples, the blanks did not contain any of the other fiber colors or films that we observed in the Mississippi River samples from the St. Louis site.
Spatial variations in water quality parameters and microplastics
For the samples collected through the Mississippi River’s water column on 6 June 2019 (i.e., 2 days before peak flow for the flood) at the East Alton site (Fig. 1), we found that temperature, dissolved oxygen, and pH varied ≤10.5% among Stations A–E and had no trends across the channel. In contrast, specific conductivity varied 17.8% and decreased from Station A to Station E (i.e., towards the southwest across the channel). Turbidity varied by 21.4%, increasing from the northeast to the southwest side of the river.
All 10 of the spatial samples from the Mississippi River at the East Alton site contained microparticles comprised of plastic or plastic blends (Fig. 4) that melted or deformed when exposed to a hot needle (i.e., confirmed microplastics). The average and standard deviation for the microplastic concentrations in all the samples was 7.0 ± 3.5 counts/L, with a range of 2.0–12.7 counts/L. Laterally, the highest microplastic concentrations were found near the northeast bank of the river (i.e., Station A’s average for both depths was 11.2 counts/L), and their abundances generally decreased towards the southwest side of the river (Fig. 4). The microplastic concentrations were therefore significantly and positively correlated with specific conductivity and significantly and negatively correlated with turbidity. No correlations were observed between microplastic abundances and temperature, dissolved oxygen, and pH. Using a paired t-test, we observed no significant differences in microplastic concentrations with depth (p = 0.71).
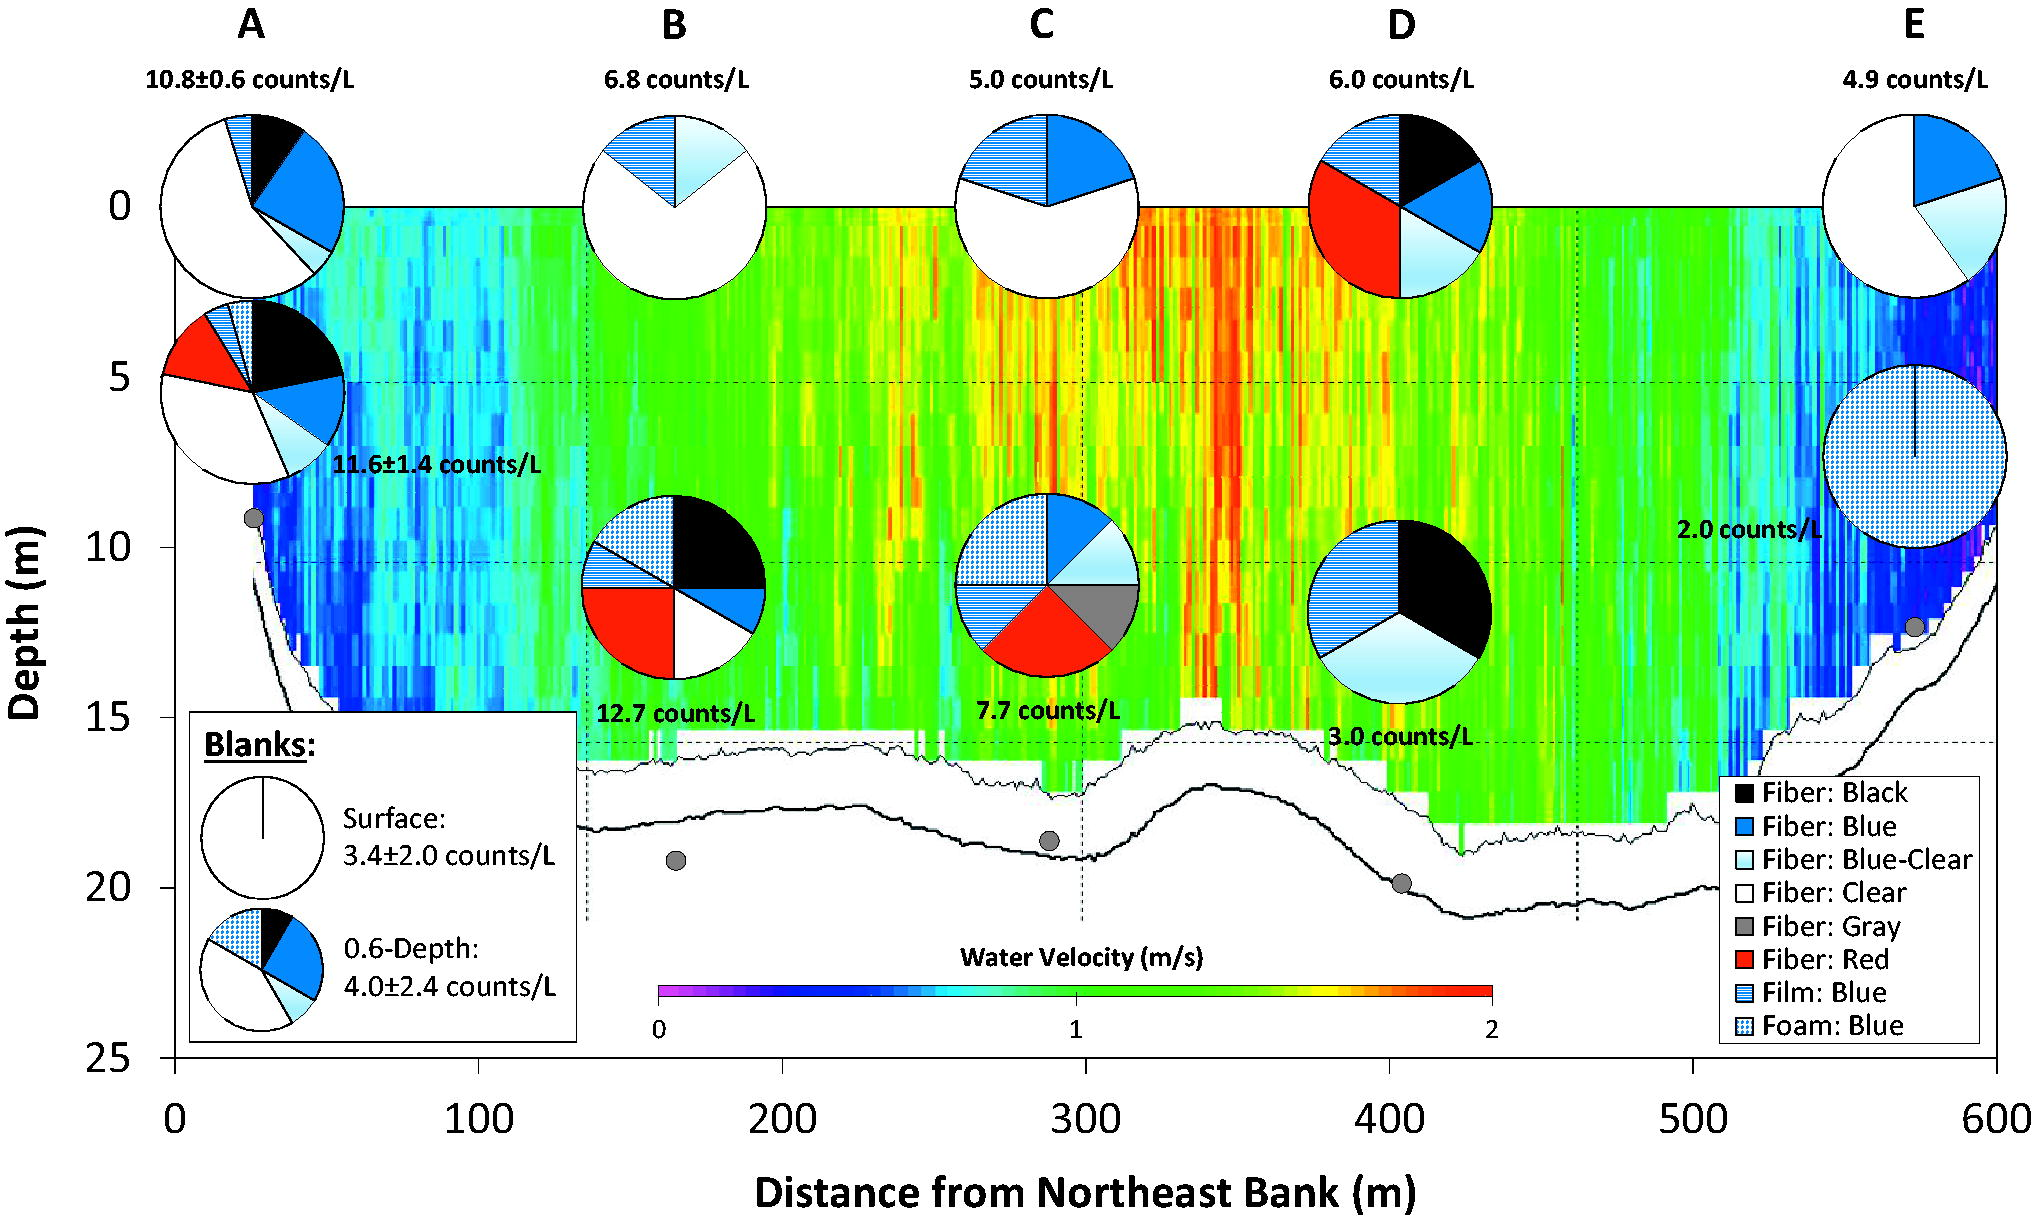
Lateral and vertical variations in microplastics in the Mississippi River channel at the East Alton site superimposed on the river’s velocity profile. Microplastic samples were collected at two depths (i.e., the surface and 0.6-depth) at five stations (i.e., Stations A–E). Pie charts show the relative abundance of each microplastic morphology and color combination for the samples, with the center of each pie chart positioned at the depth the sample was collected. Each sample concentration is listed next to the appropriate pie chart, where the data for Station A are the averages and standard deviations of duplicate samples, while the data for Stations B–E represent single samples from each location. The averages, standard deviations, and compositions of microplastics in triplicate field blanks are also shown. The gray circles indicate river bed depth measured with the boat’s sonar at each sample site, while the thick and thin black lines respectively indicate the total river depth and water velocity measurement depth limit obtained by the ADCP.
Microplastic morphologies at the East Alton site included 80.8% fibers, 9.9% films, and 9.3% foams. Fibers (1.6 ± 1.4 mm) were again found to be longer than films (0.3 ± 0.5 mm). Foams (0.1 ± 0.1 mm) were shorter than fibers but were not significantly different in length from films. When we further categorized the fibers by color, we found that 40.6% were clear, 15.9% were blue, 15.4% were black, 15.1% were red, 11.3% were blue-clear, and 1.7% were gray. All the films and foams were blue. The fiber and film concentrations were similar between the surface and 0.6-depth samples (11.6% and 1.0% different, respectively), but foams were only found at depth. We did not observe significant differences in the length of fibers or films with depth.
We found lower microplastic concentrations in our triplicate surface blanks (3.4 ± 2.0 counts/L) than in all the surface river water samples, and these blanks consisted of only clear fibers (Fig. 4). The average and standard deviation of the microplastic concentrations in the triplicate 0.6-depth blanks was 4.0 ± 2.4 counts/L, which was higher than values for the 0.6-depth environmental samples at Station D and Station E (Fig. 4). We observed more variety in microplastic morphologies and colors in the 0.6-depth blanks than the surface blanks, with the former including fibers that were clear (41.7%), blue (25.0%), black (8.3%), and blue-clear (8.3%) as well as foams that were blue (16.7%; Fig. 4). The microplastic morphologies and colors in the 0.6-depth blanks were observed in the 0.6-depth river water samples, though never in the same ratios. For example, the 0.6-depth blanks were dominated by clear fibers, which were largely absent from the 0.6-depth river water samples. Moreover, red fibers, gray fibers, and blue films were observed in the 0.6-depth environmental samples, but not in the 0.6-depth blanks.
Discussion
Microplastic amounts and assemblages during a major flooding event on the Mississippi River compared with prior study results
We found that microplastic concentrations (6.0 ± 3.0 counts/L) and assemblages (97.9% fibers that were mostly clear, blue, black, and red) in the Mississippi River at St. Louis across the historic 2019 flood (Fig. 3) were comparable to other findings for smaller lotic systems in the region. Our average microplastic abundance was slightly higher than values observed in a local tributary stream (documented to be less than the researchers’ 4.5 counts/L limit of detection; Hernandez and Hasenmueller, 2024) and similar to concentrations found in a stream that emerges from a cave and flows directly into the Mississippi River (recorded at 9.2 counts/L in Baraza and Hasenmueller, 2023, and 7.1 counts/L in Hasenmueller et al., 2023). These previous studies also detected a predominance of clear, blue, and black fibers (>80%) in their samples.
When compared with other microplastic datasets collected for the Mississippi River, we found that the average concentration of 11.6 counts/L and the majority fiber assemblage (>96%) observed by Martin (2018) in samples obtained along the river’s mainstem and major tributaries during low flow conditions resembled our results. Our observed microplastic levels were higher than the 1.5 counts/L average value found for the Mississippi River at St. Louis during low discharge by Rochman et al. (2022), though the study’s data were blank-corrected. When we likewise corrected our data with our average blank value (4.7 counts/L), we obtained nearly the same result (1.3 counts/L) as the Rochman et al. (2022) study. However, Rochman et al. (2022) observed more fragments (47%) in their Mississippi River samples, with fibers only accounting for 50% of the microplastic morphologies. This dissimilarity in the prevalence of fibers between the studies may be due to differences in where the samples were acquired from the river, with Rochman et al. (2022) obtaining samples at the riverbank, while samples for this study were collected from the center of the river. Indeed, certain microplastic morphologies reported at the center of the Seine River (Paris, France) were found to triple in concentration at the riverbanks (Dris et al., 2018).
In contrast, an investigation of microplastics in the Mississippi River mainstem and its major tributaries for single sampling events during (May 2019) and after (August 2019) the flood found consistently higher microplastic levels than those observed in our study (Scircle et al., 2020). For the Mississippi River at St. Louis, they found average microplastic concentrations of 28 counts/L during the flood and 60 counts/L after the flood, representing values ∼5–10× higher than those observed in our assessments. Like the Rochman et al. (2022) study, Scircle et al. (2020) also described more fragments (85% of the quantified morphologies) than we did in our samples. These differences in observed microplastic concentrations and compositions may be due to several factors. Scircle et al. (2020) obtained samples from the bank instead of the middle of the channel as we did, and, during the flood, they specifically noted site accessibility challenges and higher abundances of invertebrate exoskeletons in their samples that could adsorb the Nile red dye they were using to identify microplastics. They also reported microplastics down to ∼30 µm, and the most frequently detected size fraction in their evaluations was 30-90 µm. However, most studies, including ours, describe microplastic sizes down to ∼100 µm, potentially explaining our lower observed abundances.
Microplastics demonstrate chemostatic behavior and homogeneous assemblages during a historic flood event
Our temporal sampling suite at St. Louis across the historically large 2019 flood established that microplastic amounts and characteristics did not meaningfully change with discharge or other indicators of enhanced surface runoff to the system (e.g., decreased specific conductivity and increased turbidity; Figs. 2 and 3). Our microplastic concentration results were also remarkably similar to findings for the Mississippi River during low flow conditions (Martin, 2018; Rochman et al., 2022). However, previous research on small stream systems has shown that microplastic concentrations increase with elevated discharge (Baraza and Hasenmueller, 2023; Hitchcock, 2020). These higher microplastic levels during floods may be the result of enhanced atmospheric deposition during rainfall events (Allen et al., 2019), inputs from surface runoff (Cho et al., 2023; Piñon-Colin et al., 2020; Sun et al., 2023), or remobilization from channel bed sediment (Ockelford et al., 2020).
Scircle et al. (2020) observed lower microplastic amounts during their May 2019 flood sampling on the Mississippi River than when they sampled at lower flow conditions in August 2019, which they attributed to dilution effects. While our dataset did not overlap with the low flow August 2019 sampling event from the Scircle et al. (2020) study, we did sample during an interval of even lower flow following the flood and thus can still account for low discharge concentrations on the Mississippi River (see the river’s hydrograph in Fig. 3 for an evaluation of changing water levels at the St. Louis site). We again suspect that the discrepancies between our and Scircle et al.’s (2020) observations for the Mississippi River may be due to differences in the microparticle size category reporting and the respective protocols of sampling at the center of the channel versus the bank. Microplastics have been shown to accumulate along riverbanks compared to the center of the channel (Dris et al., 2018), and we confirmed that microplastic amounts could vary more than three-fold across the river during our spatial sampling campaign at the East Alton site (Fig. 4). Additionally, we observed large differences in microplastic sample concentrations between our site visits (Fig. 3), so the infrequent sampling campaigns (i.e., only two) of the Scircle et al. (2020) study were less likely to capture microplastic-discharge dynamics.
Collectively, our high resolution (i.e., biweekly down to subweekly) sampling results demonstrate that the Mississippi River experienced microplastic chemostasis and homogeneity during a historic flood event. To our knowledge, only one other study (Treilles et al., 2022) has reported constant microplastic concentrations and compositions during flooding on the large Seine River system (demonstrated with only three sampling events), which they attributed to intense waterway traffic consistently remobilizing bed sediment across flow conditions. The Mississippi River also usually features extensive barge traffic, though it was banned at the St. Louis site for much of our study period due to the severity of the 2019 flooding event. Thus, the chemostatic and homogeneous microplastic response that we observed for the Mississippi River during the 2019 flood could also indicate relatively consistent microplastic sourcing to the system. This behavior might occur on other large rivers that may homogenize microplastic signatures across their basins, but more work is needed to understand microplastic sourcing during flood events on large rivers.
Microplastic concentrations and attributes vary through the Mississippi River’s flooding channel
The average microplastic concentration and standard deviation close to peak flow through the Mississippi River’s channel at East Alton (7.0 ± 3.5 counts/L) was similar to what we observed for the temporal study at the St. Louis site (6.0 ± 3.0 counts/L). Of all the sampled stations at the East Alton site, the northeast bank (Station A) had the highest average concentration of microplastics, but the average microplastic level at the southwest bank (Station E) was ∼70% lower (Fig. 4). Though previous research has shown that microplastic concentration patterns can be driven by changes in water velocity (Kapp and Yeatman, 2018), we did not observe a relationship between river velocities through the channel and microplastic abundances (Fig. 4). Instead, water velocity was highest at the river’s surface in the center of the channel and decreased towards the wetted perimeter due to higher friction with the bed material.
The reason for the general pattern of decreasing microplastic concentrations moving northeast to southwest across the Mississippi River is unclear but may be related to differences in land use and barge traffic density on the two sides of the channel (see Fig. 1B). The northeast bank features roads and other developed areas, while the southwest bank is forested. Barge traffic is also denser on the northeast side of the river through the nearby Melvin Price Locks and Dam (Lock and Dam number 26), though barges were not transiting the river on the day of sampling due to travel disruptions from the flood. Higher microplastic levels along the more developed and traveled side of the river are consistent with our findings of elevated specific conductivity (an indicator of anthropogenic salt inputs) for that side of the channel as well as studies that have identified urbanization, population density, and waterway traffic as strong drivers of microplastic pollution in freshwater systems (Baraza et al., 2022; Browne et al., 2011; de Carvalho et al., 2021; Eriksen et al., 2013; Treilles et al., 2022). However, a negative correlation between microplastic concentrations and turbidity was detected across the channel, which is inconsistent with the hypothesis that human-induced sediment resuspension intensifies microplastic pollution (as proposed by Treilles et al., 2022).
Our results from the river channel assessment also indicated that microplastic abundances did not change significantly with depth, which aligns with findings from previous vertical surveys of rivers (Dris et al., 2018). This observation again suggests that variations in channel water velocities during the 2019 flood did not control microplastic concentrations through the water column since the river’s velocity decreased with depth (Fig. 4). However, we did detect depth-dependence for certain microplastic color–morphology combinations, which is consistent with prior studies of both freshwater and marine environments that established that microplastic assemblages can vertically stratify through waterbodies because of polymer density variations (e.g., Baldwin et al., 2016; Kooi et al., 2016; Lenaker et al., 2019). Indeed, gray fibers, red fibers, and blue foams were most common at 60% of the river’s total depth (Fig. 4). These variations in microplastic characteristics through the water column could similarly be due to density-related settling. However, we used a different method to obtain the 0.6-depth samples (i.e., collection in a weighted Van Dorn sampler) compared to our surface water samples (i.e., hand collection in bottles). While both the surface and 0.6-depth blanks had comparable average microplastic abundances that were both lower than most of the environmental samples, the latter contained more diverse color–morphology assemblages, including blue foams. The presence of blue foams only in the deepest samples may therefore be due to contamination. The 0.6-depth blanks nevertheless did not contain gray or red fibers, and the monochromatic microfibers in the surface blanks suggest that other sample colors at the river’s surface were not the result of contamination. Overall, our findings indicate that microplastics were relatively well mixed as a function of depth within the Mississippi River near peak flow for the 2019 flood event, though some types of plastics may have been subject to settling effects (e.g., gray and red fibers).
Recommendations for future work
Our study provides novel information on the behavior of microplastics during a historic flood on the Mississippi River, both across time and space. Nevertheless, future research on microplastic transport during flooding events is still urgently needed to best inform the scientific community, policymakers, and resource managers. These new investigations should further resolve variations in polymer compositions during floods. While the hot needle test we employed to confirm that our samples were comprised of plastic polymers has been shown to identify synthetic materials with >90% accuracy (Beckingham et al., 2023), this method cannot distinguish among polymer types. Upcoming studies should consequently use techniques that can identify various kinds of plastic (e.g., Fourier transform infrared spectroscopy, Raman spectroscopy, or pyrolysis gas chromatography mass spectrometry) to improve our understanding of how polymer types might change as a function of discharge, lateral position in the channel, and water column depth. Basin-wide research must also be conducted to evaluate microplastic sourcing to large rivers due to researchers reaching conflicting conclusions about microplastic conveyance during flood events (e.g., Baraza and Hasenmueller, 2023; Hitchcock, 2020; Hurley et al., 2018; Scircle et al., 2020; Treilles et al., 2022).
Conclusion
During the 2019 historic flood on the Mississippi River—which represents its longest and second largest recorded flood—we observed that microplastic pollution was consistently present in the river. Our high resolution (i.e., biweekly down to subweekly) sampling efforts across the flood demonstrated that microplastic concentrations and compositions did not meaningfully vary as a function of discharge or other indicators of new water sources to the system (e.g., specific conductivity and turbidity). Our findings therefore established that the studied reach of the Mississippi River experienced microplastic chemostasis and homogeneity during this large flood event, which contrasts with prior results for lotic systems that indicate floods can mobilize or dilute microplastic debris. Combined, these observations imply that heterogeneous microplastic sources across the catchment may be homogenized as they enter and transit the large river. When we assessed microplastic patterns within the river’s channel, we found no relationship between water velocity and microplastic abundance. Instead, localized land use differences may lead to minor variations in microplastic concentrations only near riverbanks. Microplastic amounts also did not vary as a function of water column depth. However, we saw some evidence of varying microplastic assemblages between surface and deeper samples, which is possibly the consequence of density-related settling of differing polymer types. Resolving temporal and spatial variations in microplastic concentrations and characteristics in large rivers such as the Mississippi River will aid researchers and resource managers in calculating their loads to the global ocean, thereby better informing future management and mitigation strategies. Our observations of microplastic chemostasis and homogeneity within the Mississippi River during a historic flood event could also be applicable to other large river systems and may indicate variable transport processes with river scale.
Footnotes
Acknowledgments
Dr. John Sloan and Miles Corcoran from the
Availability of Data and Materials
The datasets analyzed during this study are available from the corresponding author upon request.
Authors’ Contributions
E.A.H.: Conceptualization, methodology, validation, formal analysis, investigation, data curation, visualization, writing—original draft, funding acquisition, resources, supervision, and project administration. A.N.R.: Conceptualization, methodology, validation, formal analysis, investigation, data curation, visualization, writing—reviewing and editing, and funding acquisition
Author Disclosure Statement
The authors have no competing financial interests to disclose.
Funding Information
This work was funded by research grants from the Professional Association of Diving Instructors (PADI) Foundation (grant number