
Abstract
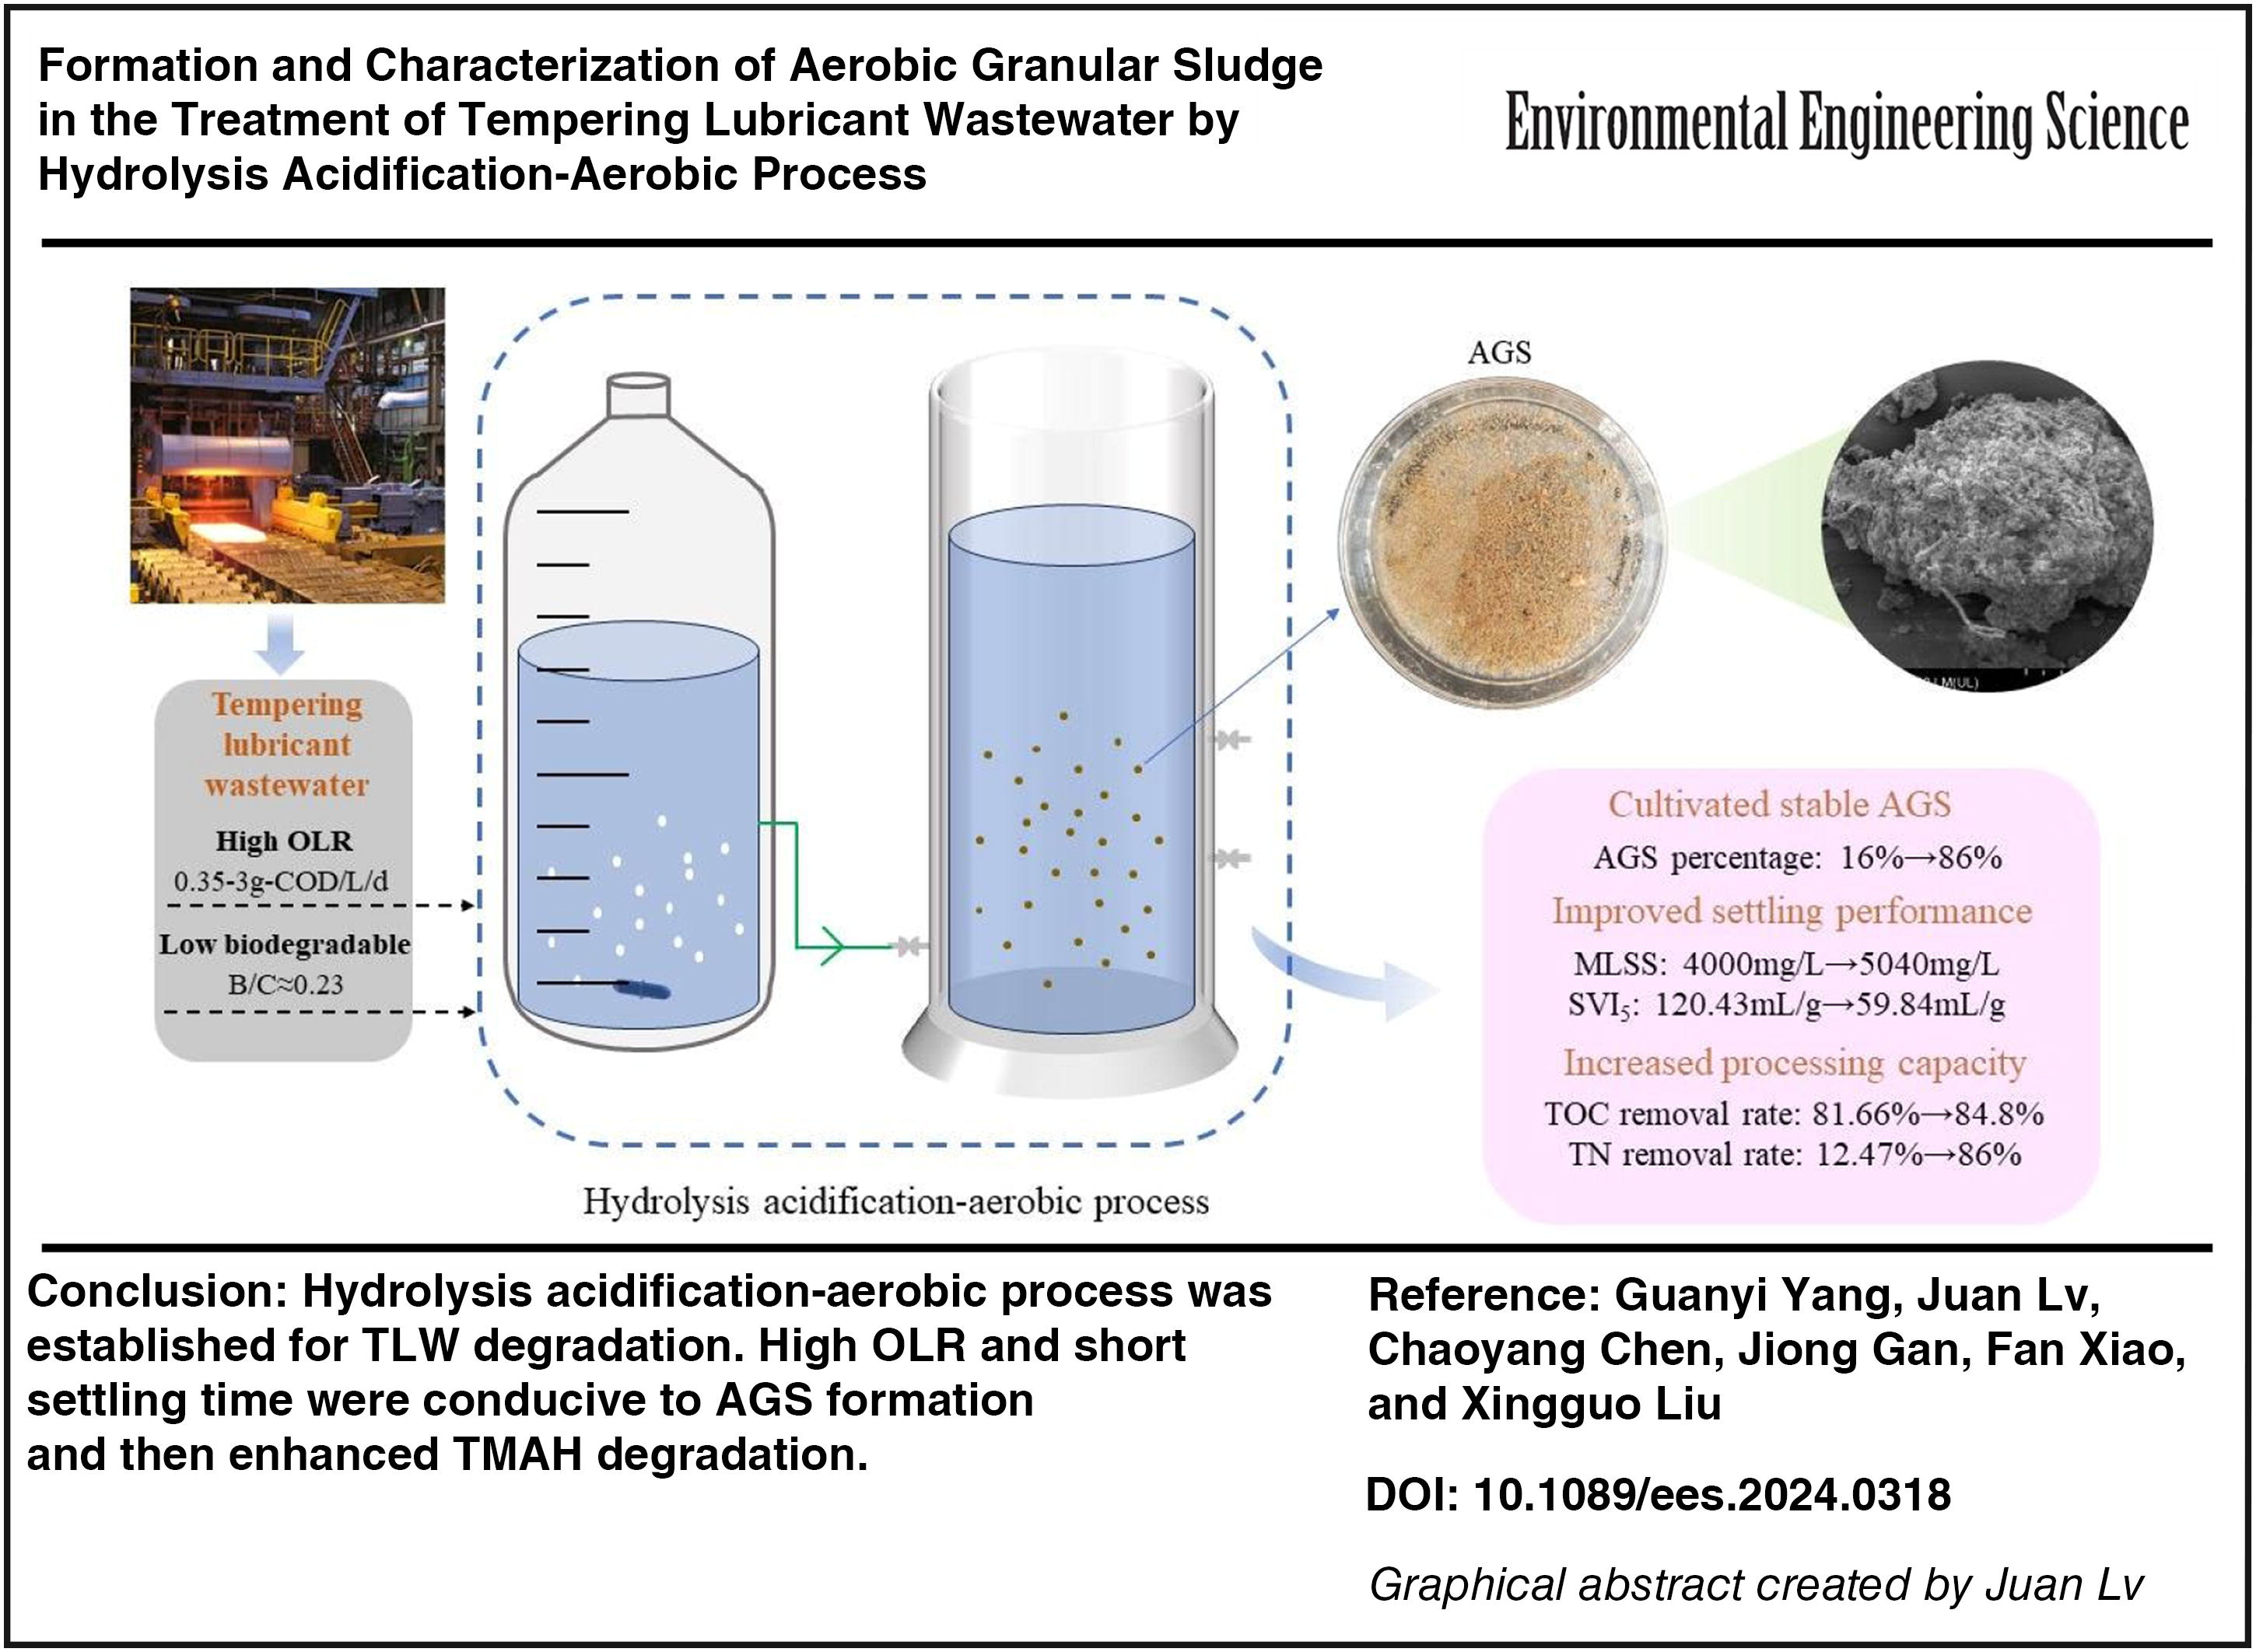
Tempering lubricant is widely used for the surface treatment of cold rolled strip in steel industry. The used tempering lubricant, along with the process rinse water, was referred to as tempering lubricant wastewater (TLW). TLW is characterized as high concentration of organic matter and total nitrogen (TN), and poor biodegradability, which is rarely treated independently. In this study, the performance of combined hydrolysis acidification-aerobic process for treating real TLW was assessed. A thorough investigation was undertaken to explore the formation process and characteristics of aerobic granular sludge (AGS) in the aerobic reactor. In addition, the characteristics of microbial community were analyzed. The results of 210 days monitoring showed that the hydrolysis acidification-aerobic process had a good effect on the treatment of TLW, with final Total organic carbon (TOC) and TN removal efficiencies reaching 84.8% and 86%, respectively. Meanwhile, AGS was formed in the aerobic reactor, with the proportion in the sludge of 86%. It was also found that higher organic loading rate contributed to AGS formation, while a shorter settling time enhanced the formation of compact and stable AGS. In addition, continuous increase in the consumption of Ca2+ and Mg2+ also promoted the granulation process of AGS. Proteobacteria, Bacteroidota, and Firmicutes were enriched in the hydrolysis acidification reactor, which were beneficial for refractory organic substances degradation. The abundance of Comamonadaceae increased in the aerobic reactor and contributed to TN removal.
Introduction
Tempering lubricant is the circulating liquid used in the wet leveling process of the cold rolling process, which was often directly discarded after one-time use (Zhao et al., 2023). Waste tempering lubricant is the main component of tempering lubricant wastewater (TLW), in addition to the flushing water with impurities during cold rolling process. Tempering lubricant was a mixture, and as its composition involved the patent secrecy, thus it was roughly known that it mainly contained lubricant, cleaning agent, corrosion inhibitor, bactericide and surfactant (Zeng et al., 2024). The chemical constituents of TLW consisted of fatty acids, alcohol amines, fatty acid esters, aromatic products and impurities during the rolling (hydraulic oil, Ca, Fe, Na, Cu, Mg, and Zn) (Jiang et al., 2021b; Zeng et al., 2024; Zhao et al., 2023). Therefore, TLW has high contents of organic matter and total nitrogen (TN), and the value of BOD5/COD is below 0.2 (Jiang et al., 2021b).
Currently, there is limited research on TLW treatment, as it is generally treated in conjunction with other cold-rolling emulsion wastewater (CREW) (Tang et al., 2021) through chemical, physical, and biological methods. Jiang et al. (2021b) investigated CREW degradation using UV/H2O2, and the COD concentration reduced from 3,573 mg/L to 67 mg/L. Huang et al. (2022b) utilized ceramic ultrafiltration membranes to treat CREW, achieving COD removal efficiency of 98.41%. Nevertheless, high cost is the challenge faced by most physical and chemical methods. Biological treatment has been proven to be advantageous for low cost, convenient operation, high efficiency, and minimal environmental impact (Jin et al., 2023). Aerobic and anaerobic fluidized membrane reactors were both efficient on COD removal for CREW treatment (Tang et al., 2021; Cheng et al., 2018). However, the process requires a larger area.
Compared with conventional activated sludge process, aerobic granular sludge (AGS) process requires 20% less space and decreases electricity requirements by 24%−40%; because of its layered structure, the granules can perform nitrification and denitrification simultaneously (Liu et al., 2023). Pan et al. (2024) utilized AGS for textile-dyeing wastewater treatment, with the COD removal efficiency reaching 77.2%. Cong et al. (2024) employed a vertical-flow continuous-flow reactor for rural domestic wastewater treatment with AGS generation. The average removal rates of COD and TN achieved 90% and 75%, respectively. Considering the high concentrations of organic matter and TN, AGS process may be applied to TLW degradation.
In our previous study (Lv et al., 2022), TLW degradation by anaerobic-aerobic combined process was conducted and achieved the removal efficiencies of TOC and TN of 86.2% and 81.5%, respectively. Concurrently, AGS formation was observed in the aerobic reactor, which has not been thoroughly investigated. Considering that anaerobic reaction has strict temperature requirement, the hydrolysis acidification process can be used as the pretreatment process.
Therefore, this study establishes a hydrolysis acidification-aerobic process for TLW treatment. Effort was exerted to explore the formation of AGS and its characteristics. Especially, the effects of process parameters on the formation of AGS were investigated. TOC and TN removal efficiencies of the combined process were also evaluated. In addition, microbial communities were analyzed.
Materials and Methods
Wastewater characterization
TLW was originated from the cold rolling process of a steel plant, with its characteristics detailed in Table 1. The pH of the influent was adjusted to 7.0 ± 0.1 with HCl (0.1 M) or NaOH (0.1 M). Influent COD concentration was controlled between 350 mg/L and 3,000 mg/L by dilution with distilled water. Necessary nutrient elements were supplemented in the influent to promote the growth of microorganisms: K2HPO4: 12 mg/L, CoCl2·6H2O: 0.72 mg/L, KH2PO4: 7.2 mg/L, NiCl2·6H2O: 0.72 mg/L, NH4Cl: 20 mg/L, MnSO4·4H2O: 0.6 mg/L, (NH3)2HPO4: 20 mg/L, CuSO4·5H2O: 0.2 mg/L, FeSO4·7H2O: 0.8 mg/L.
Characteristics of the Tempering Lubricant Wastewater
TN, total nitrogen.
Experimental operation
Batch experiments of hydrolysis acidification-aerobic process were conducted in high borosilicate glass reactors as shown in Supplementary Figure S1. The hydrolysis acidification reactor was stirred with a magnetic stirrer and operated at room temperature, with a working volume of 1.5 L. The reactor was filled with 1 L of influent. The aerobic reactor was mechanically stirred, with a working volume of 2 L. An air pump maintained the dissolved oxygen concentration at 5–6 mg/L. NaHCO3 was also added to supplement the alkalinity required for nitrification. The seed activated sludge was obtained from the recovered sludge of the secondary clarifier of a municipal sewage treatment plant in Shanghai. The mixed liquor suspended solids (MLSS) concentration of seed activated sludge was around 3,000 mg/L in the hydrolysis acidification reactor and 4,000 mg/L in the aerobic reactor. The 210-day operation of hydrolysis acidification-aerobic process was divided into two stages (seven phases, Table 2); the first stage including four phases (I, Ⅱ, III, and IV) was conducted for AGS formation and the subsequent stage (phase V, phase VI, and phase VII) focused on process optimization.
Operation Conditions of the Hydrolysis Acidification-Aerobic Process
OLR, organic loading rate.
During the stage of AGS formation, the process cycle consisted of a 24-h hydrolysis acidification treatment followed by a 24-h aerobic treatment. The organic loading rate (OLR) increased gradually from 0.35 ± 0.02 g-COD/L/d to 3 ± 0.2 g-COD/L/d (Table 2). The optimization stage (phase V–phase VII) involved the optimization of the hydrolysis acidification reactor and the stable operation of the aerobic reactor, which operated for 140 days. The cycle of the process comprised a 20-h hydrolysis acidification treatment followed by a 24-h aerobic treatment during the optimization stage. The detailed description of the experimental operation was included in Supplementary Data S1.
Samples were collected at regular intervals and analyzed after filtration through a 0.45-µm filter membrane. Particle size distribution and the extracellular polymer substance (EPS) of AGS were analyzed.
Physiochemical analysis
COD, BOD, NH4+, NO3−, NO2−, MLSS, mixed liquor volatile suspended solids (MLVSS), sludge volume index (SVI), Ca2+, Mg2+, alkalinity (acid-base indicator titration) were analyzed according to the standard procedures (Bridgewater et al., 2017). TOC and TN were determined using a TOC/TN analyzer (multi N/C 3100. Analytikjena. Germany). Particle size distributions of AGS were measured by a laser particle size analyzer (Malvern Mastersizer 2000, U.K.). DO concentration was detected by a DO analyzer (JPB-607A, LeiCi, China).
AGS characteristic analysis
Approximately 25 mL of mixed liquor in different phases of the aerobic reactor was placed in a petri dish for observation using a camera (Xiaomi 12S). The internal microstructure of the AGS was analyzed using a scanning electron microscope (SEM) (Leica CPD300, Germany). Before scanning, the samples were pretreated, including sampling, washing, fixing, and dehydration, which is described in Supplementary Data S2.
EPS can be classified into tightly bound EPS (TB-EPS) and loosely bound EPS (LB-EPS). TB-EPS and LB-EPS were extracted from the sludge samples according to a heat extraction method (Li and Yang, 2007) (Supplementary Data S3). In addition, protein (PN) and polysaccharide (PS) content were measured using the Coomassie blue staining method and anthrone-sulfuric acid method, respectively (Bradford, 1976; Frolund et al., 1995). The determination methods for specific ammonia oxidation rate (SAOR) and specific nitrate reduction rate (SNRR) are described in Supplementary Data S4.
Microbial community structure analysis
Bacterial community structures were analyzed by high-throughput sequencing. Sequencing was performed through Illumina’s Miseq PE300/NovaSeq PE250 platform (Shanghai Meiji Biomedical Technology Co., LTD.) according the method described in our previous study (Lv et al., 2022). The primers 338F (5′-ACTCCTACGGGAGGCAGCAG-3′) and 806R (5′-GGACTACHVGGGTWTCTAAT-3′) were utilized to amplify the V3-V4 variable region of the 16S rRNA gene through polymerase chain reaction. The raw sequencing sequences were subjected to quality control using the Fastp (Chen et al., 2018) software, followed by assembly with the Flash software (Magoč and Salzberg, 2011). Number of reads in the high-throughput sequencing was listed in Supplementary Table S1. In addition, the raw data sequences have been deposited in NCBI’s database, with the accession numbers ranging from SRR31895399 to SRR31895404.
Results and Discussion
Sludge characteristics and morphology of aerobic sludge
The variation of aerobic sludge morphology during the operation is shown in Figure 1. From phase I to phase II, the OLR increased from 0.35 g-COD/L/d to 1 g-COD/L/d, and the settling time was reduced from 30 min to 20 min. However, there was no significant variation in the morphology of the aerobic sludge, which remained as pale-yellow floc. The OLR increased to 2 g-COD/L/d (phase III) and visible AGS appeared in the reactor, indicating that higher OLR was conducive to AGS formation. The OLR further increased to 3 g-COD/L/d and the settling time was reduced to 15 min (phase IV). The quantity of sludge flocs decreased, while AGS increased with more irregular spherical particles. This suggests that reducing the settling time is beneficial for eliminating sludge flocs with poor settling performance and promoting sludge granulation. Ai et al. (2024) also confirmed that short settling time can enhance the development of dense AGS through generating higher hydraulic selective pressure. In phase V, hydrolysis acidification treatment was shortened from 24 h to 20 h. It seems that the proportion of AGS increased. It indicates that reducing the pretreatment time did not impact the sludge granulation. When the settling time reduced to 5 min (phase VII), more regular and compact AGS formed, exhibiting clearer outlines and morphology. The results indicated that setting a low OLR at the beginning and gradually increasing the OLR is conducive to stable and compact AGS formation, and gradually reducing the settling time can promote sludge granulation. The formation of larger granules at a high OLR was likely due to deep penetration of substrates inside granules without substrate limitation (Gao et al., 2011).
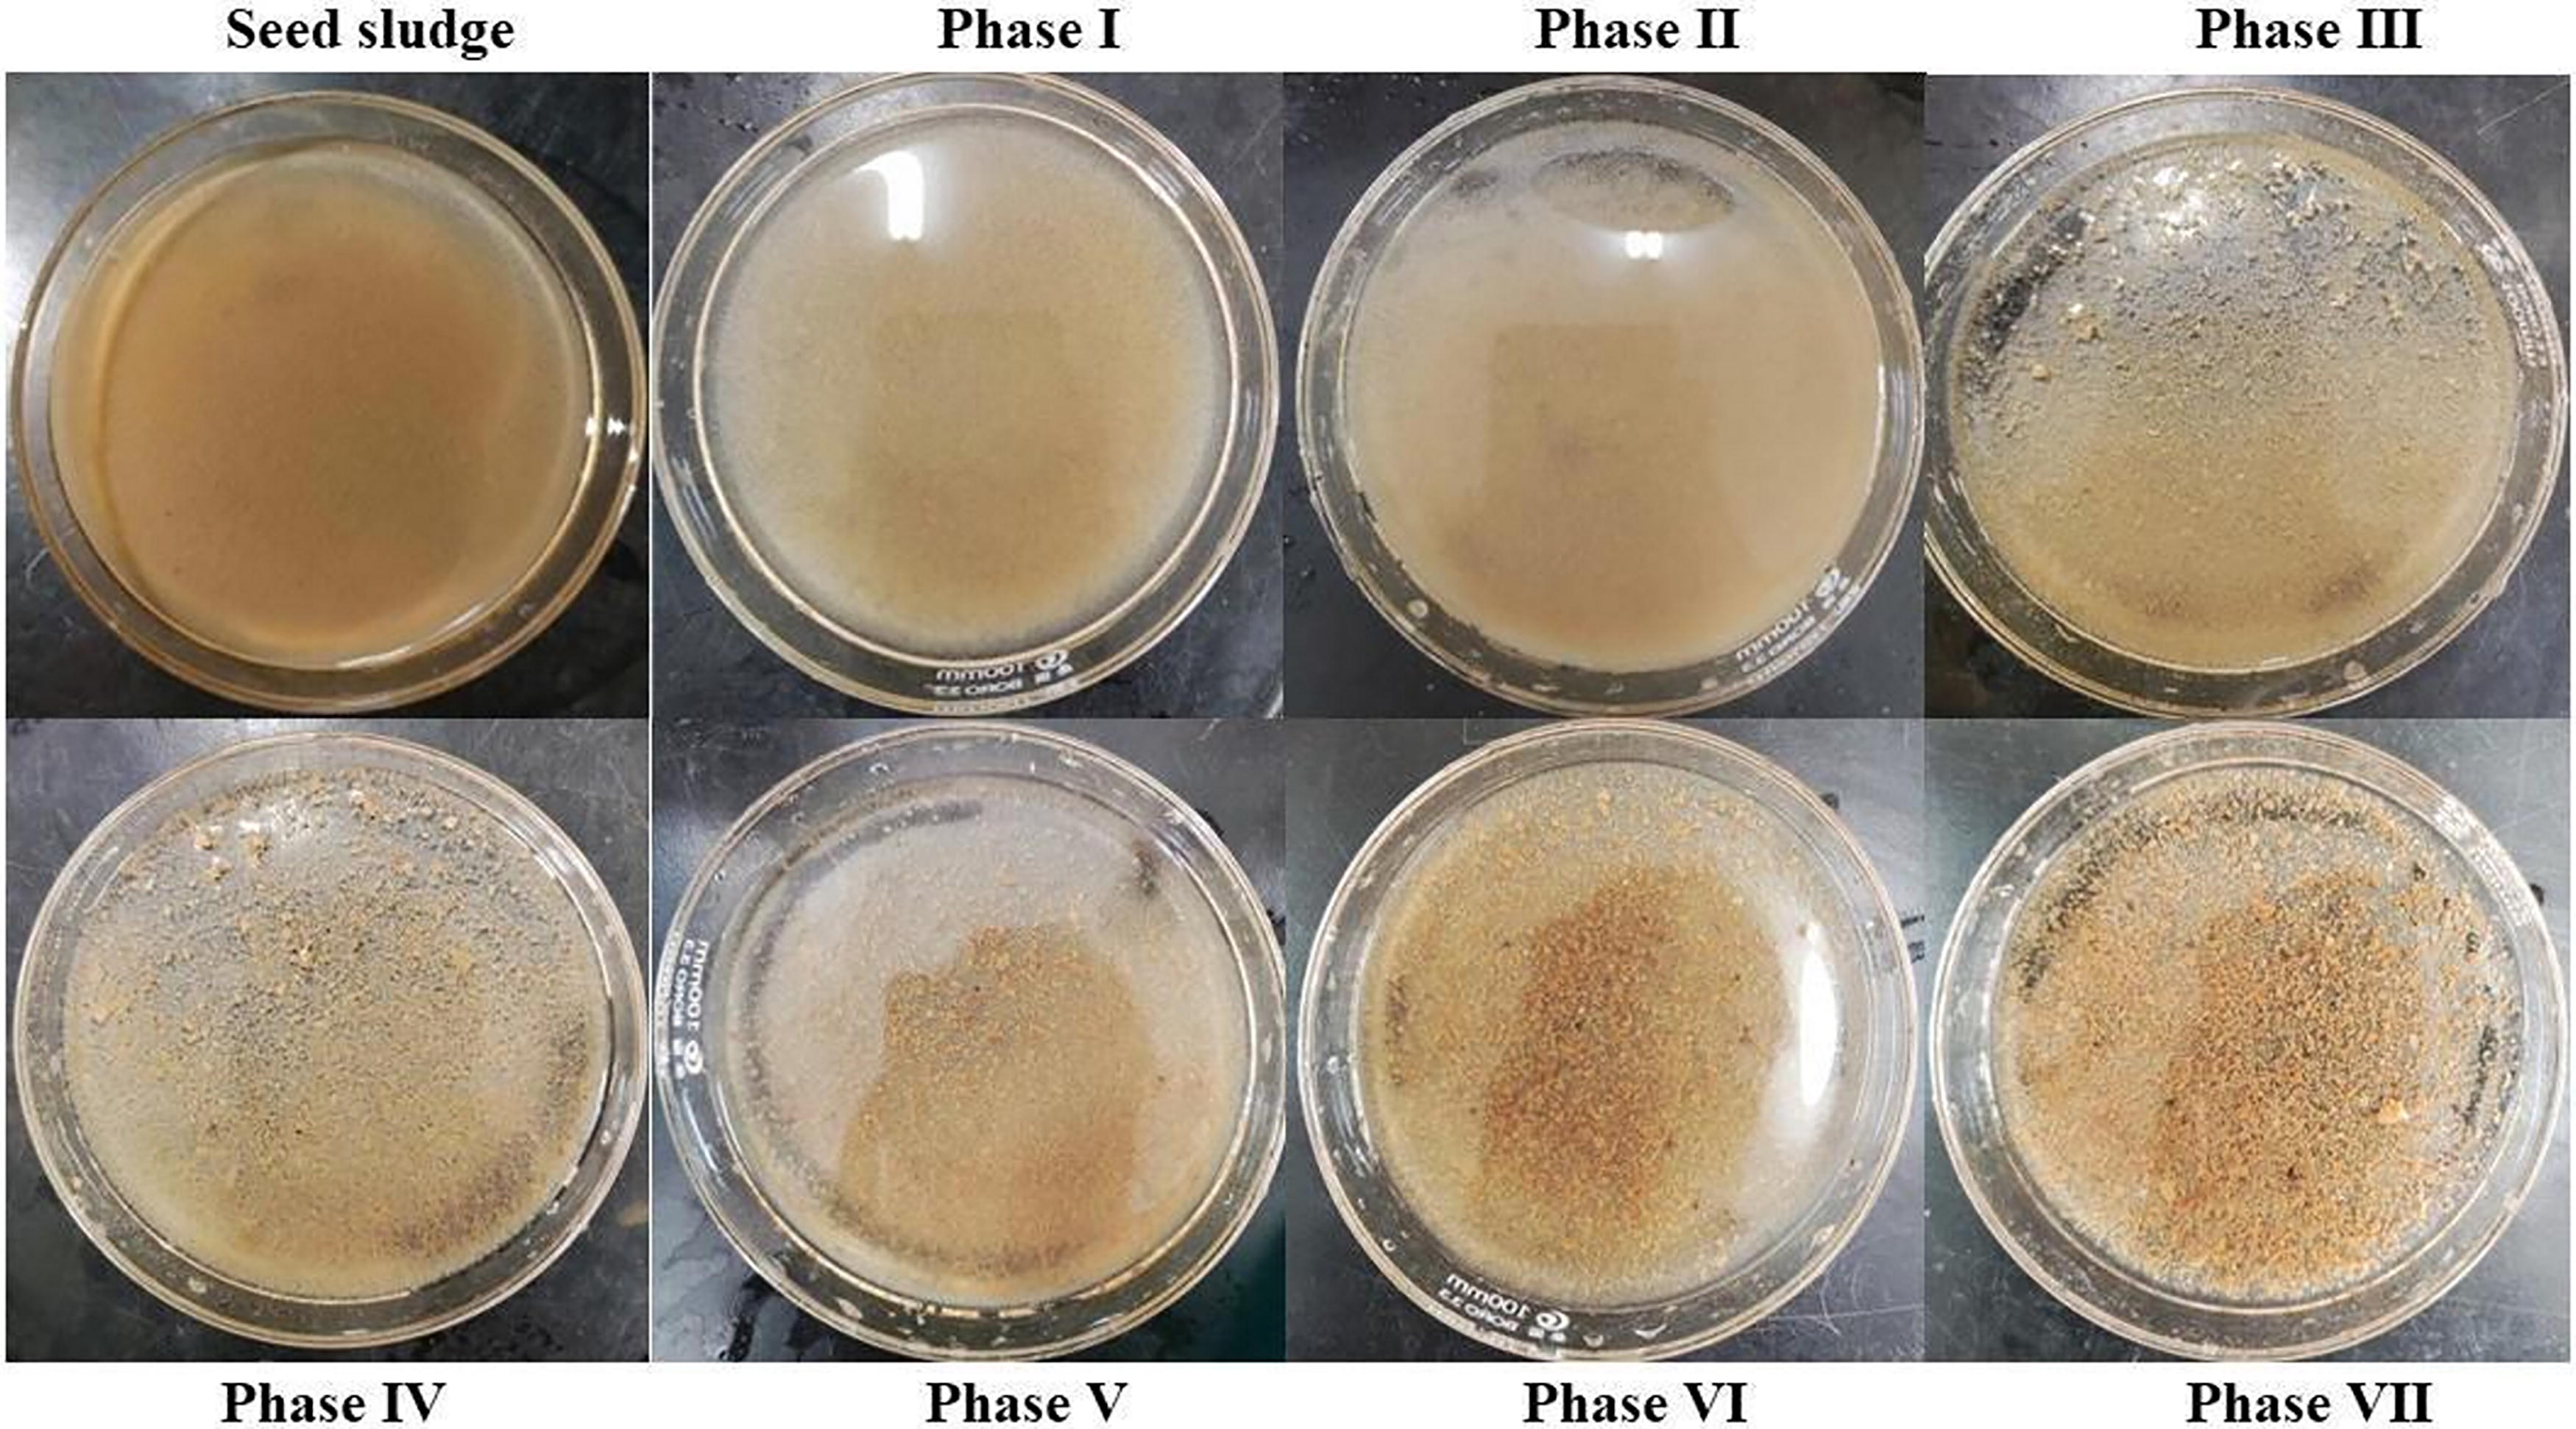
Morphology of aerobic sludge in each phase of the process operation.
Seed sludge and AGS (phase IV and phase VII) were also characterized by SEM (Supplementary Fig. S2). At low magnification (100 μm), the volume of AGS in phase IV was observed to be larger than seed sludge. The AGS was elliptical with clear outlines and a dense structure, exhibiting a larger surface area. At high magnification (5 μm), the surface of seed sludge was loose with indistinct pores and channels. In contrast, the AGS was primarily composed of well-formed rods and cocci, with clear gaps on the particle surface that facilitated oxygen and nutrient transfer. In phase VII, mature AGS was observed, with a stable structure predominantly composed of cocci and rods, and almost no filamentous bacteria. In addition, the bacterial floc was found on the surface, which further facilitated the structural stability and formation of the AGS (Li et al., 2021).
The particle size distribution of aerobic sludge was also assessed (Fig. 2). Typically, sludge with a particle size above 0.2 mm is defined as AGS (De Kreuk et al., 2007). As shown in Figure 2, the distribution of sludge particle sizes was categorized into four size ranges: <0.2 mm, 0.2–0.6 mm, 0.6–1 mm, and 1–2 mm. As the operation conducted, the proportion of sludge flocs (<0.2 mm) decreased from 84% (phase I) to 72% (phase IV). Meanwhile, the proportion of AGS gradually increased, mainly in the form of small-sized AGS (0.2–0.6 mm). In phase IV, the proportion of small-sized AGS reached 26%, which is consistent with the observations in Figure 1. In the optimization stage, the proportion of sludge flocs decreased to 14% (phase VII). Furthermore, AGS was mainly distributed in 0.2–0.6 mm and 0.6–1 mm range. The proportion of AGS in the 1–2 mm range kept at around 10% in phase VI and phase VII. This indicates that the AGS was primarily composed of compact and stable small-sized particles. It was reported (Toh et al., 2003) that when the AGS particle size is above 2 mm, microbial activity decreases. In this study, AGS with particle size larger than 2 mm was not observed, and the proportion of AGS increased to 86% in phase VII. It also indicated that higher OLR and shorter settling times promote AGS formation. Several studies also reported that same conclusion during synthetic wastewater treatment (Gao et al., 2011; Min et al., 2024). In this study, the results suggested that complex characteristics of real TLW did not inhibit AGS formation.
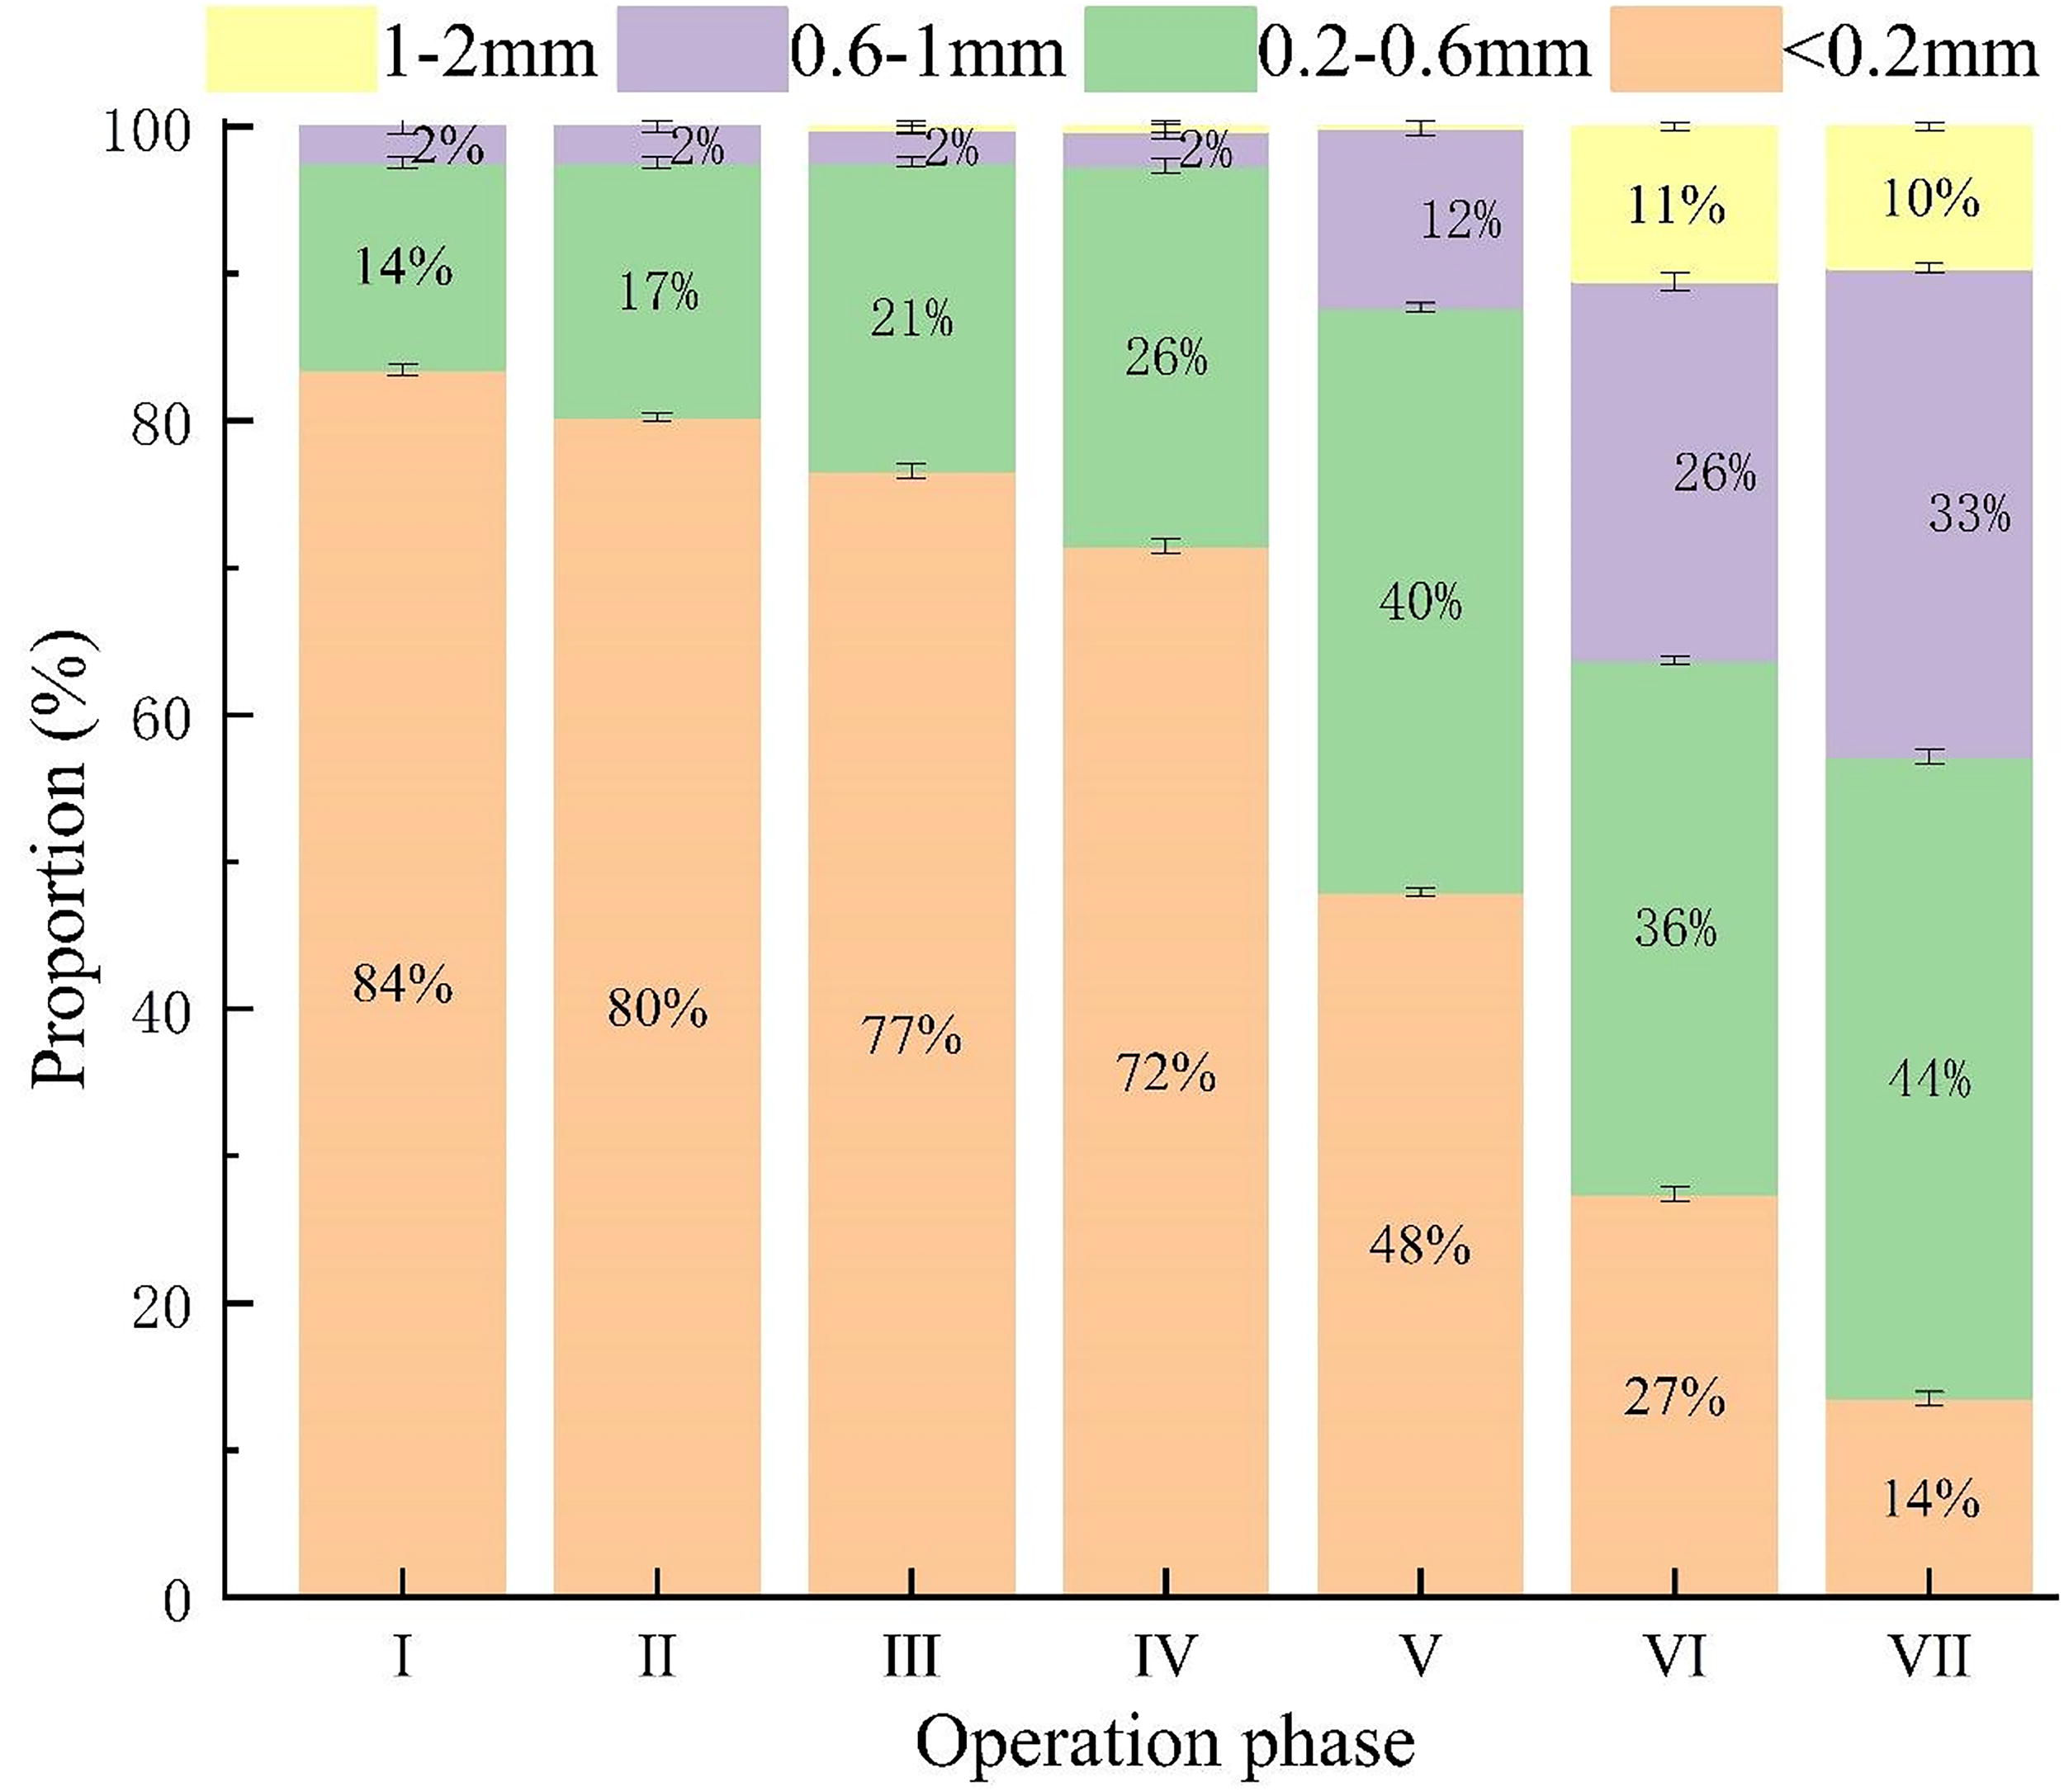
AGS particle size distribution in different phases. AGS, aerobic granular sludge.
Characteristics of AGS
As illustrated in Figure 3(a), the MLVSS/MLSS ratio remained stable (0.84 ± 0.01), while the MLSS of the aerobic reactor was decreased from 4,000 mg/L (phase I) to 3,040 mg/L (phase II). Meanwhile, the SVI5, SVI30, and SVI5/SVI30 all increased (Fig. 3b), which means the sedimentation performance deteriorated. It is possible that the increase in OLR has led to the instability of the sludge, thereby resulting in a diminished settling performance. In phase VII, the MLSS and MLVSS/MLSS were 5,040 mg/L and 0.91, respectively. In addition, the SVI5, SVI30, and SVI5/SVI30 decreased to 59.84 mL/g, 18.67 mL/g and 1.02, respectively. It indicates that as the settling time decrease, more sludge flocs were eliminated from the aerobic reactor, retaining AGS with good settling performance. Yang et al. (2020) found that the perfluorooctanoic acid (PFOA)with potential toxicity deteriorated the settle ability of AGS. In this study, although toxic substances such as surfactants and bactericides were present in the TLW, no significant effects of these compounds on the formation and performance of AGS was observed. The waste tempering lubricant was diluted by the process flushing water, and TLW was further diluted in the influent. Therefore, the actual concentration of toxic substances may be lower than initially anticipated. The influence of toxic substances should be considered in the actual process of TLW treatment.
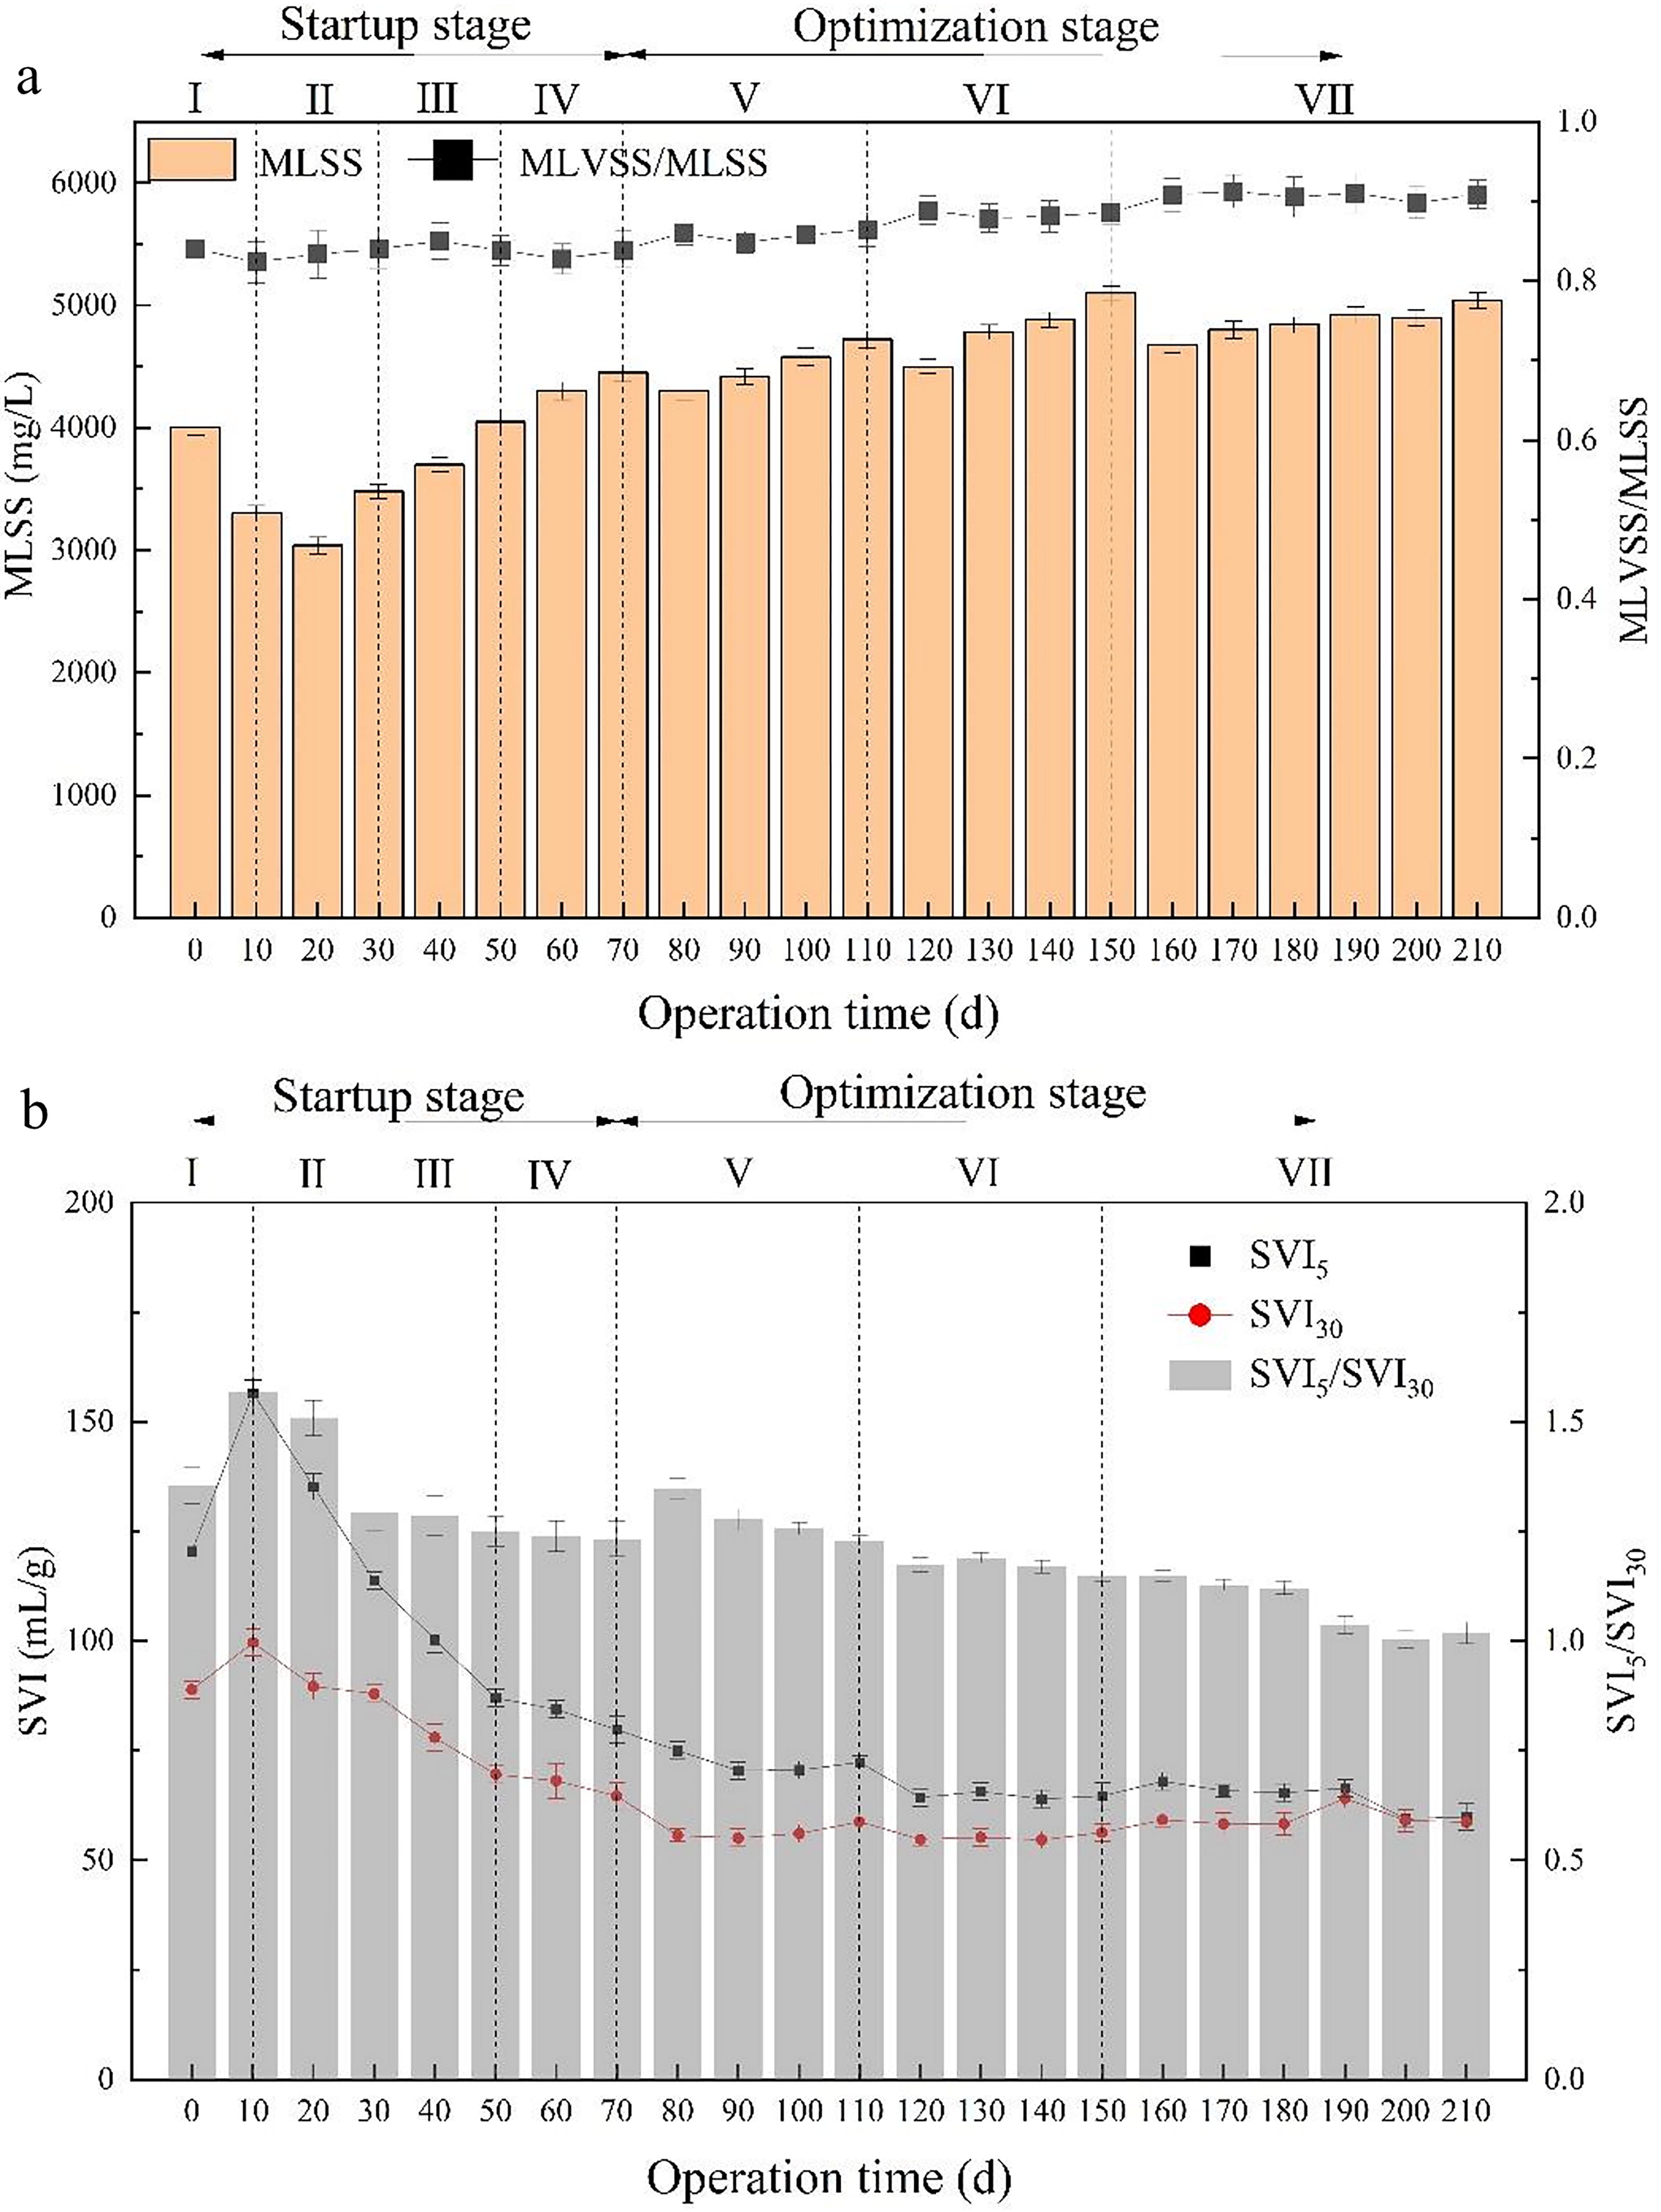
Settling performance of AGS in different phases:
EPS is primarily composed of hydrophobic PN and hydrophilic PS, and the PN/PS ratio affects sludge stability (Mikkelsen and Nielsen, 2001). Figure 4(a) illustrates the changes of PN, PS of AGS in different phases. Compared with the seed sludge, the PN, PS and PN/PS in phase I decreased from 13.2 mg/g VSS, 7.5 mg/g VSS and 1.76 to 9.34 mg/g VSS, 5.8 mg/g VSS and 1.61, respectively. The results indicate a decrease in hydrophobic substances and a relative increase in hydrophilic substances in the sludge, which impacted sludge settling performance. Subsequently, the PN, PS, and PN/PS exhibited an upward trend. In phase VII, the PN, PS and PN/PS were increased to 45.46 mg/g VSS, 16.86 mg/g VSS, and 2.7, respectively. It has been revealed that PN is dominant in EPS during aerobic sludge granulation and the growth of PN content significantly facilitates microbial aggregation (Wang et al., 2021b). In addition, the increase of PN/PS ratio can improve the relative hydrophobicity in sludge surface, and weaken the binding between sludge microorganisms and water molecules, thereby promoting the formation of microbial aggregates, and maintaining a robust sludge structure (Zhang et al., 2017). The result corresponds to the variation of SVI and MLSS [Figure 3(a)].
Characteristics of AGS of the aerobic reactor:
EPS consists of a double-layered structure composed of TB-EPS forming the inner layer and LB-EPS forming the outer layer (Huang et al., 2022a). Compared with seed sludge, the concentrations of LB-EPS and TB-EPS both decreased in phase I [Figure 4(b)]. In phase VII, LB-EPS concentration increased to 20.66 mg/g VSS, while the concentration of TB-EPS reached 41.66 mg/g VSS. The secretion of LB-EPS and TB-EPS contributes to granular sludge settling performance enhancement and sludge loss reduce, while also facilitates AGS formation (Lu et al., 2015). Therefore, high OLR and short settling time promote the secretion of EPS, which enhances AGS stability.
Most divalent metal ions can promote aerobic sludge granulation (Hao et al., 2016). Particularly, Ca2+ and Mg2+ are crucial for speeding up sludge granulation and ensuring AGS stability (Liu et al., 2010). As Table 3 shown, the consumption of Ca2+ and Mg2+ raised from 2.4 mg/L and 3.6 mg/L (phase I) to 22.85 mg/L and 33.16 mg/L (phase VII), respectively. Concurrently, the proportion of AGS increased from 16% to 86% (Fig. 2). It revealed that Ca2+ and Mg2+ were involved in AGS formation. Sajjad and Kim (2015) identified that with the growth of AGS, the microbial demand for Ca2+ and Mg2+ continuously rises. In mature AGS, Ca2+ and Mg2+ can bind with carboxyl, carbonyl, amino (NH2), and hydroxyl groups, becoming part of PN and PS (Cao et al., 2014). These metal ions are distributed in the periphery (Ca2+) and interior (Mg2+) of AGS, which corresponds to the variation of PN and PS. The concentrations of Ca2+ and Mg2+ in the two studies were 25 mg/L-80 mg/L and 25 mg/L-40 mg/L, respectively. Hao et al. (2016) found that the microbial attachment of AGS was disrupted at higher concentration of Ca2+ and Mg2+(>40 mg/L). However, in this study, more than 100 mg/L of Ca2+ and Mg2+ did not inhibit AGS formation and development.
Changes of Ca2+ and Mg2+ Concentrations of the Aerobic Reactor
Performance of the hydrolysis acidification-aerobic reactors
Figure 5(a) illustrates the variation of TOC removal efficiency in different phases. When the OLR increased from 0.35 g-COD/L/d (phases I) to 3 g-COD/L/d (phase IV), the TOC removal efficiency by hydrolysis acidification process decreased from 55.4% to 24.82%. Simultaneously, the total removal efficiency of TOC by hydrolysis acidification-aerobic process was 81.66%. It indicates that TOC removal efficiency was mainly obtained by aerobic treatment. During the optimization stage (phases V–VII), the average removal efficiency of TOC by hydrolysis acidification treatment was just 27.41%. However, total TOC removal efficiency by the process further increased to 84.80%. The results indicate that TOC removal efficiency increased in correlation with the growth of AGS. It also manifested that AGS has strong impact resistance, withstanding changes in organic load.
Performance of hydrolysis acidification-aerobic process in different phases:
As shown in Figure 5(b), the removal efficiency of TN increased from 12.47% (phase I) to 86% (phase VII). Meanwhile, the proportion of AGS in the aerobic reactor increased from 16% to 86%, with AGS in the size range of 1–2 mm constituting for 10% in phase VII. The results confirmed that AGS formation and development significantly enhanced TN removal. Matsumoto et al. (2010) indicated that the larger AGS can create a larger anoxic zone at the inner part of the granule, enhancing denitrification capabilities. It suggests that simultaneous nitrification and denitrification (SND) is the most crucial N removal approach for AGS.
The influent TN mainly contains high concentrations of NH4+ and trace amounts of organic nitrogen [Figure 5(c)]. With the process operation, the effluent NH4+ and NO2− concentrations of the aerobic reactor gradually decreased. It was reported that NH4+ was easily volatilized from highly alkaline aqueous solutions (pH >10) (Markou et al., 2017). The pH value during the whole aerobic reaction was below 10 (Supplementary Fig. S3), so NH4+ volatilization was negligible. TN in effluent was mainly present in the form of NO3−, demonstrating good nitrification performance. In phase IV, the removal efficiency of TN reached 64.44%, indicating that denitrification occurred in the aerobic reactor. The effluent NO3− concentration further decreased from around 85 mg/L (phase V) to 40 mg/L (phase VII). This indicates that as the proportion of AGS increased from 28% to 86%, the denitrification was gradually improved. During one cycle of aerobic treatment (Supplementary Fig. S4), NO2−-N and NO3−-N formation was observed along with NH4+-N removal after 3 h of reaction. Subsequently, the concentration of NO2−-N and NO3−-N declined along with nitrification, and also confirmed that SND occurred in the aerobic reactor.
SAOR and SNRR are frequently utilized to determine the nitrification and denitrification capabilities of AGS, assessing the activity of nitrifying and denitrifying bacteria within AGS (Wang et al., 2015). In phase IV, SAOR and SNRR were 0.077 gN/gSS/d and 0.66 gN/gSS/d, respectively (Table 4). The result suggests that AGS is in a growth phase with good nitrification and denitrification performance. Subsequently, SAOR and SNRR increased to 0.092 gN/gSS/d and 1.10 gN/gSS/d (phase VII), respectively. This reveals that nitrification on the surface of the granules and denitrification in the internal anoxic zone was both improved.
Specific Ammonia Oxidation Rate and Specific Nitrate Reduction Rate of AGS in Different Phases
The results presented above indicated that the formation and maturation of compact and stable AGS contributed to the process’s resistance to organic load impacts. Furthermore, the external aerobic and internal anoxic structural characteristics of AGS facilitated SND in the aerobic reactor, which enhanced TN removal efficiency.
Microbial structural diversity analysis
Sludge samples from different phases of the reactors were analyzed by high-throughput sequencing through the Illumina platform. The sequencing results are shown in Table 5. Ace, Chao, Sobs, Simpson, and Coverage can reflect the diversity, richness, and evenness of microorganisms (Matsumoto et al., 2010). The coverage index for all samples is above 0.99, indicating that most bacterial communities have been detected, and the results accurately reflect the actual conditions of the samples. Compared with that in the seed sludge, the Shannon index of the hydrolysis acidification reactor and the aerobic reactor in phase VII both decreased, whereas the Simpson indexes increased. This means that the diversity of microorganisms was reduced. Moreover, Ace, Chao1, and Sobs indices in the aerobic reactor showed a decreasing trend followed by an increase. In phase VII, these indexes were all higher than those of the seed sludge. This reveals that the richness of microorganisms in the aerobic reactor was increased.
Microbial Diversity of Sludge in Hydrolysis Acidification-Aerobic Reactors
The phylum level analysis of the microbial community structure was shown in Figure 6(a) and Figure 6(b). In the seed sludge, the top four phyla of the hydrolysis acidification reactor were Chloroflexi (51.15%), Bacteroidota (10.06%), Desulfobacterota (9.75%), and Acidobacteriota (5.06%). In phase VII, the dominant phyla changed to Proteobacteria (32.96%), Chloroflexi (18.79%), Bacteroidota (14.79%), Desulfobacterota (9.17%), Firmicutes (4.38%), and Acidobacteriota (3.19%) [Figure 6(a)]. The abundance of Proteobacteria increases, followed by Bacteroidota and Firmicutes. These phyla were highly related to the utilization of organic compounds and degradation of complex organic substances (Campanaro et al., 2020; Jiang et al., 2021a; Kindaichi et al., 2004). The results indicated that increasing the OLR changed the microbial community structure in the hydrolysis acidification reactor, then improved the biodegradation of the TLW.
Relative abundance of microbial community structures at phylum level and abundance heat map of microorganisms at genus level in hydrolysis acidification
In the aerobic reactor, the dominant phyla developed from Bacteroidota (30.09%), Proteobacteria (28.60%), Chloroflexi (10.16%), Actinobacteriota (12.21%), and Myxococcota (7.88%) in the seed sludge to Proteobacteria (52.97%), Bacteroidota (24.37%), Actinobacteriota (9.42%), Patescibacteria (7.38%), and Chloroflexi (3.75%) in phase VII [Figure 6(b)]. Proteobacteria was the phylum that contains the most nitrifying and denitrifying bacteria (Ma et al., 2013). Proteobacteria was also known to secrete abundant EPS, which can enhance granulation by providing important metabolic diversity (Wang et al., 2020). The proportion of Proteobacteria gradually increased to 65.13% in phase IV, then decreased to 62.20% and 52.97% in phase V and phase VII, respectively. Meanwhile, the abundance of Patescibacteria increased. Patescibacteria, which was mostly aerobic or facultative bacteria, has the capability to degrade organic substances and compete with Proteobacteria (Zhu et al., 2022). It also explains the decreasing abundance of Proteobacteria in phases tration further decreased from around 85 mg/ and VII. Chloroflexi can affect the stability of granule structure and even lead to sludge expansion (McIlroy et al., 2016). The abundance of Chloroflexi became lower in phase VII, contributing to the stability of AGS. Actinobacteriota exhibited a relatively stable abundance, which is favorable for nitrogen removal (Wang et al., 2021a). Bacteroidota was considered to play a significant role in carbohydrate metabolism (Campanaro et al., 2020).
To further study the changes of microbial community at genus level, 50 genera with the most abundance in sludge samples were analyzed. As Figure 6(c) shown, the relative abundance of norank_f_Bacteroidetes_vadinHA17 in the hydrolysis acidification reactor increased from 7.36% (seed sludge) to 13.4% (phase VII), which can effectively degrade complex organic matter (Chen et al., 2017). Acinetobacter is known for its excellent ability to degrade COD and utilize NH4+-N (Chen et al., 2019b); its relative abundance is also increased from 0.05% to 13.57%. During the operation of the aerobic reactor, the abundance of dominate bacterial groups of seed sludge declined [Figure 6(d)]. The relative abundance of Comamonadaceae increased to 8.71% in phase VII. Comamonadaceae belongs to the SND bacterial genus and has a strong ability to denitrification (Han et al., 2023). The result also confirmed the occurrence of SND within the aerobic reactor. As the dominant genus, the relative abundance of Novosphingobium also increased, which contribute to the reduction of nitrate to nitrite (Liu et al., 2021). Saccharimonadales was absent in the seed sludge, but its relative abundance increased to 1.83% in phase VII. The emergence of Saccharimonadales promoted the formation of granular sludge (Chen et al., 2019a).
Conclusions
Real TLW treatment was conducted through a hydrolysis acidification-aerobic process over 210 days. The results indicated that higher OLR facilitated the AGS formation, while shorter settling time contributed to its stability. With AGS maturation, the removal efficiencies of TOC and TN reached 84.8% and 86%, respectively. Meanwhile, the abundance of Proteobacteria, Firmicutes, and Bacteroidota within the hydrolysis acidification reactor was enhanced, thereby improving the biodegradability of the TLW. The proliferation of Patescibacteria and the reduction of Chloroflexi in the aerobic reactor promoted both the degradation of organic substances and the stability of AGS. The increase abundance of Comamonadaceae confirmed the occurrence of SND within the aerobic reactor, which enhanced TN removal.
Footnotes
Authors’ Contributions
G.Y.: Writing—original draft, Data curation, Formal analysis, Conceptualization, Visualization. J.L.: Writing—review and editing, Funding acquisition, Supervision, Conceptualization, Resources. C.C.: Methodology, Data curation, Visualization. J.G.: Investigation, Validation, Data curation. F.X.: Supervision, Funding acquisition, Conceptualization. X.L.: Funding acquisition, Project administration, Data curation.
Author Disclosure Statement
The authors declare that they have no known competing financial interests or personal relationships that could have appeared to influence the work reported in this paper.
Funding Information
This work was supported by Shanghai Dong Zhen Environmental Engineering Technology Co., Ltd, and Agricultural Science and Technology Innovation Project in Chongming District, Shanghai (2021CNKC-05-06).
References
Supplementary Material
Please find the following supplemental material available below.
For Open Access articles published under a Creative Commons License, all supplemental material carries the same license as the article it is associated with.
For non-Open Access articles published, all supplemental material carries a non-exclusive license, and permission requests for re-use of supplemental material or any part of supplemental material shall be sent directly to the copyright owner as specified in the copyright notice associated with the article.