
Abstract
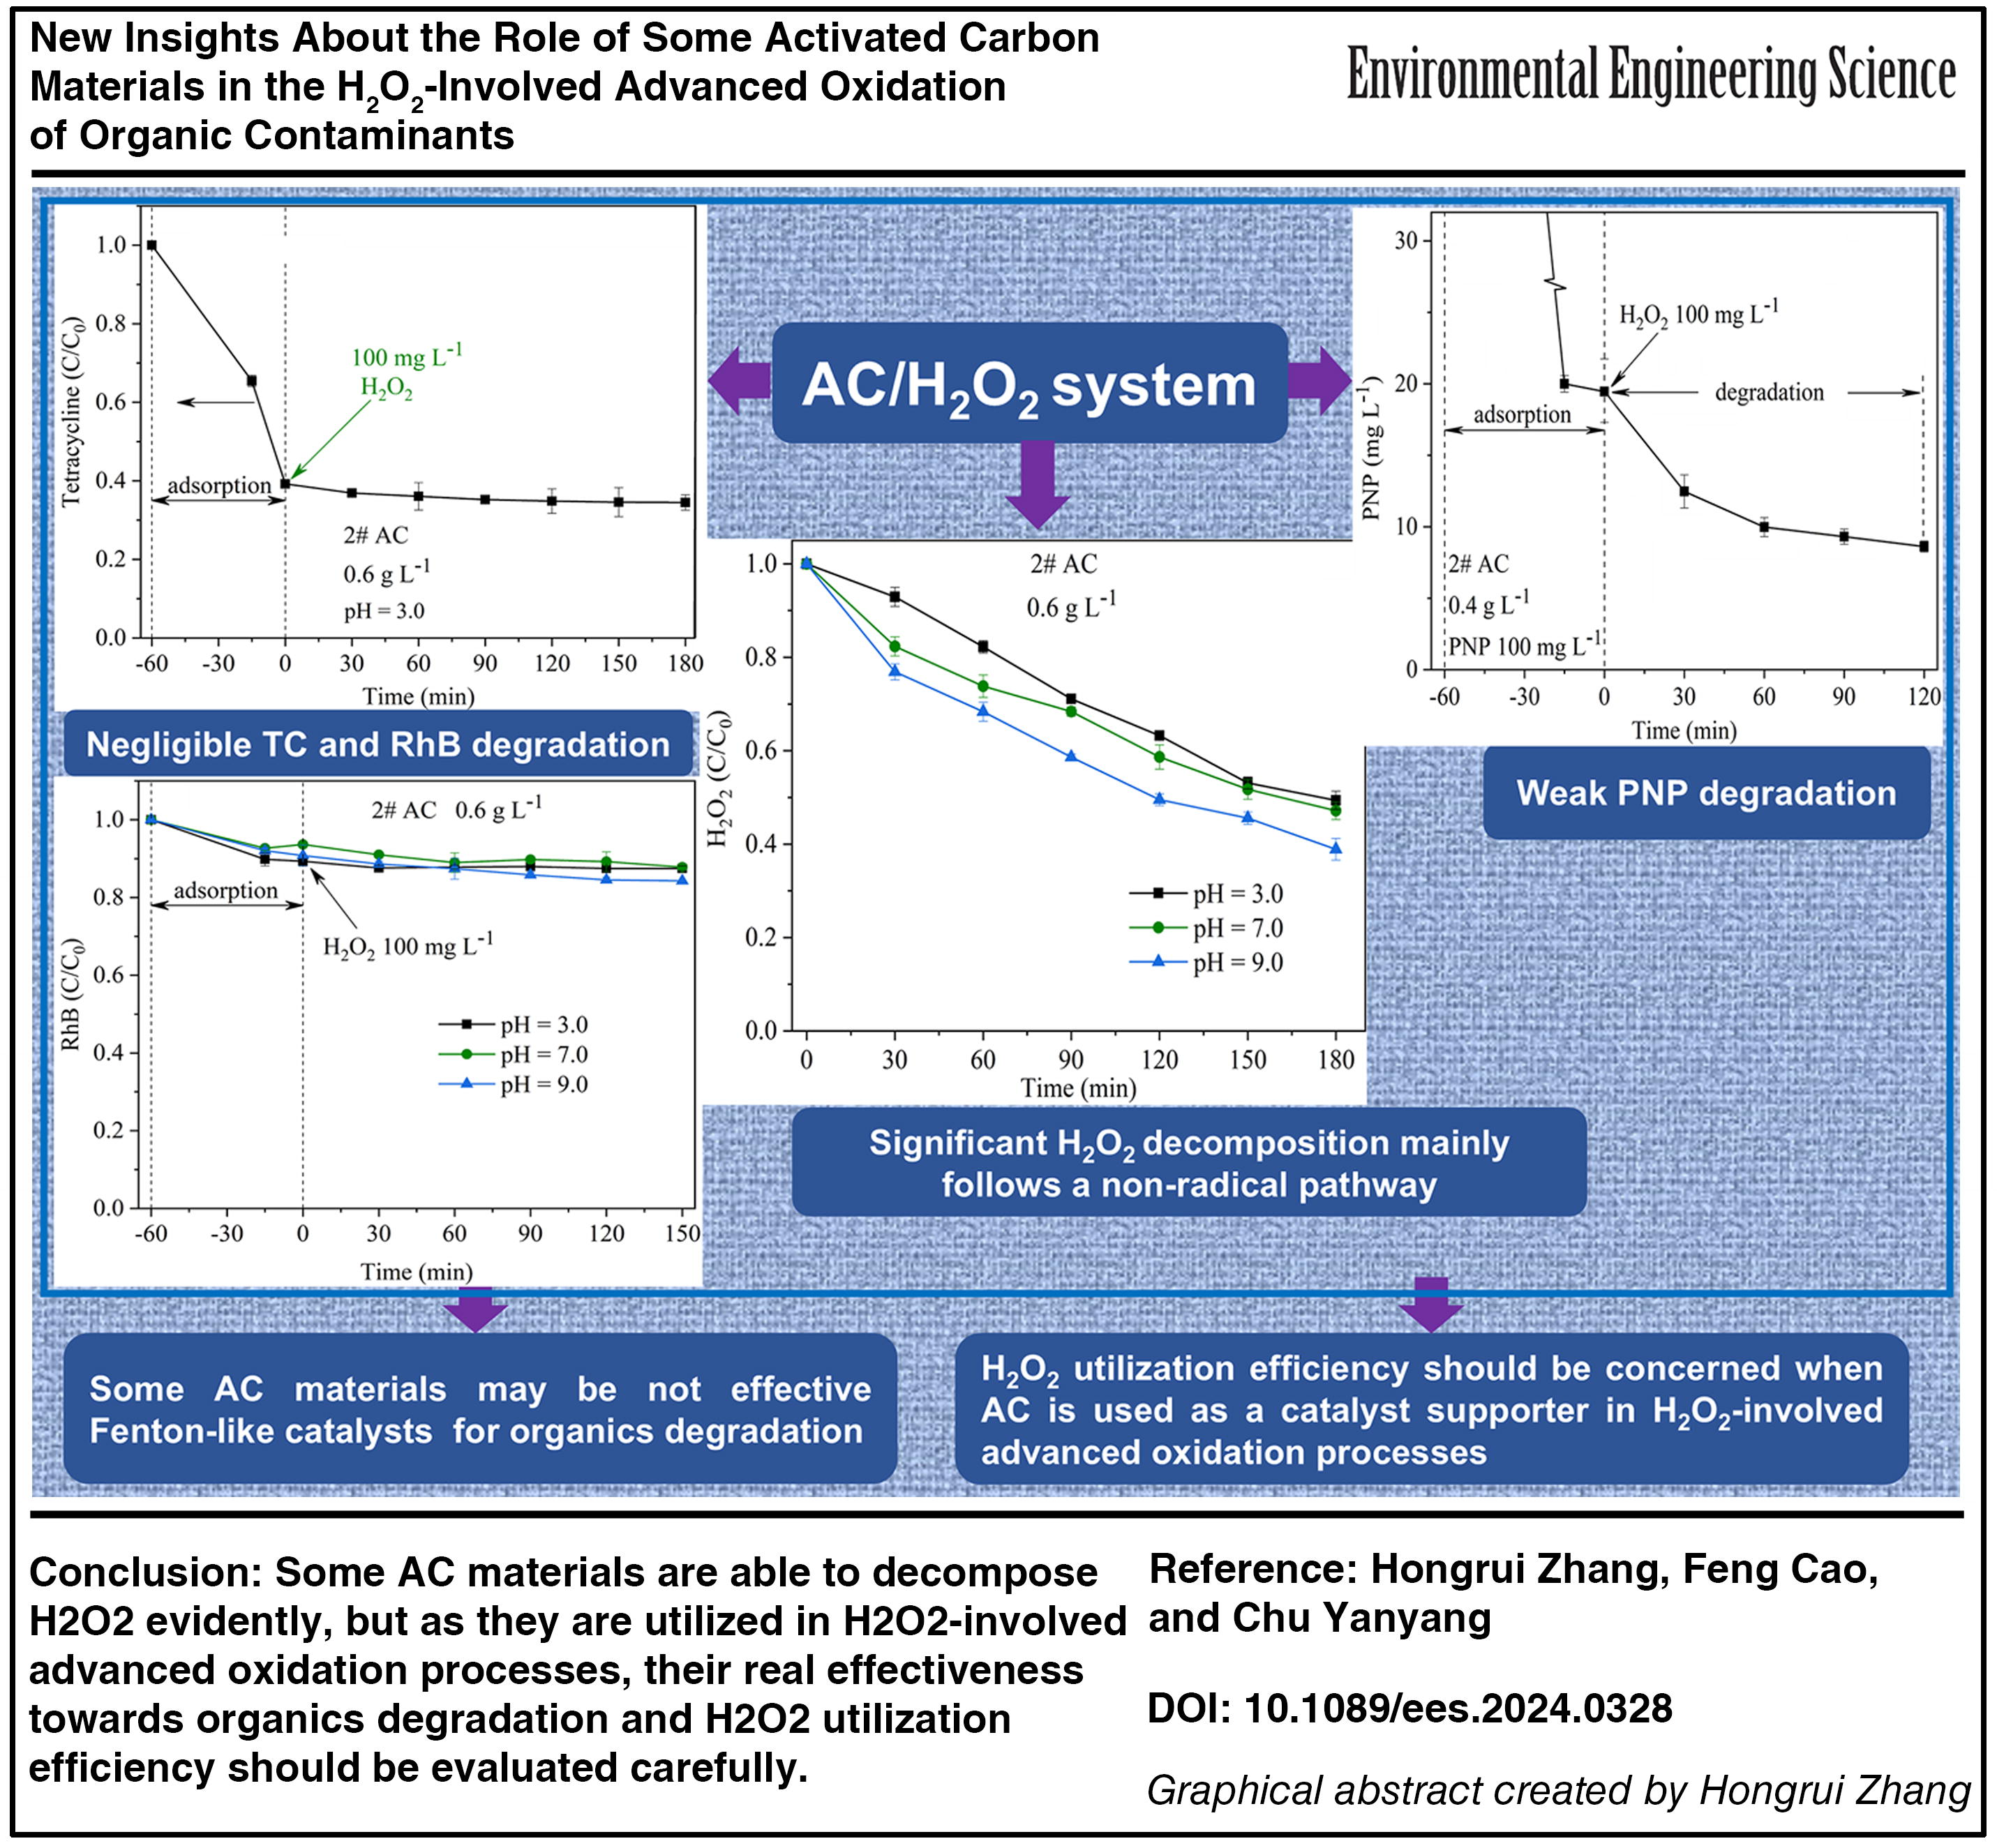
In this study, we investigated the degradation of tetracycline (TC), rhodamine B (RhB), and p-nitrophenol (PNP) in the activated carbon (AC)/H2O2 system using three AC materials prepared from coconut shell, glucose, and corn straw. Our findings indicate that, despite the significant decomposition of H2O2, the degradation of TC and RhB in the AC/H2O2 system was almost negligible. For PNP, a weak degradation was observed in the AC/H2O2 system, but the degradation rate was much slower than that obtained from the homogeneous Fenton oxidation (H2O2/Fe2+) system under the same amount of H2O2 consumption. Only weak electron spin resonance signals of DMPO-
Introduction
Activated carbon (AC) is always considered as a good adsorbent widely used in eliminating various pollutants in the environmental protection field. However, its new application as a catalyst or catalyst carrier used in H2O2−involved advanced oxidation processes (AOPs) for the degradation of organic contaminants attracted wide attention over the past 15 years (Anfruns, et al., 2014; Duarte et al., 2013; Li et al., 2022; Li et al., 2023; Santos et al., 2009; Zarate-Guzmán et al., 2019). Among various applications of AC in H2O2−involved AOPs, the typical one is to develop various heterogeneous Fenton-like processes (Anfruns, et al., 2014; Duarte et al., 2013; Li et al., 2022; Li et al., 2023; Santos et al., 2009; Zarate-Guzmán et al., 2019).
It is well known that the traditional Fenton process based on the homogeneous reaction between H2O2 and Fe2+ generating hydroxyl radical (
In fact, it has long been recognized that AC can give rise to H2O2 decomposition as a catalyst. Although the reaction mechanism of H2O2 decomposition by AC is not fully understood, its application in degrading various organic pollutants such as dyes (Santos et al., 2009), bisphenol A (Li et al., 2023), pentachlorobenzene (Takaoka et al., 2007), and 4-chlorophenol (Huang et al., 2003) has been reported. These studies confirmed that H2O2 decomposition over AC surface can generate
Besides organics degradation performance, H2O2 utilization efficiency is another important issue concerning technical and economic feasibility for the practical application of those H2O2−involved AOPs. Although many studies reported the positive effects of AC in the H2O2−involved AOPs, until now, there has been no study focused on the H2O2 utilization efficiency of these processes (Anfruns, et al., 2014; AZarate-Guzmán et al., 2019; Duarte et al., 2013; Li et al., 2022; Li et al., 2023; He et al., 2022; Molamahmood et al., 2022; Rey et al., 2016; Santos et al., 2009). Thus, in this work, the three AC materials prepared, respectively, with coconut shell, glucose, and corn straw were utilized to activate H2O2 for the degradation of tetracycline (TC), rhodamine B (RhB), and p-nitrophenol (PNP). The degradation results were compared with those obtained from conventional Fenton oxidation process. Moreover, the comparison of H2O2 utilization efficiency was emphasized to objectively evaluate the real significance of utilizing AC in the H2O2−involved AOPs.
Experimental Section
Materials
All chemicals were of analytical grade and used without further purification. All solutions were prepared using deionized water with conductivity <0.4 μS/cm. Aqueous solutions of H2SO4 and NaOH were adopted to adjust pH values. One commercialized AC product (1# sample) was purchased from Hainan Xinghuo Activated Carbon Co., Ltd. (China).
Preparation and characterization of AC materials
Glucose and corn straw were used to prepare the two AC materials, and the obtained products were labeled as 2# and 3# samples, respectively. The preparation involved the carbonization of glucose and corn straw, followed by the activation treatment. The carbonization of glucose was conducted by one hydrothermal process. Specifically, 12.0 g glucose was dissolved into 70 mL deionized water, and then this solution was put into a 100 mL PTFE-lined reactor for the hydrothermal treatment at 180°C for 12 h. After cooling, the formed carbon material was centrifugally washed using ethanol and deionized water successively. Afterward, the carbon material was dried at 105°C for 2 h in an air circulation oven for the subsequent activation treatment. For the carbonization of corn straw, firstly, it was washed with deionized water and dried at 105°C and then was ground to powder. After that, corn straw powder was subjected to hydrothermal treatment in a muffle furnace at 550°C for 2 h with a heating rate of 10°C/min under nitrogen protection to synthesize another carbon material. The activation treatment of the above two carbon materials was conducted by the same procedures. Firstly, 0.8 g carbon and 3.2 g KOH were well mixed and then subjected to hydrothermal treatment in a muffle furnace at 600°C for 2 h with a heating rate of 20°C/min under nitrogen protection. After that, the above mixture was washed with deionized water till the pH value of the washing liquor was close to 7.0. Finally, the obtained AC was dried at 105°C for 2 h.
Scanning electron microscopy (SEM) images were obtained with a JSM-6700F electron microscope. The crystal structure of AC samples was characterized by X-ray diffraction (XRD) with a Rikagu D/MAX-2500 diffractometer. The functional groups of AC samples were analyzed by Fourier transform infrared (FTIR) spectroscopy using a Bruker FTIR-Vertex 70 analyzer. The specific surface area was measured via the N2 adsorption–desorption method on a Micromeritics ASAP2020 instrument (USA).
Experiments of H2O2 decomposition
H2O2 decomposition by the three AC samples was investigated at different pH values. Typically, 100 mL H2O2 solution (100 mg/L) was transferred into a glass reactor, followed by pH adjustment, and then a certain amount of AC was added into the solution to start the catalytic decomposition of H2O2 under magnetic stirring. At specified time intervals, 2 mL of the suspension was extracted and filtered through a 0.22 μm membrane for H2O2 determination. The H2O2 decomposition efficiency was calculated by the equation: [(C0 − C)/C0] × 100%, where C0 and C were H2O2 concentration values before and after the reaction. Because the three ACs have significant difference in H2O2 decomposition capability as the same dosage adopted, the H2O2 decomposition experiments were performed with 3.0–10.0 g/L 1# AC, 0.6 g/L 2# AC, and 1.0 g/L 3# AC to obtain appropriate H2O2 decay, facilitating the study of the relationship between H2O2 decomposition and organics degradation.
Degradation experiments
The degradation of TC by the three AC materials (1#, 2#, and 3#) was carried out at pH = 3.0, 7.0, and 9.0, respectively. The dosages of 1# AC, 2# AC, and 3# AC used were 3.0, 0.6, and 1.0 g/L, respectively. For each degradation experiment, 100 mL TC solution (60 mg/L) was transferred into a glass reactor, followed by pH adjustment, and then AC was added into the solution to perform the adsorption for 60 min under magnetic stirring. After that, 10 mg H2O2 was added into the solution to start the degradation with the initial H2O2 concentration of 100 mg/L. At specified time intervals, samples were drawn and filtered through a 0.22 μm membrane for H2O2 and TC determination. Furthermore, the degradation of 40 mg/L RhB by 0.6 g/L 2# AC and the degradation of 100 mg/L PNP by 0.4 g/L 2# AC were conducted according to the same experimental procedures. 2# AC exhibited very strong ability toward PNP adsorption, and thus a lower 2# AC dosage of 0.4 g/L was used for PNP degradation to facilitate degradation performance analysis.
For the purpose of comparison, the degradation of TC, RhB, and PNP by the conventional Fenton oxidation system (H2O2/Fe2+) was carried out at pH = 3.0 with a fixed molar ratio of H2O2 to Fe2+ (about 5:1). The TC removal efficiency was calculated by the equation: [(C0 − C)/C0] × 100%, where C0 and C were TC concentration values before and after the reaction.
Electron spin resonance tests
The generation of
Analytical methods
A PHS-25C pH meter was used to measure solution pH values. H2O2 concentration was measured by the spectrophotometric method according to the light absorption of titanium–hydrogen peroxide complex at 410 nm. TC and RhB concentrations were determined by the spectrophotometric method at 357 and 554 nm (Zhang et al., 2019; Wang et al., 2022), respectively. PNP concentration was determined by gas chromatography and the detailed analysis conditions were provided in the reference (Chu et al., 2020).
Results and Discussion
Characterization of various AC materials
The three AC materials were used in this study including one commercialized product produced with coconut shell and two self-made products prepared with glucose and corn straw. The commercialized AC was columnar with a diameter of about 2 mm and a height of about 3–8 mm, and the other two AC were powder materials (Fig. 1a). The SEM image of the commercialized AC (1#) exhibited its dense, smooth, and porous structure (Fig. 1b). The AC prepared with glucose (2#) possessed a loose and porous structure (Fig. 1c). The AC prepared with corn straw (3#) possessed an unordered and porous structure and still remained an identifiable texture structure (Fig. 1d).

Photographs of the three AC materials
Figure 1e shows the XRD spectra of the three AC materials. The two broad diffraction peaks can be observed over the 2θ range of 20–30° and 40–50° for the three materials, which are typical peaks of disordered carbon structure, indicating the amorphous nature of the materials (Li et al., 2022; Wazir et al., 2023; Yao et al., 2023), but with a microcrystalline structure similar to that of graphite within a certain range (Alhnidi et al., 2020; Yao et al., 2023). For adsorption purposes, an amorphous structure can facilitate the entrance of adsorbate molecules because of more empty spaces. The XRD spectrum of 2# AC displays the two narrow impurity diffraction peaks at 28.3° and 34.5°, which may be related to a small amount of residual glucose. Figure 1f shows that the three materials have the same FTIR absorption peaks. The characteristic peak at 3436 cm−1 is ascribed to the O–H vibration, while the two peaks at 2925 and 2851 cm−1 are ascribed to the C–H vibration stretching vibration in the aliphatic groups (Li et al., 2011; Li et al., 2022). The peak at 1631 cm−1 is ascribed to the stretching vibration of C=O in carbonyl groups (Liu et al., 2020). The two peaks at 1383 and 1040 cm−1 correspond to the stretching vibration of C–O (Liu et al., 2023; Niazi et al., 2018). These absorption peaks indicate that the three materials are abundant in various functional groups such as hydroxyl, aliphatic, lactone, aldehyde, and carboxyl groups (Niazi et al., 2018). These functional groups may evidently affect the adsorption ability and catalytic activity of AC materials (Anfruns et al., 2014; Vega and Valdés, 2018; Wazir et al., 2023).
H2O2 decomposition caused by various AC materials
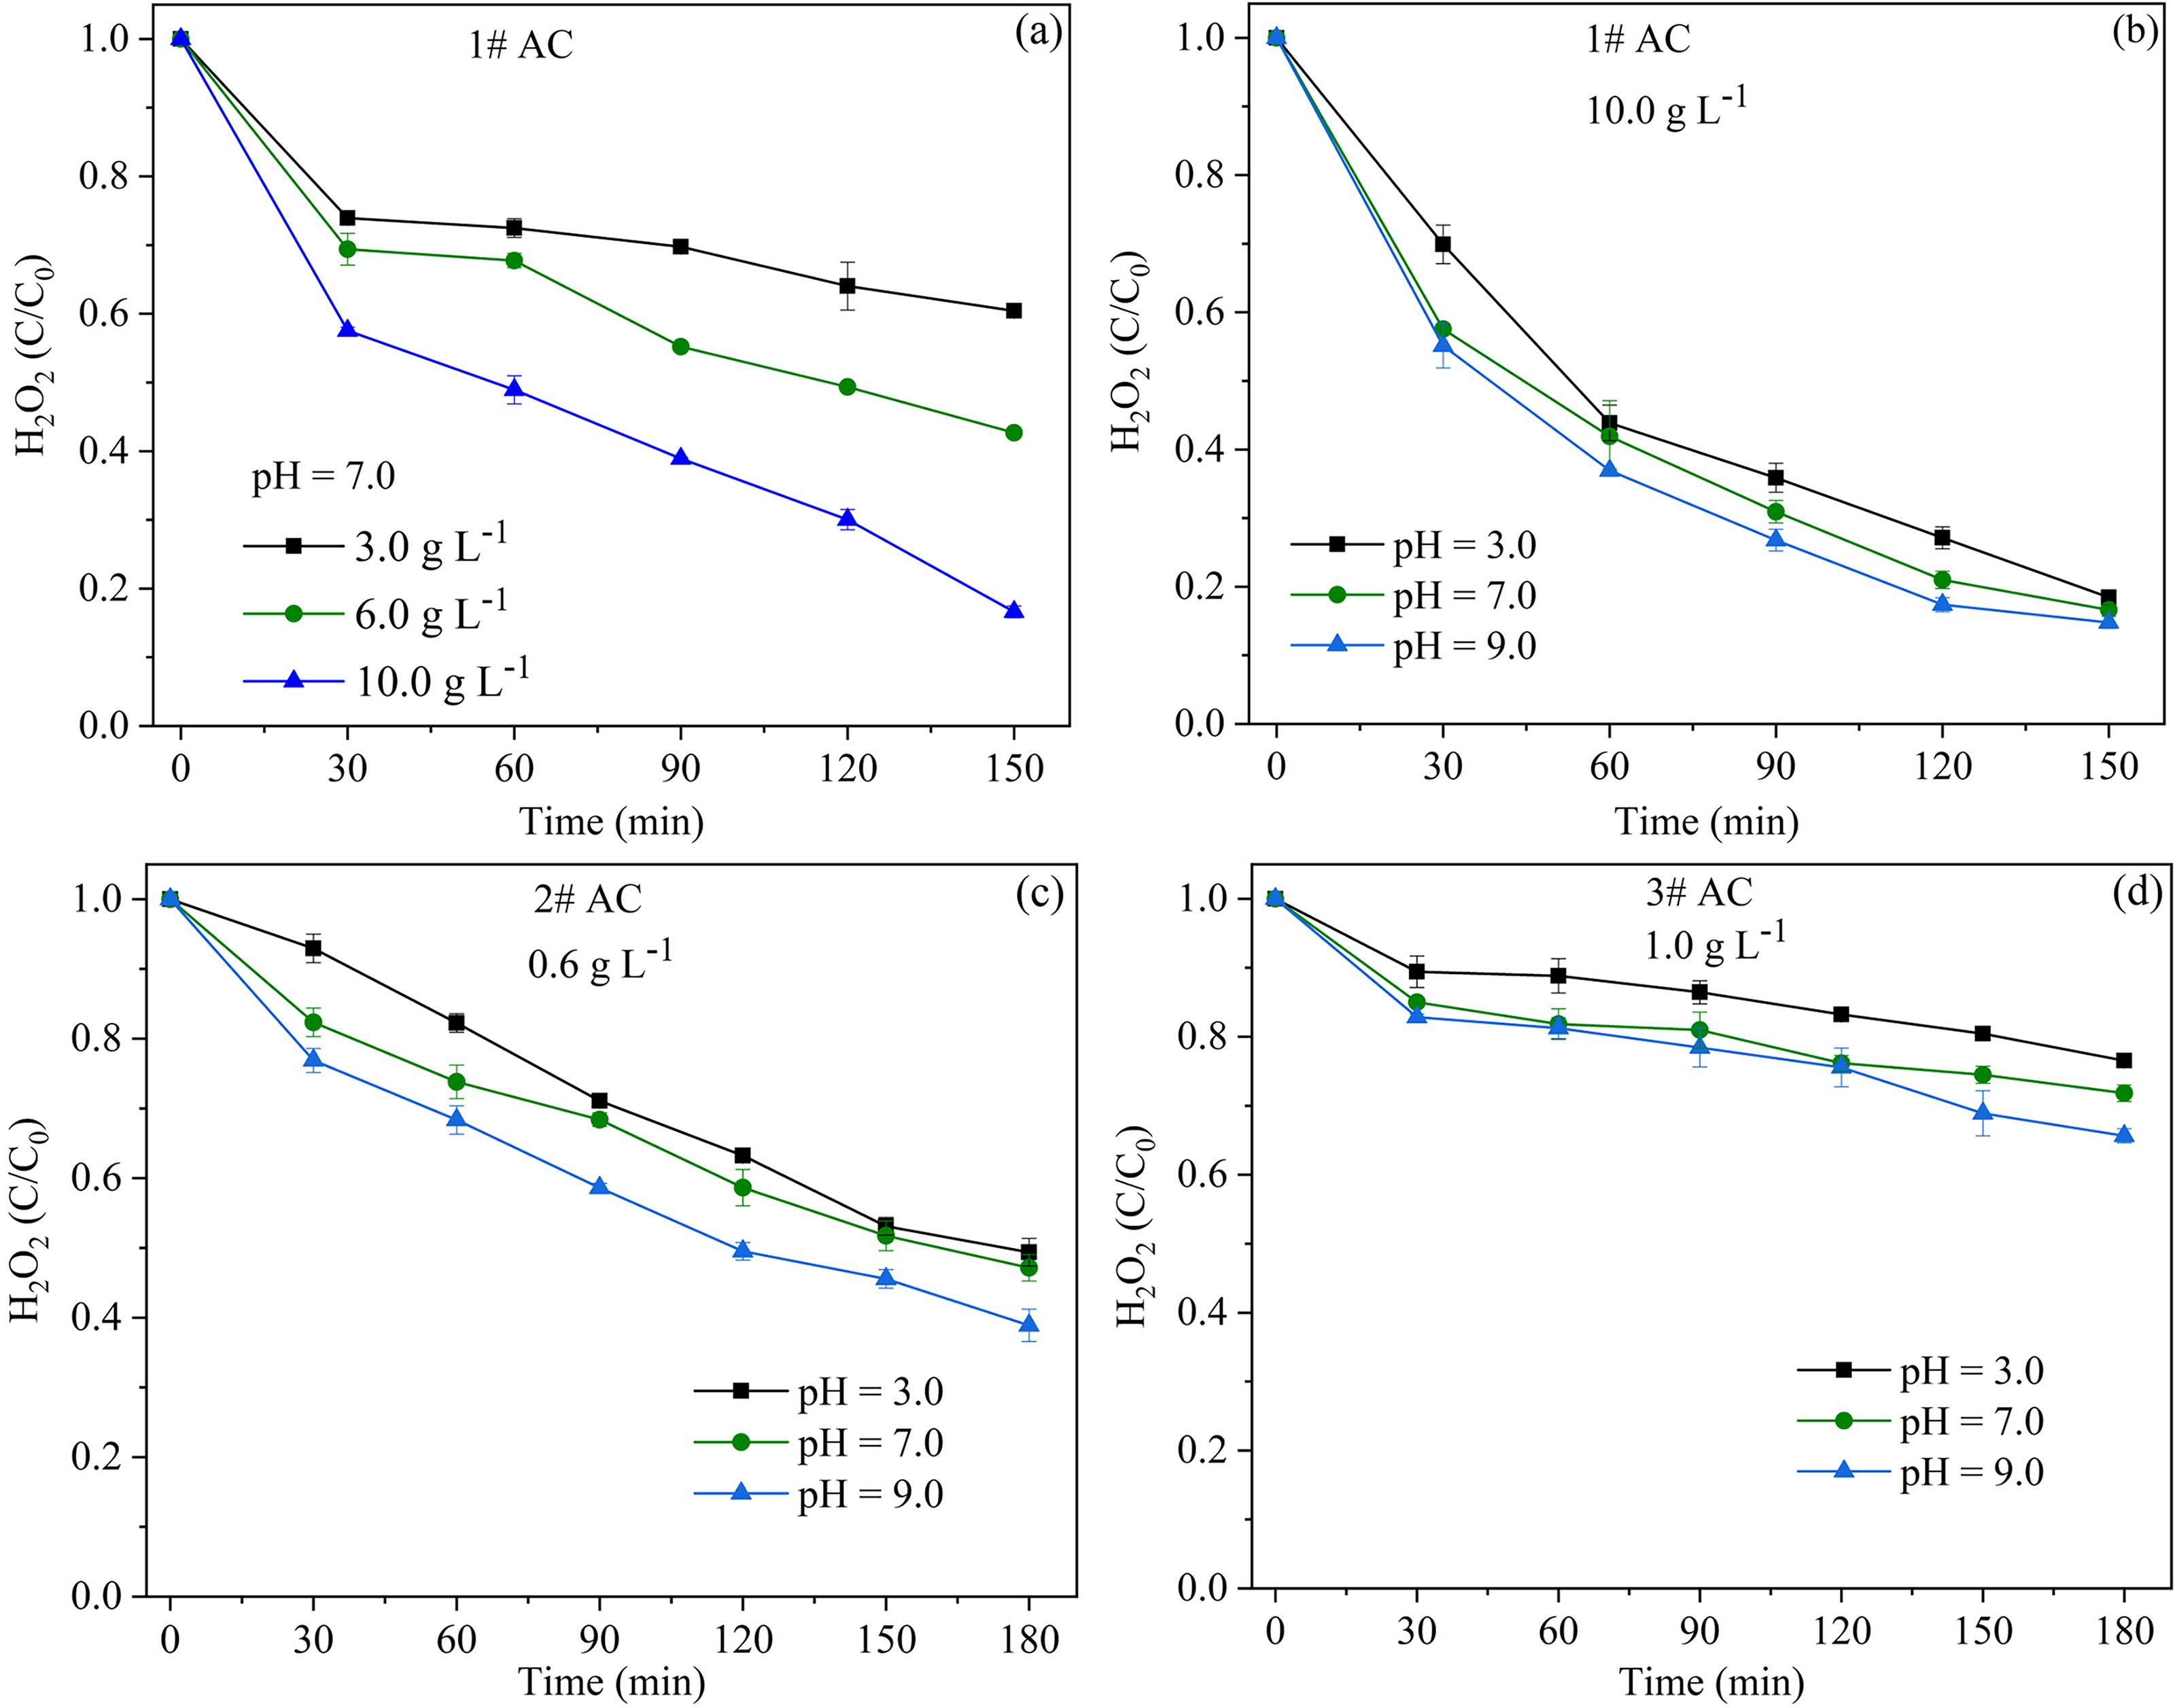
As the three AC materials dipped into a high-concentration H2O2 solution, a large number of oxygen bubbles generated violently at the surface of AC materials, which visually displayed the catalytic decomposition of H2O2 caused by various AC materials. To investigate the H2O2 decomposition quantitatively, the decomposition of 100 mg/L H2O2 was conducted with 3.0–10.0 g/L 1# AC, 0.6 g/L 2# AC, and 1.0 g/L 3# AC. Figure 2a shows the influence of 1# AC dosage on H2O2 decomposition at pH = 7.0. Evidently, the higher 1# AC dosage resulted in the faster H2O2 decomposition, and a H2O2 decomposition efficiency of over 80% was obtained at 150 min as 10.0 g/L 1# AC used. Figure 2b shows the results of H2O2 decomposition obtained with 10.0 g/L 1# AC at different solution pH values, indicating that the increase of pH caused the H2O2 decomposition speed increased slightly, which was also confirmed by the results of H2O2 decomposition obtained with 2# (Fig. 2c) and 3# AC materials (Fig. 2d). In fact, compared with 1# AC, 2# AC and 3# AC were able to cause much faster H2O2 decomposition if the same AC dosage was adopted. Specifically, H2O2 decomposition efficiencies at the reaction time of 60 min obtained with 10.0 g/L 2# AC and 3# AC at pH = 3.0 reached 100% and 82.5%, respectively. Therefore, the H2O2 decomposition capability of the three ACs increased in the order: 1#<3#<2#. The H2O2 decomposition performance of 2# and 3# AC was further investigated under the condition of lower dosages: 0.6 g/L 2# AC and 1.0 g/L 3# AC. Further comparison confirmed that 2# AC possessed the fastest H2O2 decomposition performance (Fig. 2c and d). The BET surface areas of 1#, 2#, and 3# AC materials were 824, 1025, and 487 m2/g, respectively. Usually, the higher surface area can present more active reactive sites facilitating H2O2 decomposition. Besides, three other factors can obviously affect H2O2 decomposition such as surface chemical groups of AC materials, metal impurities, and mass transfer efficiency (Anfruns et al., 2014; Georgi and Kopinke, 2005; Vega and Valdés, 2018). The relatively lower H2O2 decomposition performance of 1# AC may be mainly ascribed to the low mass transfer efficiency caused by its columnar granular state instead of powder state.
Results of H2O2 decomposition obtained with different amount of 1# AC at pH = 7.0
TC, RhB, and PNP degradation by AC/H2O2 system and Fenton oxidation system
To comprehensively learn the performance of the AC/H2O2 system for organics degradation, the three typical organic compounds including TC, RhB, and PNP were selected for the degradation experiments with the above-mentioned three AC materials. Figure 3a–c shows the concentration changes of TC and H2O2 in 1# AC/H2O2 system obtained at pH = 3.0, 7.0, and 9.0, respectively. According to Figure 3a–c, the adsorption stage of 60 min caused a noticeable decrease in TC concentration, and the adsorption equilibrium was reached approximatively prior to H2O2 addition. However, TC concentration only decreased slightly after H2O2 addition in the degradation stage of 180 min, even though the H2O2 decomposition efficiency reached 33.5–44.0%. It was evident that substantial H2O2 decomposition caused by 1# AC was unable to present effective TC degradation, and this conclusion could also be drawn based on the concentration changes of TC and H2O2 in 2# and 3# AC/H2O2 systems (Fig. 3d–i).

Degradation of TC by the AC/H2O2 system with the three AC materials at different pH and the corresponding H2O2 decay: 1# AC at pH = 3.0
In the above experiments, the lowest and the highest H2O2 decomposition efficiencies were 19.0% (Fig. 3g) and 44.0% (Fig. 3b), respectively, which denoted the consumed H2O2 concentration in all the degradation experiments ranged from 19.0 to 44.0 mg/L. Such a H2O2 consumption in the AC/H2O2 system presented nearly negligible TC degradation. Thus, an important question of whether such a H2O2 consumption can present effective TC degradation in other H2O2−involved AOPs was naturally raised. To answer this question, the degradation of 60 mg/L TC by the conventional Fenton system (H2O2/Fe2+) was conducted at pH = 3.0 with H2O2 dosages of 10–60 mg/L. Figure 4a–d shows the concentration changes of TC and H2O2 obtained from the H2O2/Fe2+ system. It was found that the increase in H2O2 dosage greatly enhanced TC degradation speed. As 10, 20, 40, and 60 mg/L H2O2 was adopted for the degradation, the Fenton reactions consumed 4.2, 12.3, 35.2, and 54.5 mg/L H2O2 within 120 min, respectively, and the corresponding TC removal efficiencies of 46.1%, 74.0%, 88.9%, and 94.9% were achieved, indicating effective TC degradation. On comparing these results with those obtained from the AC/H2O2 system, it could be concluded that the H2O2 utilization efficiency for TC degradation in the AC/H2O2 system was much lower than that in the H2O2/Fe2+ system. In other words, a large amount of H2O2 was consumed uselessly in the AC/H2O2 system considering TC degradation performance.
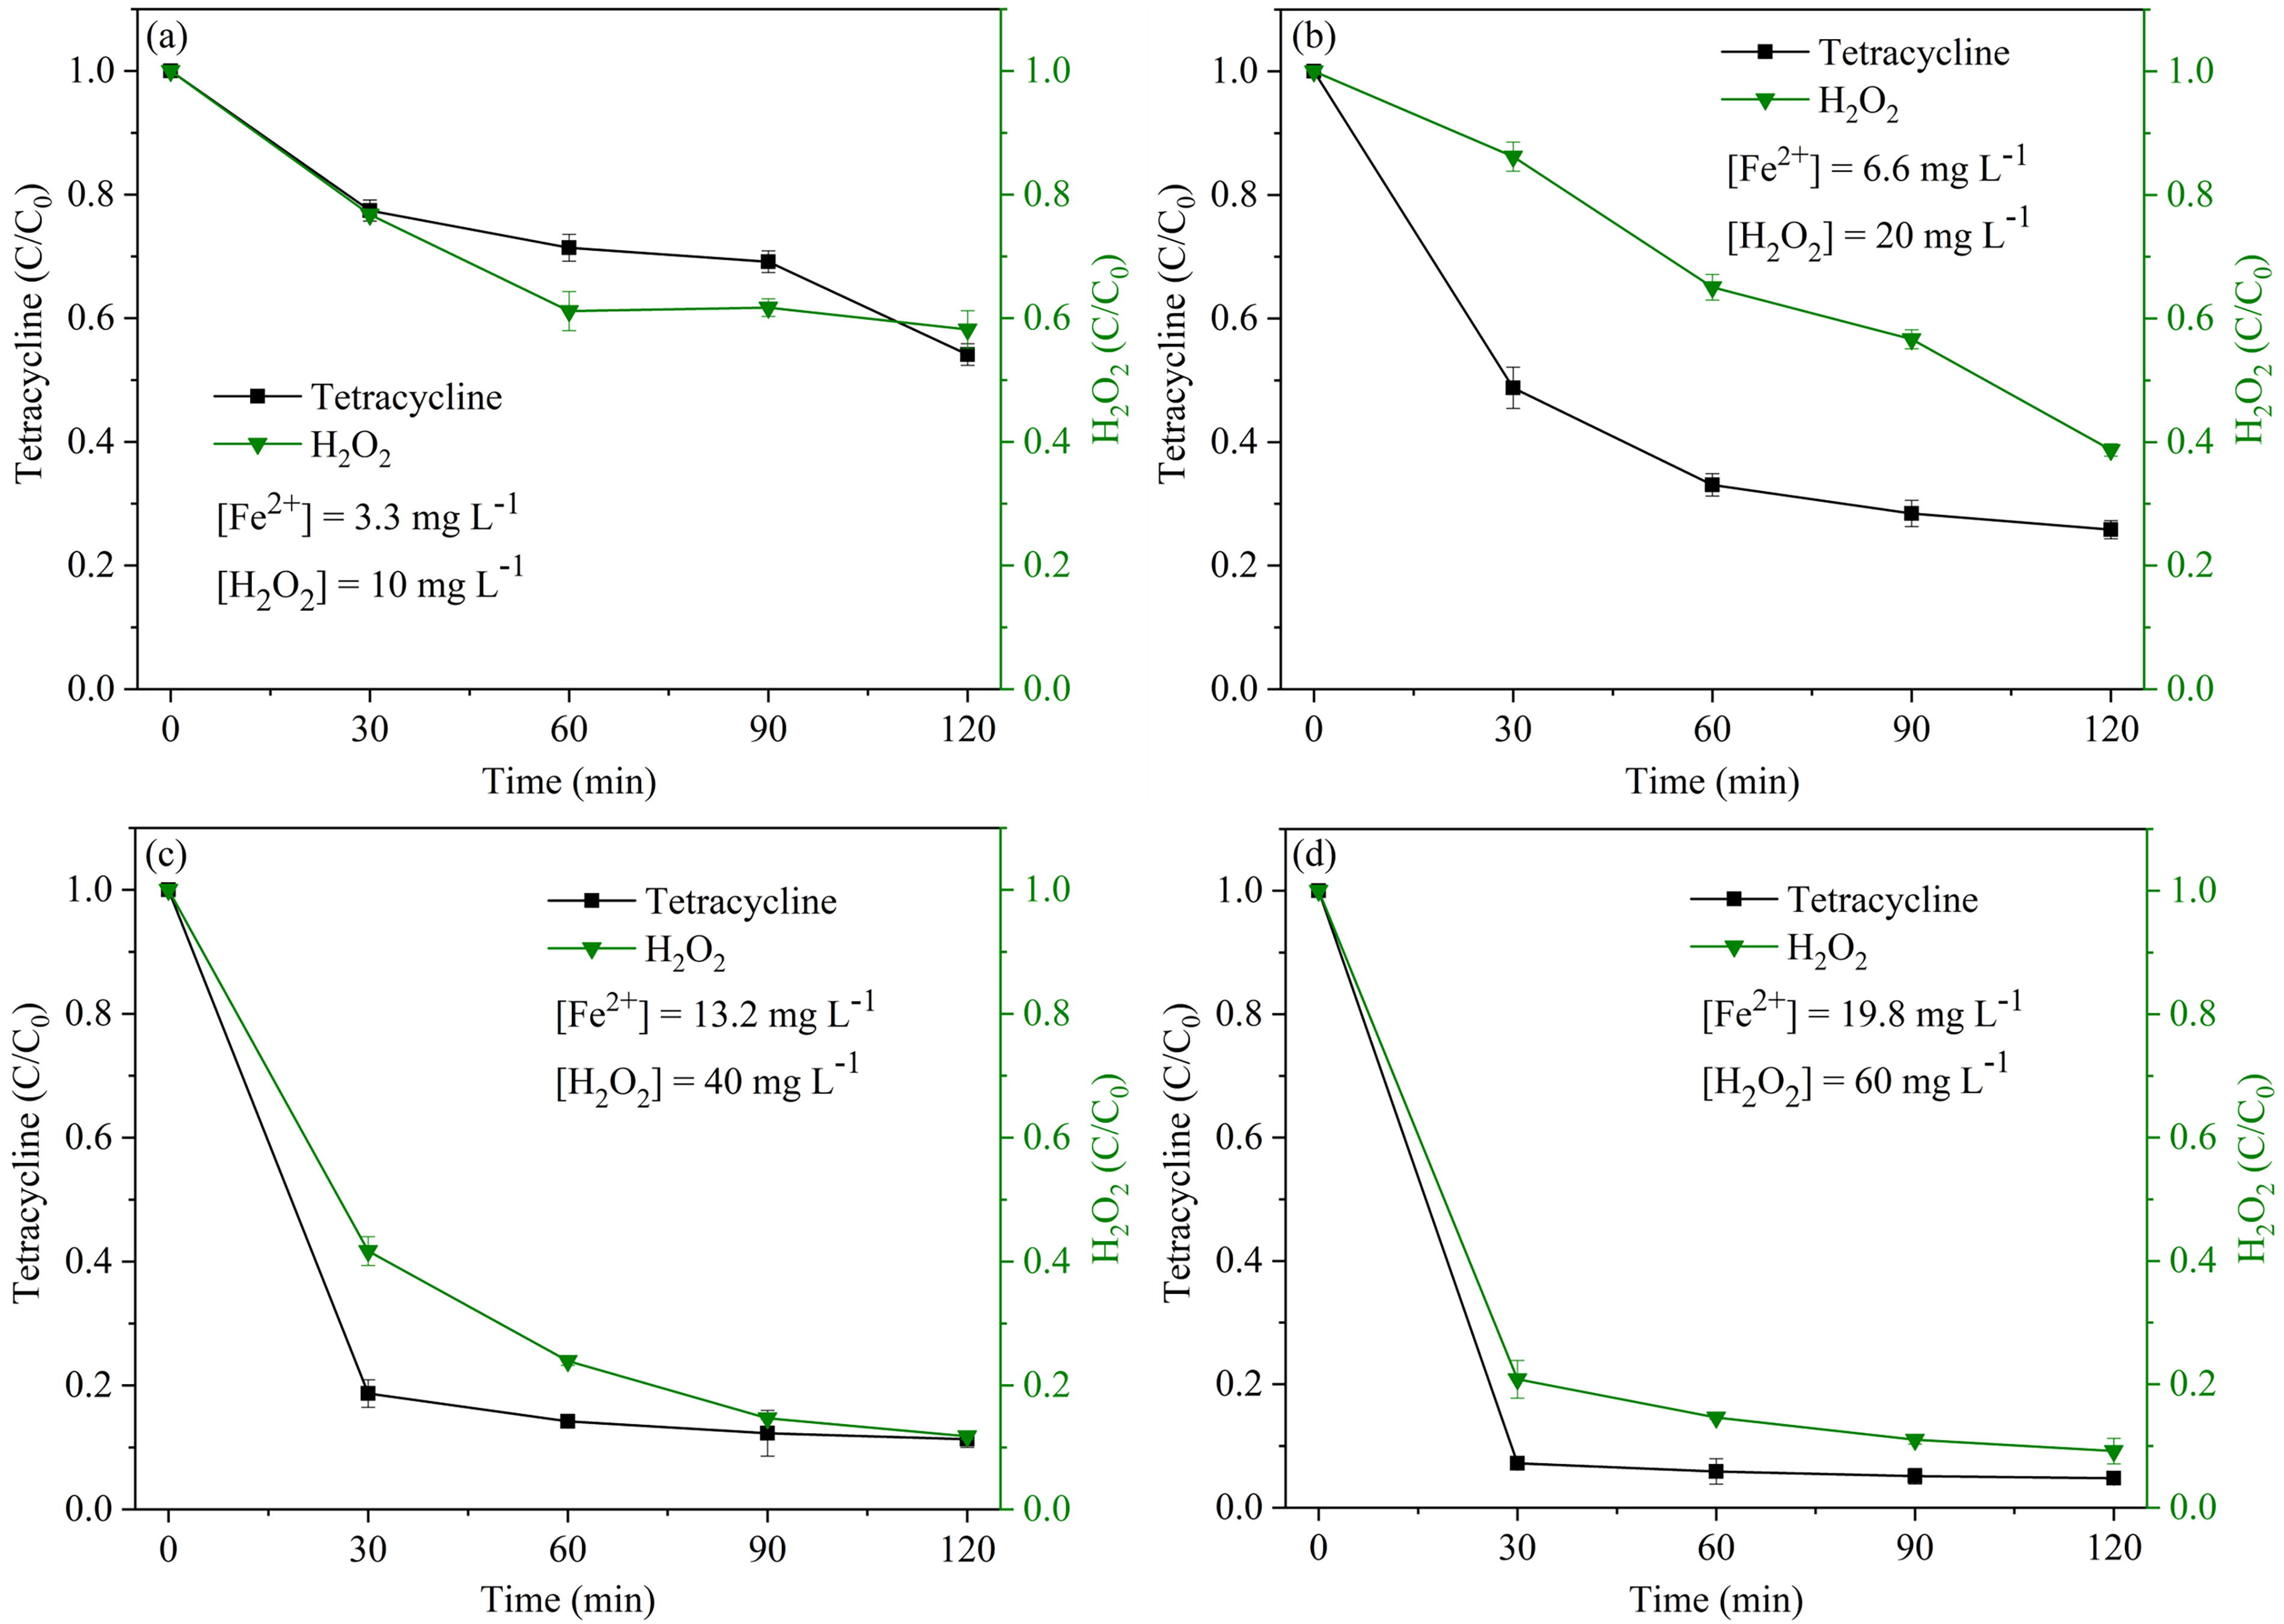
Degradation of TC by the H2O2/Fe2+ system with different dosages of H2O2 and Fe2+: 10 mg/L H2O2 and 3.3 mg/L Fe2+
To further learn the performance of the AC/H2O2 system toward organics degradation, 2# AC was used in this oxidation system for the degradation of 40 mg/L RhB and 100 mg/L PNP. As displayed in Figure 5a, after reaching the adsorption equilibrium, the RhB concentration decreased very slowly exhibiting nearly negligible RhB degradation under different pH conditions, which was similar to the TC degradation by the AC/H2O2 system. Additionally, the H2O2 concentration decreased by 42.0 mg/L at least after the degradation for 150 min. Figure 5b displays the degradation of RhB by the H2O2/Fe2+ system at pH = 3.0. It was found that RhB concentration decreased rapidly within 120 min as 40 and 60 mg/L H2O2 was used for the degradation. These results suggested that the H2O2/Fe2+ system presented much faster RhB degradation than the AC/H2O2 system under the condition of approximate H2O2 consumption.
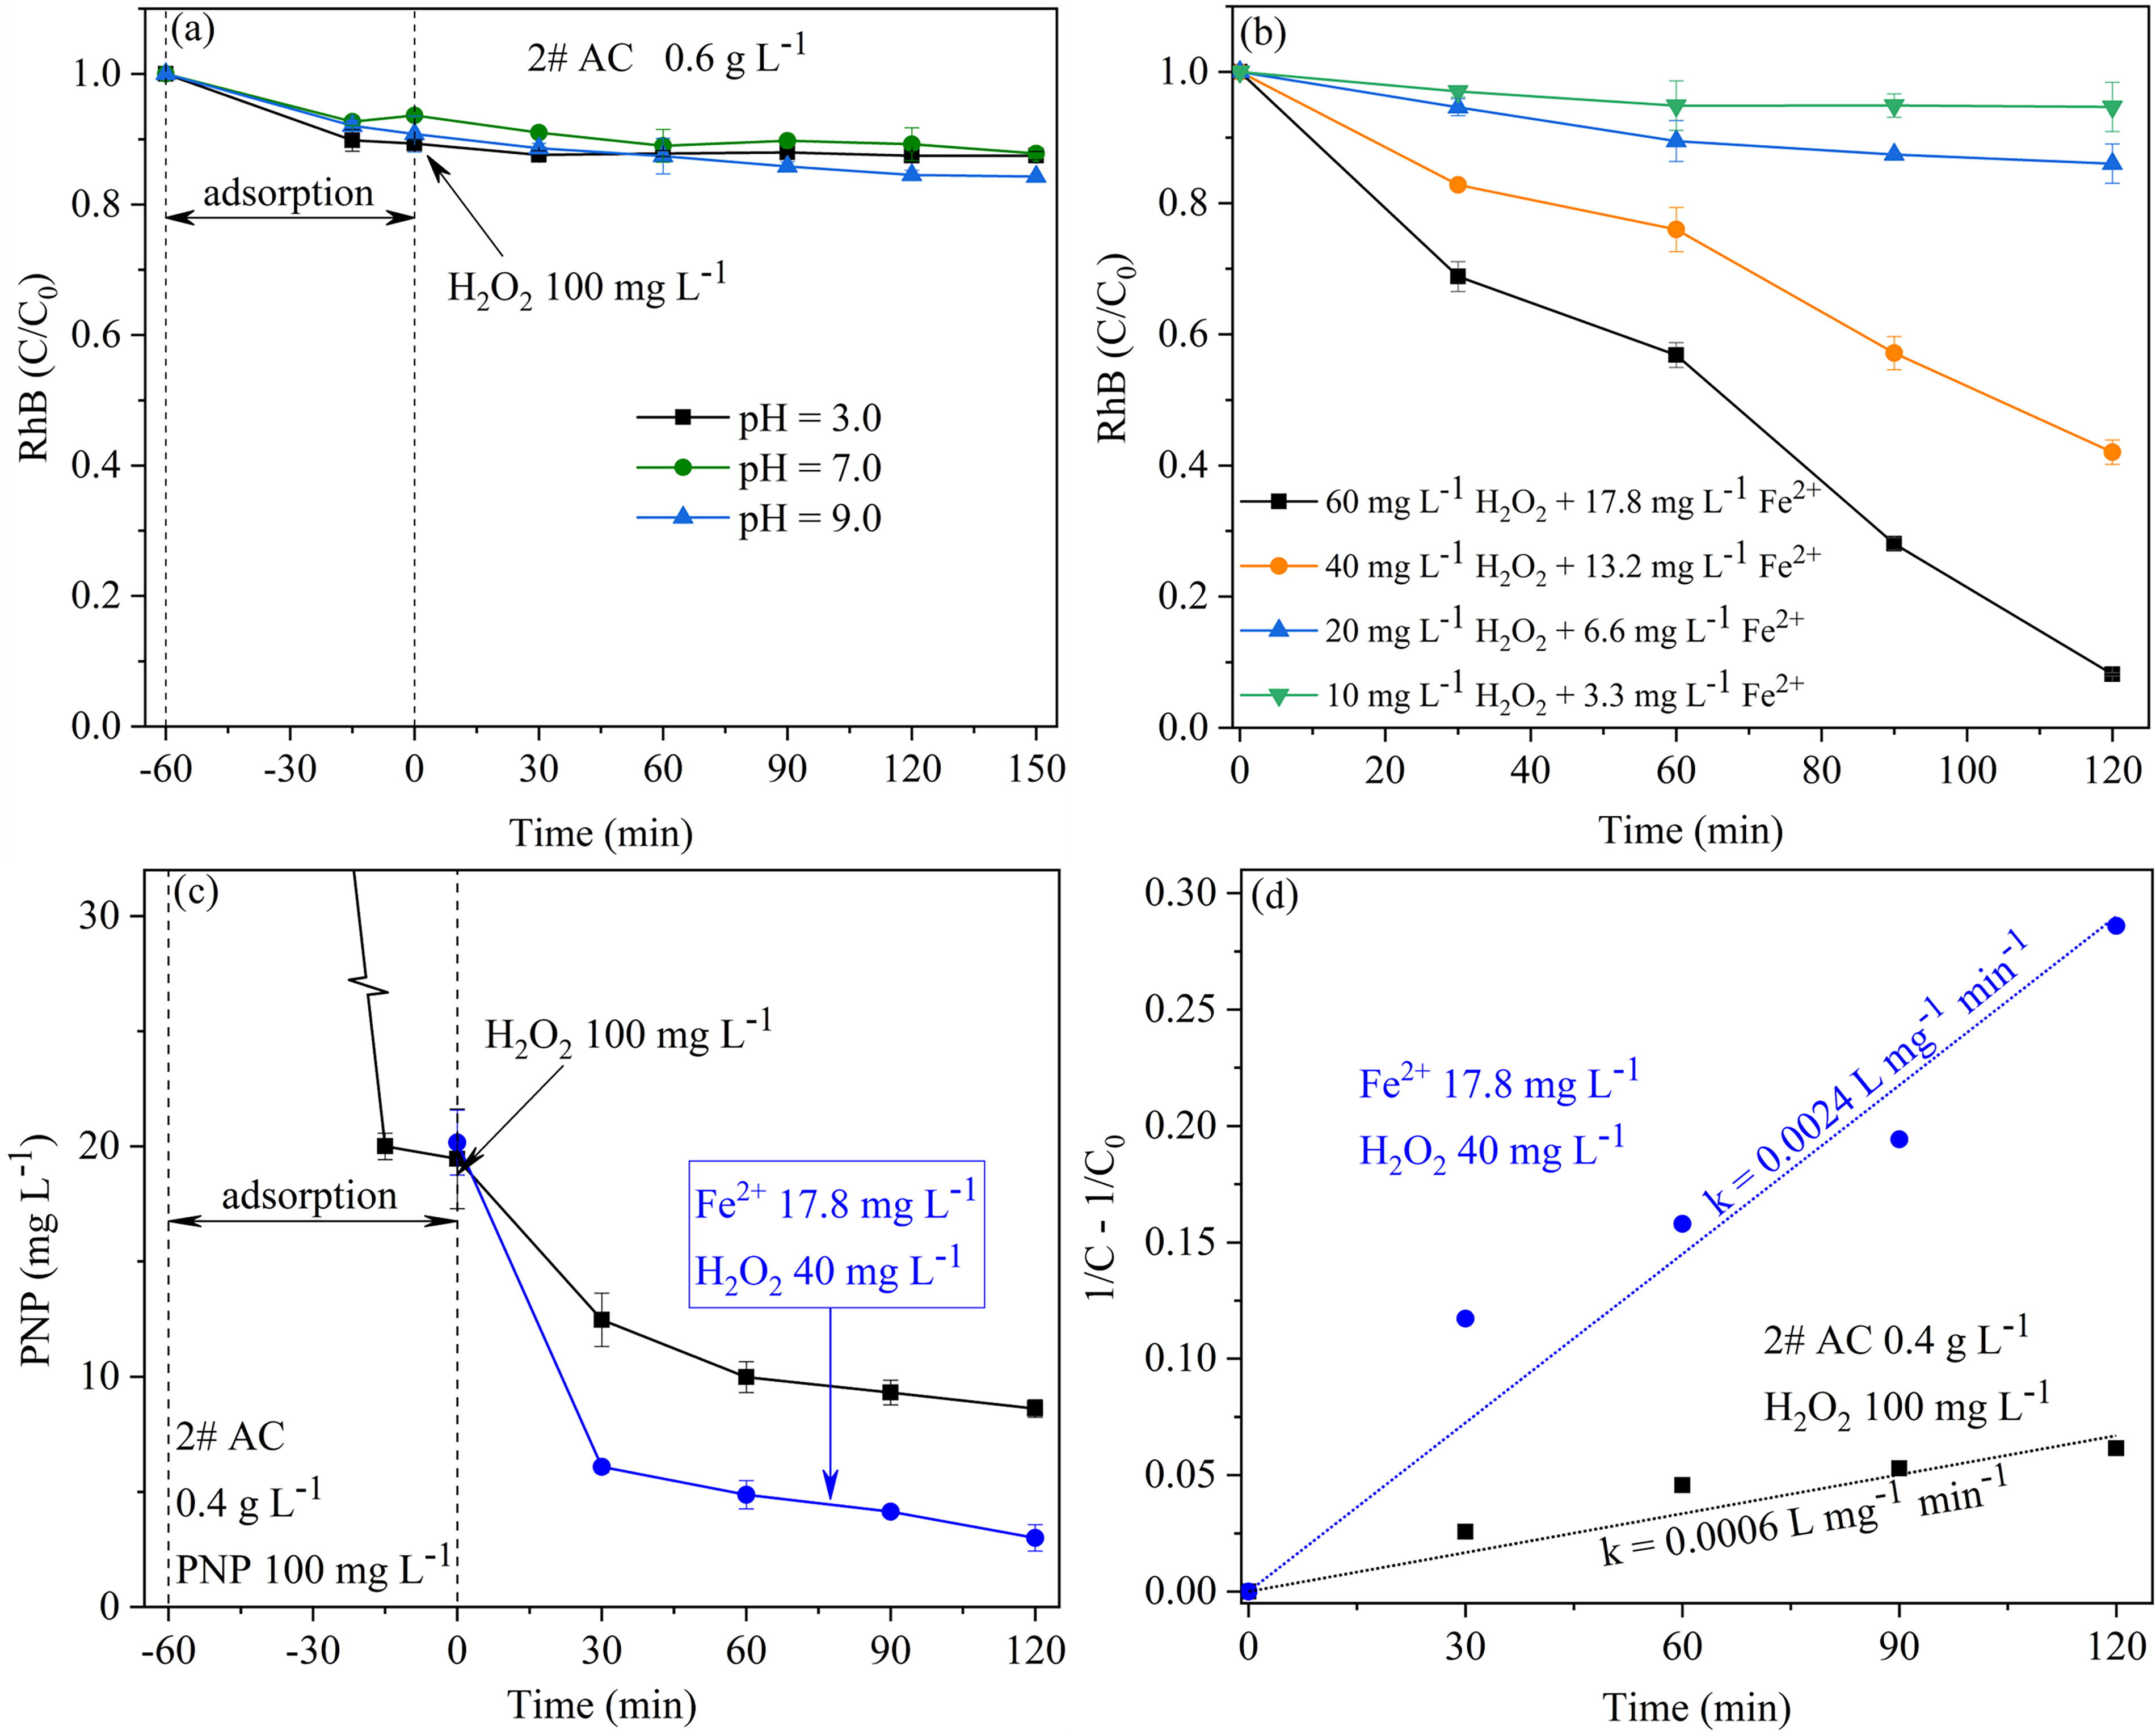
Degradation of RhB by the AC/H2O2 system with 0.6 g/L 2# AC and 100 mg/L H2O2 at different pH
The results of PNP degradation obtained from the AC/H2O2 system and the H2O2/Fe2+ system at pH = 3.0 are shown in Figure 5c. It was found that 2# AC possessed a powerful capacity toward PNP adsorption, and 2# AC of 0.4 g/L caused the PNP concentration to decrease to about 20 mg/L from the initial concentration of 100 mg/L. Prior to adding H2O2, adsorption equilibrium was approximately reached by the adsorption of 60 min. It was found that the degradation of PNP by the AC/H2O2 system for 120 min caused the concentration to decrease to 8.7 mg/L from about 20 mg/L and the H2O2 concentration decreased to 60 mg/L from the initial concentration of 100 mg/L. Thus, for the purpose of comparison, the degradation of 20 mg/L PNP by the H2O2/Fe2+ system with 40 mg/L H2O2 and 17.8 mg/L Fe2+ was conducted. PNP concentration decreased to 3.0 mg/L after degradation for 120 min, accompanied by complete H2O2 consumption. The degradation results in Figure 5c were further analyzed using the pseudo-second-order reaction kinetics. As shown in Figure 5d, the second-order rate constant k obtained from the AC/H2O2 system was 0.0006 L/mg·min, which was much lower than that obtained from the H2O2/Fe2+ system (0.0024 L/mg·min). Evidently, although the AC/H2O2 system was able to present a weak PNP degradation, its performance toward PNP degradation was far weaker than that of the H2O2/Fe2+ system. Based on the above results, it can be concluded that these ACs are not effective Fenton-like catalysts for organics degradation. This finding appears to be different from that reported in some studies, in which the AC/H2O2 system exhibited a certain capability for organics degradation. Besides the difference in surface chemical groups, the different contents of metal oxides in ACs may be another important reason for the different degradation performance (Anfruns et al., 2014; Fang et al., 2014). Usually, some metal oxides (e.g., CuO, Fe2O3) that existed in ACs can be beneficial to organics degradation in the presence of H2O2 (Wang and Tang, 2021).
Mechanism discussion
Numerous studies have revealed that the degradation of organic contaminants by AOPs mainly relies on the generation of various reactive oxygen species such as

ESR signals of DMPO-
Currently, unlike the H2O2 decomposition in the H2O2/Fe2+ system via the classical Fenton reactions generating
Conclusions
In summary, although the three AC materials prepared with coconut shell, glucose, and corn were able to cause evident H2O2 decomposition, the AC/H2O2 system presented negligible TC and RhB degradation and weak PNP degradation. The performance of the AC/H2O2 system toward organics degradation was much lower than that of the H2O2/Fe2+ system as the same amount of H2O2 consumed, indicating a very low H2O2 utilization efficiency in the AC/H2O2 system. The poor organics degradation and the weak ESR signals indicated that the H2O2 decomposition at AC surface mainly followed a nonradical pathway. According to the results achieved in this study, the role of ACs in the H2O2−involved AOPs should be considered seriously: Some ACs may be not effective Fenton-like catalysts, and furthermore, the evaluation on H2O2 utilization efficiency should attract more attention when ACs are utilized as catalyst supporters.
Footnotes
Authors’ Contributions
H.Z.: Investigation, methodology, and writing—original draft. F.C.: Investigation. Y.C.: Conceptualization, methodology, and writing—review and editing.
Author Disclosure Statement
No competing financial interests exist.
Funding Information
This work was supported by the National Natural Science Foundation of China under Grant 52370079.