




Abstract

Introduction
Vote-by-mail (VBM) began to gain momentum in the late 1980s and found the national spotlight in the early 1990s when Oregon citizens approved an initiative to conduct all elections by mail. Since then, VBM's popularity has expanded significantly, becoming the modal form of voting in several states, with potential for many more to follow. All counties but one in Washington State use VBM exclusively. In the 2008 general election, nearly 65 percent of all votes cast in Colorado were permanent mail ballots. 1 At the time of this writing, a majority of states have a form of VBM prior to the election without the need for the voter to submit a reason to obtain a mail ballot (National Conference of State Legislatures website). This form of voting, typically referred to as “no excuse absentee voting” is currently available in thirty states. It is important to note that there are several forms of vote-by-mail that exist across states, including those (such as Oregon's) in which law mandates that voting is conducted by mail and those (such as California's) in which voters have an option to cast their votes solely by mail. For the purposes of this article, we shall limit our analysis to the latter, which has also been referred to as permanent vote-by-mail. In this case, voters make the choice to submit a one-time request to become a VBM voter, and then cast future votes by mail.
Voters' choices to convert to permanent VBM status have not been studied until now. These choices may be quite complex and interesting. An easier, less costly voting mechanism that can be used at a time and place of their choice may appeal to some voters. For others, opting to use VBM may mean foregoing some significant psychological benefits of going to the polls, such as fulfilling expressive needs publicly (Fiorina 1976; Riker and Ordeshook 1968) or yielding to perceived social pressure to vote (Green et al. 2008). Moreover, some voters may feel uncomfortable voting without the assistance of poll workers, or trusting the U.S. Postal Service to deliver their mailed ballot to the correct destination. 2
In this article, we begin unpacking the dynamics behind the VBM choice.
After a state or county adopts VBM, will lowering the cost of signing up convert significant numbers of new voters to become permanent VBM voters?
When VBM does convert new voters, what types of citizens will be most likely to adopt VBM through the low-cost option?
To answer these questions, we combined a field experiment with supplemental survey research. We conducted our field experiment prior to the June 3, 2008, election in California's San Joaquin County, where signing up for permanent VBM is an option for registered voters. 3 We found that citizens who received information on VBM and opportunities to become VBM voters—in the form of already-filled-out postcards—are more likely to convert to that voting method.
Next, we used survey data to assess whether the effect of the treatment is conditioned by a voter's turnout frequency. We first investigated conversion rates within subsets of the population based on education, income, ethnicity, language, and homeowner status, and found that traditionally “high propensity” voting groups were more responsive to the postcard. We then used a multivariate probit model to look directly at the interactive effect of our treatment and prior turnout on conversion to VBM, and found further support for the notion that frequent voters are more likely to respond to VBM conversion efforts. These findings extend the logic of Berinsky (2005; Berinsky et al. 2001) that shows that among VBM voters, turnout improved mainly amongst already high-propensity voters. Our analysis focuses on voter participation prior to the voting stage, asking whether an outreach effort draws more citizens into the voting process by encouraging them to register as permanent vote-by-mail voters.
In the next section, we survey previous literature, providing the foundation for our theoretical framework and core hypothesis, which occupy the section that follows the literature review. With predictions in place, we proceed to describe our field experiment and results, then give our supplementary analysis using survey data. In the final section, we briefly summarize and conclude.
Whither Vbm?
As VBM has grown in prevalence, particularly in the western portion of the United States, the VBM movement has become a highly controversial electoral reform in the voting literature. Some scholars have found evidence of VBM's positive impact, for example cost savings, increased turnout, improved convenience of voting, and increasing acceptance among the electorate and election administrators. For instance, elections conducted entirely by mail are approximately 33–50% less expensive to run than elections conducted entirely at polling places (Southwell 2004). Moreover, some have found that VBM increases the percentage of registered voters turning out to vote (Gronke et al. 2007; Southwell and Burchett 2000). 4 And, in her analysis of the Oregon VBM system, Southwell (2004) finds widespread majority support for the system five years after its adoption for all elections. Her findings seem to cast doubt on the notion that high initial rates of support for VBM were based on the novelty of the system rather than true satisfaction.
On the other hand, skeptics suggest that VBM “has not changed who makes up the electorate, but only how they vote” (Fortier 2007). In other words, rather than adding new voters to the pool of voting Americans, VBM seems to improve the convenience of voting for those who were already inclined to vote, and this effect seems fairly robust across election types such as special elections (Southwell and Burchett 2000) as well as primary and general elections (Berinsky et al. 2001). Berinsky et al. therefore argue that any increase in the voter pool is based strictly on better retention of previous voters, rather than mobilization of new recruits (Berinsky et al. 2001).
Furthermore, some scholars have found that pernicious effects may result from the institution of VBM. Berinsky, for instance, found evidence across multiple studies that VBM may contribute to widening socio-economic gaps in turnout, such that more educated, older, higher-income, and Caucasian voters would enjoy higher rates of turnout owing to VBM (Berinsky 2005). Kousser and Mullin also found a slight but statistically significant reduction in voter turnout when comparing VBM districts to traditional-polling-place districts (Kousser and Mullin 2007). 5
No previous research on VBM, however, has focused on voters' choices to convert to VBM. In a state where both traditional voting and VBM choices exist, which citizens will choose to vote by mail? One motivation behind the VBM movement is the notion that it will open up voting to segments of the population that currently find it difficult to vote. Does this low-cost voting option really draw in voters who find it too difficult to get to the polls? In the next two sections, we tackle these questions, first theoretically and then empirically.
Cutting Costs of Signing Up For Vbm
Downs (1957) proposed that would-be voters consider the costs and potential benefits of voting before deciding to do so. The strictest interpretation of his framework seems to fall flat: In most cases, a single vote will not be decisive, and if Downs is correct, no “rational” person should show up and vote.
Inaccurate though that prediction may be, there is still something appealing about the basic calculus of voting that it suggests. Specifically, it seems useful to assume that, in broad terms, as the costs of voting decrease, citizens are more likely to vote, all else constant. A voter who lives 30 miles from the polling place is almost certainly less likely to vote, on average, than someone who lives across the street.
But how does the notion of the cost of turning out to vote relate to the decision to sign up for VBM? VBM is considered a lower-cost voting option, but VBM sign-up carries its own costs. Compared to the act of locating and traveling to a polling site for each election, becoming a permanent VBM voter carries a one-time cost that typically takes attention, effort, and knowledge. This up-front, fixed cost of signing up for VBM must be made up for in cost savings over all the future instances when the voter uses VBM instead of paying the extra cost to go the polls.
The flow chart in Figure 1 illustrates this point. The voter, represented in the oval on the far left, faces three choices: Pay no cost and do not vote; pay cost C to vote in person; or pay cost V to sign up for permanent VBM status, and then pay cost M to vote by mail. Assuming, however, that there is a latent preference to cast a ballot, the relative size of the costs outlined here are instructive. Of course, where the cost of signing up for VBM plus the cost of casting a ballot by mail is lower than the cost of showing up to vote (i.e., V+M<C), even for one election, then voters obviously have an incentive to sign up for permanent VBM. But notice the permanent part of VBM. Even where it would be cheaper in the short run (one or two elections, perhaps) to simply vote in person, the voting discount from VBM can eventually offset the initial cost, V, of signing up.
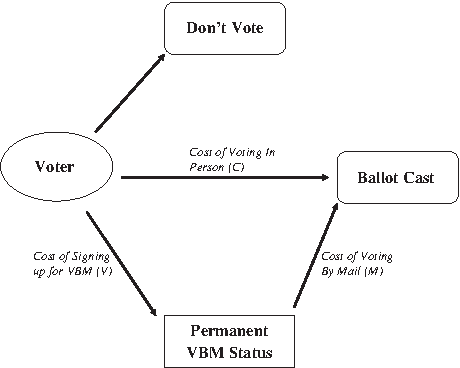
Costs of voting in person and by mail. VBM, vote-by-mail.
Either way, if citizens face lower costs of signing up for VBM, they will find it more appealing to convert. Thus,
As noted earlier, individuals with lower socioeconomic status (SES) tend to vote at significantly lower levels, even when offered lower-cost options like VBM (Berinsky 2005; Berinsky et al. 2001). Indeed, such lower-cost options may actually lead to wider gaps in turnout if higher-SES individuals take advantage of these options while low-SES individuals do not. However, what if there is an even lower-cost way of signing up for a low-cost option such as VBM? Despite an overall increase in the number of individuals signed up for VBM, if Berinsky (2005) is correct, certain subgroups of the population will be less motivated by sign-up cost reduction efforts such as an already filled-out postcard. Thus, Berinsky's argument implies the following about the decision to convert to VBM:
In the next section, we evaluate this hypothesis with the results of a field experiment and survey supplement.
Undoubtedly, this rational voter framework excludes certain other factors that drive individual decisions to turn out, such as the psychological benefits of behaving in an altruistic manner (Jankowski 2002), fulfilling one's civic duty (Hardin 1982), satisfying one's expressive needs in a public setting (Fiorina 1976), or acquiescing to social pressure (Green et al. 2008). Indeed, the presence of such psychological motivations to vote—and to vote publicly—may imply our null hypothesis that offering a low-cost alternative to voting in person will have no effect on the decision to vote by mail. In other words, inasmuch as psychological motivations drive the choice of voting method, variation in conversion costs should be less relevant.
Research Design: A Field Experiment
To test our hypotheses, we ran a field experiment 6 using the entire registered voting population of San Joaquin County, California, as our subject pool. 7 Unlike observational studies, experimental research boasts stronger causal inference about treatment effects “through the transparency and content of experimental procedures, most notably the random assignment of observations to control and treatment groups” (Druckman et al. 2006, 627). Random assignment thus provides a more lucid test of the explanatory variable of interest, alleviating persistent methodological problems pertaining to inference (Bergan 2009; Ha and Karlan 2009; Bedolla and Michelson 2009).
We focused our efforts on the June 2008 statewide primary election. Using this as our election of interest is ideal insomuch as field experimental studies on voter turnout have been shown to be more effective in less salient non-presidential elections (Gosnell 1927; Gerver et al. 2003). We began by using an algorithm to randomly identify 60 percent of the voting precincts within the county as our treatment group. 8 This group consisted of approximately 250 precincts, containing a total of 101,553 registered voters, leaving a control group of approximately 160 precincts and 82,903 voters. 9 On April 15, 2008, all registered voters in the treatment group who were not already signed up for permanent VBM were sent a postcard. The postcard informed them about the option of permanent VBM status. It was pre-printed with their name and other information, already had the box check-marked to indicate desire to become a permanent VBM voter, and included return postage (see Figure 2 for a picture of an example postcard). Voters needed only to sign their name and put the postcard back in the mail in order to gain permanent VBM status.

Vote-by-mail postcard mailed to treatment group.
Of course, not all the voters in the treatment group actually got the postcards, paid attention to them, understood them, and considered the VBM option. However, it seems safe to assume that since no one in the control group got a postcard, the rate of voters who received the treatment was much higher in the treatment group. In this way we are estimating the intent-to-treat (ITT) effect (Gerber and Green 2000; Arceneaux 2005).
We turn first to consider Hypothesis 1, that by reducing the start up costs of VBM, more voters will obtain permanent VBM status. For those in the control group, becoming a permanent VBM voter would have required considerably more effort than simply returning a pre-completed postcard with their signature. 10 Certainly, then, voters in our treatment group who received our postcard had a significantly lower cost of signing up for VBM. Thus, based on Hypothesis 1, we should expect to see a significantly larger proportion of voters signing up for permanent VBM status in the treatment group than in the control group.
As shown in Figure 3, that is just what we found. Of the 101,553 individuals who received the postcard treatment, 20,400 (20%) subsequently converted to permanent VBM status before the June election. The control group of 82,903 subjects, on the other hand, yielded only 8,151 (10%) new permanent VBM voters during the same time period. The conversion rate in the treatment group was approximately double that of the control group, and the difference is highly statistically significant (p<.001). At first glance, this result is encouraging. It seems that, ceteris paribus, by lowering the start-up cost of entry into permanent VBM status, voters are substantially more likely to take advantage of this option. However, results obtained from our survey supplement demonstrated that not all else is equal. In the next section, we review these findings.

Voters converted to vote-by-mail by postcard mailer. Difference significant at better than 0.001.
Survey Supplement
To supplement our field experiment, we ran a survey of voters in San Joaquin County in May 2008, leading up to the June election, to help us gain more information about our population of interest. The Social Science Research Center (SSRC) at California State University, Fullerton, conducted a telephone survey completing interviews with 542 registered voters in San Joaquin County. Five hundred nine (93.9%) interviews were completed in English and 33 (6.1%) in Spanish. 11 The actual survey instrument can be found in Appendix 1. By surveying a sample of registered voters in San Joaquin County, we can better evaluate our second hypothesis, that the impact of the postcard treatment on conversion to VBM will be conditioned on a voter's likelihood of turnout and on their socioeconomic status. 12
Conditioning the treatment on individual characteristics
It is well known that there is a significant turnout gap based on a number of socioeconomic factors, with members of lower-SES groups less likely to turn out. Contrary to the hopes of reformers, Berinsky's work (2005; Berinsky et al. 2001) shows that these turnout differences are sustained—or even increased—by VBM. Here, we move one step back in the process, asking whether the VBM turnout gap might begin to widen at the juncture where citizens choose how they will vote—in person or by mail. If citizens who are already likely to turn out respond to the low-cost VBM conversion option, while low-propensity voters fail to respond, it would indicate a selection effect that precedes the choice to turn out but has important implications for the makeup of the active electorate.
Table 1 shows the effect of the postcard treatment on conversion to VBM, broken down by education level. Among those with the lowest levels of formal education—specifically, those with a high school degree or less—the decision to convert to VBM was unaffected by the receipt of a VBM postcard reminder, in line with our second hypothesis. In contrast, among those having at least some college education or an associate's degree, receiving a postcard made an individual significantly more likely to sign up for VBM, and the result was substantial. The receipt of a postcard among those with some college education more than doubled the probability of signing up. Among those with an associate's degree, the card more than tripled the probability of converting to VBM. Though we see similarly large effects in more educated groups, in substantive terms, they fall short of statistical significance (these effects are not great enough to be differentiable from pure chance).
Cell percentages represent the proportion of registered voters who converted to permanent VBM status during our target period. The proportion in parentheses represents the number of converts in that group (numerator) over the total number of individuals in that group (denominator), where “groups” are defined by the combination of an education level and the treatment/control condition. The final column (Pr |Z|<|z|)) indicates the results of a difference of proportions test between the control and treatment conditions in a given row. **indicates p<.05, for a two-tailed test.
In Table 2, we see that postcard treatment effects are discernable only among those with the highest level of income. Receiving a postcard reminder has no statistically significant effect on the decision to register for VBM except among those earning more than $100,000 per year. That said, once a voter reaches an annual income of at least $30,000, increasing levels of income substantively increase the probability that a postcard reminder will induce conversion to VBM. These effects fail to reach statistical significance because of small sample sizes in each category. 13 Among those earning more than $100,000 per year, the receipt of a postcard increases the probability that one will convert to VBM nearly seven-fold.
Cell percentages represent the proportion of registered voters who converted to permanent VBM status during our target period. The proportion in parentheses represents the number of converts in that group (numerator) over the total number of individuals in that group (denominator), where “groups” are defined by the combination of an income level and the treatment/control condition. The final column (Pr(|Z|<|z|)) indicates the results of a difference of proportions test between the control and treatment conditions in a given row. **indicates p<.05, for a two-tailed test.
Racial/ethnic identification held the pattern for responsiveness to the postcard treatment: Groups with historically lower turnout were not converted at higher rates. We see in Table 3 that receiving a postcard reminder has no statistically significant effect on the decision to register for VBM among African Americans or Latinos. In contrast, Asians receiving a VBM postcard were more than ten times more likely to register for VBM, and Caucasians were more than twice as likely to register.
Cell percentages represent the proportion of registered voters who converted to permanent VBM status during our target period. The proportion in parentheses represents the number of converts in that group (numerator) over the total number of individuals in that group (denominator), where “groups” are defined by the combination of racial/ethnic group and the treatment/control condition. The final column (Pr(|Z|<|z|)) indicates the results of a difference of proportions test between the control and treatment conditions in a given row. **indicates p<.05, for a two-tailed test.
Among non-English speakers who are registered to vote, VBM should theoretically be a preferred option for casting a ballot, as it allows individuals to seek additional time and/or assistance outside the polling place. This would enable them, for instance, to find a family member or friend who could help translate election options in a less-pressured environment than the polling place. Results in Table 4, however, demonstrate otherwise. Among individuals who speak a language other than English at home, we found that receiving a postcard mailer had no statistically significant effect on registering for VBM. In contrast, among English-only speakers, receipt of a postcard doubled the probability that a voter would register for VBM. The lack of findings here for non-English speakers is likely due to the fact that the costs of signing up for VBM at the outset may actually be higher for them, given the difficulty in comprehending and completing the VBM application.
Cell percentages represent the proportion of registered voters who converted to permanent VBM status during our target period. The proportion in parentheses represents the number of converts in that group (numerator) over the total number of individuals in that group (denominator), where “groups” are defined by the combination of language spoken at home and the treatment/control condition. The final column (Pr(|Z|<|z|)) indicates the results of a difference of proportions test between the control and treatment conditions in a given row. **indicates p<.05, for a two-tailed test.
For those who own their homes versus those who rent, the effects of the postcard are somewhat less clear. On one hand, homeowners tend to turn out at a higher rate and are more likely to have consistent addresses. Both these factors imply that they may be more likely to convert to VBM. On the other hand, renters may be unfamiliar with polling locations and may prefer the mobility afforded by VBM.
Empirically, however, the homeowners' propensity toward higher voter turnout bore out in VBM conversion rates (Table 5). Homeowners who received the postcard were three times more likely to convert than homeowners in the control group. For renters, however, the treatment and control groups were statistically indistinguishable.
Cell percentages represent the proportion of registered voters who converted to permanent VBM status during our target period. The proportion in parentheses represents the number of converts in that group (numerator) over the total number of individuals in that group (denominator), where “groups” are defined by the combination of homeowner status and the treatment/control condition. The final column (Pr(|Z|<|z|)) indicates the results of a difference of proportions test between the control and treatment conditions in a given row. **indicates p<.05, for a two-tailed test.
Conditioning the treatment on prior turnout
To more directly evaluate Hypothesis 2, we conducted a multivariate analysis to assess the effect of prior turnout and our postcard treatment on conversion to VBM (Table 6). Using probit (with robust standard errors), we estimate three iterations of the following model: 14
Table displays coefficients, with standard errors in parentheses.
Significant at .10, **Significant at .05, ***Significant at .01, two-tailed tests.
Dependant Variable: Switched to VBM.
Estimation Technique: Probit with robust standard errors.
ConvertVBMi = α + β1Postcardi + β2PriorTurnout%i + β3Postcard*PriorTurnout%i + [β4.nControlsi]+ɛik
The dependant variable for all three models, ConvertVBMi, equals 1 if an individual converted to VBM during the treatment period, and 0 otherwise. The first model is the most basic, including just two independent variables:
Postcardi , which equals 1 if an individual received the postcard treatment (as described above), and 0 otherwise
PriorTurnout%i, which measures the frequency of turnout (as a percentage) for an individual for all seven elections held in San Joaquin County from March 2004 through June 2008. This is verified vote data obtained from the San Joaquin Country Registrar of Voters office.
The second model adds our key variable, Postcardi*PriorTurnout%i, which is an interaction of the two previous variables. 15 Based on Hypothesis 2, if high propensity voters are more likely to convert to VBM based on the postcard, then the interaction term should be positive and significant.
In the third model, we add several control variables to check the robustness of our results. The controls are as follows:
HighCosti, a dummy variable that equals 1 if an individual reported lack of transportation, child care issues, or too many hours of work on Election Day as difficulties related to going to the polls
Marriedi, a dummy variable that equals 1 if a respondent is married
Educationi, an ordinal variable ranging from 1 (“less than high school diploma”) to 6 (“a graduate or professional degree”)
Englishi, a dummy variable equal to 1 if only English is spoken in the respondents home
Ideologyi, a five point scale ranging from 0 to 1, where 0 is very liberal and 1 is very conservative
Homeowneri, a dummy variable equal to 1 if the respondent owns his/her home
Caucasiani, a dummy variable equal to 1 if the respondent is Caucasian
Religiosityi, an ordinal variable indicating the frequency of attending religious services, ranging from 0 (“less than a few times per year”) to 1 (“every week”).
Table 6 includes results from all three probit models. In Model 1, we see that, as expected, our postcard treatment had a positive and strongly significant (p-value <.001) impact on individuals' conversion to VBM, while prior turnout percent falls just short of a significant negative impact (p=.106). In Model 2, however, when we include our key interaction term, this variable subsumes the positive impact of the treatment's main effect. In other words, the effect of being a frequent voter who receives a postcard is more powerful than the mere receipt of a postcard (so much so that taking that interaction into account makes the postcard receipt variable statistically insignificant). Here we see that among those who received the postcard treatment, more frequent voters were significantly more likely to convert to VBM (p-value=.043).
This result holds in the third model (p-value=.064), where we include our battery of control variables. Though for the most part we do not have strong predictions about our control variables, we find one result particularly interesting. High-cost voters—those who report that they have extra obstacles to voting in person on Election Day—are significantly more likely to convert to VBM. However, in separate analysis, we re-ran the model using an interaction term between Postcard and HighCost to see if these high-cost voters were more responsive to the postcard, and we found no significant result. This could be attributable to the fact that high-cost voters convert at a high rate, even when it is relatively costly to switch to permanent VBM status—they could be signing up just as well without the pre-printed postcard as with it, or many may have already signed up prior to the 2008 contest.
In sum, the effect of the treatment seems to be conditioned by turnout frequency. This shows up in the comparisons of the treatment effect across groups traditionally thought of as high propensity (high-income, educated, Caucasian, English-speaking) and low propensity (low-income, less educated, non-white, non-English-speaking) voters. More directly, our multivariate analysis shows that the more frequently a voter turns out, the larger the effect of the postcard treatment.
Our findings lend support to Berinsky's conclusion that VBM actually increases the socio-economic gap between voters and non-voters by increasing the probability that wealthy, educated, English speaking Caucasians and Asians vote. A possible explanation for this owes to the decision-making behavior of infrequent voters. Infrequent voters, typically lacking strong partisan and ideological attachments, tend to make their candidate selections very late in the election cycle, close to Election Day (Stein 1998). As such, late deciders may not see the payoff in submitting their vote early, particularly if that state requires receipt of the mailed absentee ballot by or before Election Day. To the extent that such infrequent, late-deciding voters are disproportionately lower in SES, VBM may not seem like a very appealing option after all.
Conclusion
Over the past several decades, states have adopted a series of “convenience voting” options, hoping to increase electoral participation and accessibility. The most popular and widely used among these, Vote-By-Mail, has drawn significant attention from scholars seeking to understand the impacts of this voting reform, especially with respect to voter turnout. However, no previous study has stepped back to consider voters' choices about whether to become permanent VBM voters. On one hand, the VBM option offers voters a “low cost” option that may be appealing for citizens that find it difficult to make it to the polls on Election Day. On the other hand, voting by mail may be unappealing to citizens if they forgo important psychological benefits of voting in person or suffer uncertainty about whether their mailed vote will be counted.
Using an innovative, mixed method approach, this study has demonstrated the powerful impact of an active VBM campaign conducted at the county level. Our field experimental and survey research results lend strong support to our hypothesis that decreasing the costs associated with registering for permanent VBM will lead to greater rates of permanent VBM registration. However, these increases are asymmetrically distributed across the voting population; conversion to permanent VBM status is more likely to occur among those who already turn out at relatively high rates.
Berinsky and his associates made this distinction in turnout levels in terms of retention of those inclined to vote versus recruitment of new voters to the turnout pool. Efforts aimed at increasing the convenience of voting seem to affect retention rather than recruitment. Specifically, the findings in this paper strongly support the findings that measures aimed at increasing rates of registration for VBM will disproportionately increase levels of retention of those predisposed voters, rather than recruitment of new ones. Thus, those who hope to increase the representativeness of voting populations may do well to focus on education campaigns tailored more specifically for low propensity voters, since blanket campaigns to make voting more convenient seem to largely make the act more convenient for those who will vote either way.
Footnotes
Stephanie Cegielski, Colorado Department of State, personal communication with the authors, April 14, 2010.
Some respondents from our survey (described later in the article) cited both of these concerns as reasons they would not consider converting to VBM.
San Joaquin County is a fairly diverse county racially and ethnically. According to the U.S. Census' American Community Survey estimates from 2005–2007, San Joaquin County's ethnic makeup was as follows: White 63.7%; Black/African American 7.5%; Asian 14.4%; Hispanic/Latino (any race) 35.7%.
It is important to note here that many scholars conducting VBM research (such as Gronke et al.  ) are focused on elections that are conducted in states or counties that already use all-mail elections. This distinction is critical in a variety of ways. Of particular relevance here, voters in these places do not have the choice to become VBM voters (e.g., see Arceneaux et al. 2009). An important exception is Kousser and Mullin (2007), where some voters are randomly forced to use VBM. Kousser and Mullin compare these voters' turnout to voters that have the option to vote at the polls.
In addition, increasing emphasis on VBM may be missing the mark if other factors are more strongly indicated in decreasing levels of voter turnout. For instance, Gerber and Green find robust evidence that voter mobilization efforts that feature the personal touch of face-to-face contact were significantly more effective at turning out the vote compared to more impersonal efforts (Gerber and Green 2000; Green et al. ).
One could debate the characterization of our research design as an “experiment” rather than a “quasi-experiment.” Though our design has true random assignment—a hallmark of a true experiment— it is not conducted in a controlled environment. Moreover, one could object that because our treatment was “sent” to our treatment group, but we can't be certain it was received in every case, it violates the requirements for a true experiment. We acknowledge these objections, but still would argue that our design falls closer to an experiment than a quasi-experiment.
This experiment is part of a larger project run through the Jacoby Center at the University of the Pacific, by contract and in conjunction with the San Joaquin County registrar for voters. Funding for the project originated with the Help America Vote Act (HAVA), and was directed to the SJC Registrar through the office of the California Secretary of State. Other parts of the project include efforts to reduce voter errors and improve poll worker training.
More precisely, about 116,000 voters were mailed postcards, but roughly 15,000 cards were returned undeliverable. We exclude these undeliverable cases from the denominator in calculating our cases. One might argue that we should either include them or calculate an equivalent proportion to subtract from the control group denominator, since the control group could not be similarly cleaned through returned postcards. That is, presumably, there are some voters counted in the denominator of the control group who would have been purged had we sent them a postcard and had it returned. Inasmuch as this was true, that means the percentage calculations for the control group conversions should be larger. However, even if the control group denominator were purged at roughly the same rate as the treatment group—which would mean reducing the control group denominator by about 11,500—the difference in proportions between the converted voters across the two groups is still highly significant.
Note that, between the time the postcard was sent out and the June 3 election (when we assessed the number of new permanent VBM voters), there were television ads running on local cable stations that aimed to make voters more aware of VBM, thus lowering the information cost for signing up for VBM. However, any effect these ads had should have been evenly distributed across treatment and control groups.
Telephone surveys were administered between May 5 and May 29, 2008. The survey questionnaire was programmed for administration using computer-assisted telephone interviewing (CATI) software. The SSRC utilizes the Ci3 CATI software package, the same system supported by the Centers for Disease Control and Prevention (CDC) for their statewide and national surveys. Interviews were conducted between 4 p.m. and 9 p.m. local time Monday through Thursday, and between 11 a.m. and 7 p.m. local time Saturday and Sunday. The sample frame for this study is the roster of registered voters in San Joaquin County. The voter registration file was annotated to indicate voters who had received an educational mailing antecedent to the study (n=101,558), those slated to receive a mailing in the future (n=82,909), and those already registered as “Permanent Absentee” (n=61,061). Because one goal of this study was to investigate the effect of a voter education mailing on intentions to convert to VBM, “Permanent Absentees” (those already voting by mail) were excluded from the sample frame. Subtracting voters for whom telephone numbers were either missing or incomplete from those who had already received the educational mailing (101,558 – 12,449=89,109) and from those scheduled to receive a future mailing (82,909 – 8,697=74,212) produced a sample frame consisting of 163,321 voters with valid telephone numbers. From this pool, a random sample of 2,012 was selected. Nine hundred ninety-three (49.5%) of these had received the mailing and 1,019 (50.6%) had not.
We can also use the survey sample to verify that our random assignment created roughly equivalent treatment and control groups. Looking across a series of relevant variables, it seems to have done so. Looking at selected categories as examples, we see that the percentage of Caucasians (treatment=56%, control=64%), percentage graduated from college (treatment=16%, control=14%), percentage over 60 (treatment=23%, control=23%), percentage making more than $125,000 per year (treatment=13%, control=15%), and percentage speaking only English in their home (treatment=76%, control=80%) all suggest a roughly equal distribution.
A caveat must accompany our discussion of these income effect results. It is well known in survey research that a large percentage of individuals who are willing to answer relatively personal survey questions will refuse to answer questions about income. Indeed, in our survey, fewer than 50 percent of our respondents were willing to answer what level of income they earned. As such, given a very small sample of individuals willing to report income, we should be encouraged by the fact that these results reached statistical significance at all. Still, to verify the intuition of this test, we also looked at employment status, and found that those employed full time were significantly more likely to convert to VBM than those who reported being unemployed.
Probit is a statistical technique used to analyze relationships when the dependent variable of interest (here it is whether or not the voter converted to VBM) has only two possible outcomes (here it is yes or no). Employing probit analysis with robust standard errors is a way to estimate a statistical model that is less affected by departures from standard model assumptions.
This interaction term looks at the “interaction” or simultaneous effect of receiving a postcard and being a frequent voter (i.e., high propensity) on the decision to register for VBM. Thus, if we find that this variable is statistically significant and a non-negative number, we have evidence for our hypothesis that high propensity voters (i.e., those who voted frequently in the past) and those who receive the postcard are more likely to become VBM voters.
Appendix 1: Items from Survey Instrument Included in the Statistical Analysis
| SHELLO | Hello, my name is ______________and I'm calling from the Social Science Research Center at Cal State University, Fullerton. |
| Have I reached [READ RESPONDENT'S PHONE NUMBER]? | |
| 1. CONTINUE | |
| 2. DISPOSITION SCREEN | |
| SHEAD | I am calling on behalf of the San Joaquin County Registrar of Voters and the Jacoby Center at the University of the Pacific. This is a scientific study of public opinion regarding the voting process. |
| May I please speak with [NAME OF REGISTERED VOTER]? | |
| 1. YES [SKIP TO INTRO] | |
| 2. NO | |
| SHEAD2 | Is [NAME OF REGISTERED VOTER] at home? |
| 1. YES [SKIP TO INTRO] | |
| 2. NO [SCHEDULE CALLBACK] | |
| CALLBAK1 | Can you please tell me when to call back to reach [NAME OF REGISTERED VOTER]? |
| INTRO | I wonder if we might ask you some survey questions for this study that I think you might find interesting. This survey takes about 12 minutes to complete. Your responses will remain completely confidential, and of course, you are free to decline to answer any survey question. |
| We believe that this survey is needed to accurately describe the views of voters in San Joaquin County. Your opinions count, and your participation would be very useful. I should also mention that this call may be monitored by my supervisor for quality control purposes only. | |
| Is it all right to ask you these questions now? | |
| 1. YES [SKIPTO TRANS1] | |
| 2. NO [CONTINUE] | |
| APPT | Can you suggest a more convenient time to ask you the survey questions? |
| [SCHEDULE CALLBACK] | |
| TRANS1 | I'd like to begin by asking you a few general questions about some voting information that you may have seen or heard recently. When I mention a “sample ballot,” I'm referring to an official booklet sent to you by the San Joaquin County Registrar of Voters a few weeks before the election. This booklet contains information about the upcoming election and candidates for office. |
| Q1 | Do you recall seeing or hearing any information in the last three months about voting by mail? |
| 1. YES [CONTINUE] | |
| 2. NO [SKIP TO Q2] | |
| 7. DON'T KNOW/ NO RESPONSE [SKIP TO Q2] | |
| 9. REFUSED [SKIP TO Q2] | |
| Q1a | Did you see or hear this information… |
| [RANDOMIZE ORDER OF PRESENTATION. CHECK ALL THAT APPLY] | |
| a. On TV? | |
| b. On the radio? | |
| c. In the newspaper? | |
| d. In a postcard you received in the mail? This is an official postcard sent by the registrar to you by name. | |
| e. In a sample ballot you received in the mail? | |
| 0. NOT SELECTED | |
| 1. SELECTED | |
| 7. DON'T KNOW/NO RESPONSE | |
| 9. REFUSED | |
| Q2 | Do you recall seeing or hearing any information in the last three months about how to correctly mark the ballot? |
| 1. YES [CONTINUE] | |
| 2. NO [SKIP TO Q4] | |
| 7. DON'T KNOW/ NO RESPONSE [SKIP TO Q4] | |
| 9. REFUSED [SKIP TO Q4] | |
| Q2a | Did you see or hear this information… |
| [RANDOMIZE ORDER OF PRESENTATION. CHECK ALL THAT APPLY] | |
| a. On TV? | |
| b. On the radio? | |
| c. In the newspaper? | |
| d. In a postcard you received in the mail? | |
| e. In a sample ballot you received in the mail? | |
| 0. NOT SELECTED | |
| 1. SELECTED | |
| 7. DON'T KNOW/NO RESPONSE | |
| 9. REFUSED | |
| Q3 | What do you recall about that message/ those messages? |
| 1. SPECIFY> | |
| 7. DON'T KNOW/ NO RESPONSE | |
| 9. REFUSED | |
| Q3a. | Have you had a chance to review your sample ballot—again, that's the official booklet sent to you by the Registrar of Voters that contains information about the upcoming election and candidates for office? |
| 1. YES [CONTINUE] | |
| 2. NO [SKIP TO Q4] | |
| 7. DON'T KNOW/ NO RESPONSE [SKIP TO Q4] | |
| 9. REFUSED [SKIP TO Q4] | |
| Q3b. | How easy was it to read and understand this booklet? Would you say that it was… |
| 1. Very difficult | |
| 2. Somewhat difficult | |
| 3. Fairly easy, or | |
| 4. Very easy to read and understand the sample ballot booklet? | |
| 7. DON'T KNOW/ NO RESPONSE | |
| 9. REFUSED | |
| Q4 | Did you vote in the last election, in February? |
| 1. YES [CONTINUE] | |
| 2. NO [SKIP TO Q12] | |
| 7. DON'T KNOW/ NO RESPONSE [SKIP TO Q12] | |
| 9. REFUSED [SKIP TO Q12] | |
| Q5 | Did you vote… |
| 1. In person at a polling place, or [SKIP TO Q7] | |
| 2. by mail? [CONTINUE] | |
| 7. DON'T KNOW/ NO RESPONSE | |
| 9. REFUSED | |
| Q6 | Did you vote using… |
| 1. An absentee ballot, or [SKIP TO Q12] | |
| 2. Permanent Vote by Mail? [SKIP TO Q12] | |
| 7. DON'T KNOW/ NO RESPONSE | |
| 9. REFUSED | |
| Q7 | Do you recall seeing any information in the polling place about how to mark a ballot correctly? |
| 1. YES | |
| 2. NO | |
| 7. DON'T KNOW/ NO RESPONSE | |
| 9. REFUSED | |
| Q8 | Aside from signing you in, did the poll workers provide any special assistance? |
| 1. YES, SPECIFY> | |
| 2. NO | |
| 7. DON'T KNOW/ NO RESPONSE | |
| 9. REFUSED | |
| Q9 | Based upon your experience at that time, how knowledgeable about election procedures where the poll workers you interacted with… |
| 1. Not knowledgeable at all, | |
| 2. Slightly knowledgeable | |
| 3. Moderately knowledgeable, or | |
| 4. Very knowledgeable? | |
| 7. DON'T KNOW/ NO RESPONSE | |
| 9. REFUSED | |
| Q10 | Again, based upon your experience at that time, would you say the poll workers you had contact with were… |
| 1. Very unprofessional | |
| 2. Somewhat unprofessional | |
| 3. Somewhat professional, or | |
| 4 Very professional? | |
| 7. DON'T KNOW/ NO RESPONSE | |
| 9. REFUSED | |
| Q11 | Did you have any particular problems with, or concerns about any of the poll workers at that time? |
| 1. YES, SPECIFY> | |
| 2. NO | |
| 7. DON'T KNOW/ NO RESPONSE | |
| 9. REFUSED | |
| Q12 | To the best of your knowledge, in upcoming elections is San Joaquin County primarily going to use… |
| 1. Paper ballots, or | |
| 2. Electronic voting machines? | |
| 7. DON'T KNOW/ NO RESPONSE | |
| 9. REFUSED | |
| Q13 | What's the best way to ensure that your vote is marked correctly? Would you say… |
| 1. Fill in the bubble next to your choice on the ballot? | |
| 2. Put a check in the bubble? | |
| 3. Put an “X” in the bubble, or that | |
| 4. Any of these will work? | |
| 7. DON'T KNOW/ NO RESPONSE | |
| 9. REFUSED | |
| Q16 | Imagine that you are voting for the president of the United States and there are three candidates. The instructions tell you to mark one preference, but you accidentally vote for two candidates and submit your ballot. What happens to your vote? Would you say… |
| 1. One vote would be recorded for each candidate I voted for, | |
| 2. My vote would be randomly assigned to one of the two candidates I voted for, or | |
| 3. My vote would not get counted at all? | |
| 7. DON'T KNOW/ NO RESPONSE | |
| 9. REFUSED | |
| Q17 | Please tell me whether the following statement is true or false: Only individuals who know that they will be out-of-town on election day can vote in advance using an absentee ballot. |
| 1. TRUE | |
| 2. FALSE | |
| 7. DON'T KNOW/ NO RESPONSE | |
| 9. REFUSED | |
| Q18 | Some people derive satisfaction from the process of casting their vote in person at a polling place, and others are equally satisfied voting by mail. In which category do you place yourself? Would you say that you… |
| 1. Like to cast your vote in person at a polling place, or that | |
| 2. You would be equally satisfied voting by mail? | |
| 7. DON'T KNOW/ NO RESPONSE | |
| 9. REFUSED | |
| Q19 | Some people find a variety of things about casting their vote in person at a polling place to be difficult or inconvenient. Is there anything about voting in person at a polling place that is difficult or inconvenient for you? |
| [RECORD UP TO THREE RESPONSES] | |
| a. YES, SPECIFY> | |
| b. YES, SPECIFY> | |
| c. YES, SPECIFY> | |
| 1. LACK OF TRANSPORTATION | |
| 2. CHILD CARE ISSUES | |
| 3. WORKING TOO MANY HOURS ON ELECTION DAY | |
| 4. DON'T KNOW HOW TO VOTE | |
| 5. DON'T KNOW ANYTHING ABOUT POLITICS | |
| 6. OTHER, SPECIFY> | |
| 7. NO, NOTHING ABOUT VOTING IN PERSON AT A POLLING PLACE IS DIFFICULT OR INCONVENIENT. | |
| 77. DON'T KNOW/ NO RESPONSE | |
| 99. REFUSED | |
| Q20 | The way you see it, are there any specific advantages to voting by mail? |
| [RECORD UP TO THREE RESPONSES] | |
| a. YES, SPECIFY> | |
| b. YES, SPECIFY> | |
| c. YES, SPECIFY> | |
| 1. GENERAL CONVENIENCE | |
| 2. CAN VOTE WHEN I WANT TO | |
| 3. HAVE AS MUCH TIME AS I NEED TO READ/THINK IT THROUGH/TALK TO OTHERS | |
| 4. DON'T HAVE TO WORRY ABOUT CHILD CARE | |
| 5. DONT HAVE TO TAKE TIME OFF FROM WORK | |
| 6. OTHER, SPECIFY> | |
| 7. NO, THERE ARE NO SPECIFIC ADVANTAGES | |
| 77. DON'T KNOW/ NO RESPONSE | |
| 99. REFUSED | |
| Q21 | Are there any particular problems with, or disadvantages to voting by mail? |
| [RECORD UP TO THREE RESPONSES] | |
| a. YES, SPECIFY> | |
| b. YES, SPECIFY> | |
| c. YES, SPECIFY> | |
| 1. CONCERNS ABOUT CONFIDENTIALITY AND PRIVACY | |
| 2. LIKE THE FEELING/ GET SOMETHING OUT OF VOTING IN PERSON | |
| 3. TOO EASY TO LOSE OR ACCIDENTALLY DESTROY THE MAIL BALLOT | |
| 4. TOO EASY TO FORGET DEADLINE FOR VOTING BY MAIL | |
| 5. HAVE TO VOTE BEFORE THE CAMPAIGN IS OVER | |
| 6. OTHER, SPECIFY> | |
| 7. NO, THERE ARE NO SPECIFIC PRBLEMS OR DISADVANTAGES | |
| 77. DON'T KNOW/ NO RESPONSE | |
| 99. REFUSED | |
| Q22 | If you wanted to become a permanent Vote By Mail voter, how would you do it? |
| 1. SIGN UP ON-LINE (USING THE INTERNET) | |
| 2. PERSONALLY GO TO THE COUNTY REGISTRAR OF VOTER'S OFFICE IN STOCKTON | |
| 3. RETURN THE TEAR-OFF PORTION THAT COMES ON A SAMPLE BALLOT | |
| 4. RETURN A SEPARATELY MAILED POST-CARD | |
| 5. OTHER, SPECIFY> | |
| 7. DON'T KNOW/ NO RESPONSE | |
| 9. REFUSED | |
| Q23 | How likely are you to vote in the election this June? Do you think you… |
| 1. Won't vote, | |
| 2. Probably won't vote, are | |
| 3. Very likely to vote, or would you say you are | |
| 4. Certain to vote? | |
| 7. DON'T KNOW/NO RESPONSE | |
| 9. REFUSED | |
| TRANS2 | Now, I have just a few quick questions about your neighborhood. |
| Q24a. | How likely are your neighbors to take action if children were spray-painting graffiti on a local building? |
| Q24b. | How likely are your neighbors to take action if a fight broke out in front of your house? |
| Q24c. | How likely are your neighbors to take action if the closest fire station was threatened with budget cuts? |
| Q24d. | How likely are you to work together with your neighbors to achieve a specific goal? |
| 1. Very unlikely | |
| 2. Somewhat unlikely | |
| 3. Neither likely nor unlikely | |
| 4. Somewhat likely, or | |
| 5. Very likely? | |
| 7. DON'T KNOW/NO RESPONSE | |
| 9. REFUSED | |
| TRANS3 | Please tell me how much you agree or disagree with each of the following statements… |
| Q25a. | People around here are willing to help their neighbors |
| Q25b. | People in this neighborhood can be trusted |
| Q25c. | People in this neighborhood generally don't get along with each other |
| 1. Strongly disagree | |
| 2. Somewhat disagree | |
| 3. Neither agree nor disagree | |
| 4. Somewhat agree, or | |
| 5. Strongly agree? | |
| 7. DON'T KNOW/NO RESPONSE | |
| 9. REFUSED | |
| Q26. | How satisfied or dissatisfied are you with the performance of local government in solving problems in your neighborhood? Would you say… |
| 1. Very dissatisfied | |
| 2. Somewhat dissatisfied | |
| 3. Neither satisfied nor dissatisfied | |
| 4. Somewhat satisfied, or | |
| 5. Very satisfied? | |
| 7. DON'T KNOW/NO RESPONSE | |
| 9. REFUSED | |
| TRANS4 | Various federal, state, and local programs have been proposed to address the wave of foreclosures resulting from sub-prime mortgages. |
| Q27 | Do you strongly oppose, somewhat oppose, somewhat support or strongly support using taxpayer money for… |
| a. Programs designed to help homeowners (by restructuring or refinancing sub-prime mortgages or by providing direct, emergency loans to homeowners in trouble). | |
| b. Programs designed to assist financial and banking institutions in trouble | |
| 1. STRONGLY OPPOSE | |
| 2. SOMEWHAT OPPOSE | |
| 3. SOMEWHAT SUPPORT | |
| 4. STRONGLY SUPPORT | |
| 7. DON'T KNOW/NO RESPONSE | |
| 9. REFUSED | |
| TRANS4 | These last questions are for classification purposes only. Please remember that your responses will remain entirely confidential. |
| Q28 | What is the usual mode of transportation that you use to get around? Do you… |
| 1. Walk or ride a bike? | |
| 2. Take a bus | |
| 3. Take a taxi | |
| 4. Drive yourself, or | |
| 5. Get a ride from a friend or relative? | |
| 6. OTHER, SPECIFY> | |
| 7. DON'T KNOW/ NO RESPONSE | |
| 9. REFUSED | |
| Q29 | Do you presently have cable (not satellite) television in your household? |
| 1. YES [CONTINUE] | |
| 2. NO [SKIP TO Q31] | |
| 7. DON'T KNOW/ NO RESPONSE | |
| 9. REFUSED | |
| Q30 | Is your cable service provided by ComCast? |
| 1. YES | |
| 2. NO, SPECIFY> | |
| 7. DON'T KNOW/ NO RESPONSE | |
| 9. REFUSED | |
| Q31 | Please tell me which of the following is your Primary and which is your Secondary source for news and information about public policy issues? Would you say… |
| 1. Newspapers (SPECIFY) | |
| 2. Television (SPECIFY) | |
| 3. Talking to people | |
| 4. Radio (SPECIFY) | |
| 5. Magazines and newsletters, or (SPECIFY) | |
| 6. the Internet? (SPECIFY) | |
| 0. NOT SELECTED | |
| 1. PRIMARY SOURCE | |
| 2. SECONDARY SOURCE | |
| 7. DON'T KNOW/ NO RESPONSE | |
| 9. REFUSED | |
| [ASK Q32a FOR PRIMARY (=1) AND Q32b FOR SECONDARY (=2) SOURCES IDENTIFIED IN Q31] | |
| Q32a | How often do you READ/WATCH/LISTEN/ACCESS [INSERT PRIMARY SOURCE FROM Q30]? |
| 1. Multiple times per day | |
| 2. Every day | |
| 3. A few times per week | |
| 4. About once a week | |
| 5. One to three times a month | |
| 6. Monthly, or | |
| 7. Less than monthly? | |
| 77. DON'T KNOW/ NO RESPONSE | |
| 99. REFUSED | |
| Q32b | How often do you READ/WATCH/LISTEN/ACCESS [INSERT SECONDARY SOURCE FROM Q30]? |
| 1. Multiple times per day | |
| 2. Every day | |
| 3. A few times per week | |
| 4. About once a week | |
| 5. One to three times a month | |
| 6. Monthly, or | |
| 7. Less than monthly? | |
| 77. DON'T KNOW/ NO RESPONSE | |
| 99. REFUSED | |
| Q33 | Are you registered to vote as a Democrat, Republican, another political party, or are you registered with no party affiliation? |
| 1. DEMOCRAT | |
| 2. REPUBLICAN | |
| 3. OTHER (SPECIFY>) | |
| 4. NO PARTY AFFILIATION | |
| 7. DON'T KNOW/ NO RESPONSE | |
| 9. REFUSED | |
| Q34 | Politically, do you consider yourself to be… |
| 1. Very liberal | |
| 2. Somewhat liberal | |
| 3. Middle-of-the-road | |
| 4. Somewhat conservative, or | |
| 5. Very conservative? | |
| 7. DON'T KNOW/ NO RESPONSE | |
| 9. REFUSED | |
| Q35 | Which of the following best describes your present situation? Are you… |
| [CHECK ALL THAT APPLY] | |
| 1. Retired | |
| 2. A student | |
| 3. A homemaker [NOT EMPLOYED OUTSIDE THE HOME] | |
| 4. Disabled, | |
| 5. Currently employed full time, | |
| 6. Currently employed part time, | |
| 7. Self-employed, or | |
| 8. Currently unemployed, laid off, or looking for work? | |
| 77. DON'T KNOW | |
| 99. REFUSED | |
| Q36 | What was the last grade in school that you completed? |
| 1. Less than high school diploma/GED | |
| 2. High school diploma/GED | |
| 3. Some college, no degree | |
| 4. Associate degree | |
| 5. Bachelor's degree | |
| 6. A graduate or professional degree (i.e. Teaching Credential, Masters, Ph.D.) | |
| 7. DON'T KNOW/ NO RESPONSE | |
| 9. REFUSED | |
| Q37 | What is your marital status? [READ ONLY IF NECESSARY] |
| 1. MARRIED | |
| 2. SINGLE, NEVER MARRIED | |
| 3. DIVORCED | |
| 4. WIDOWED | |
| 5. SEPARATED | |
| 6. COHABITATING WITH A PARTNER/ DOMESTIC PARTNERSHIP | |
| 7. OTHER | |
| 8. DON'T KNOW / NO RESPONSE | |
| 9. REFUSED | |
| [IF INTERVIEW IS IN SPANISH, SKIP TO Q39. IF INTERVIEW IS IN ENGLISH, CONTINUE] | |
| Q38 | Do you speak a language other than English at home? |
| 1. YES, SPECIFY> [CONTINUE] | |
| 2. NO [SKIP TO Q36] | |
| 7. DON'T KNOW/ NO RESPONSE | |
| 9. REFUSED | |
| Q39 | How do you rate your own ability to speak English? |
| 1. Poor | |
| 2. Fair | |
| 3. Good | |
| 4. Excellent | |
| 7. DON'T KNOW/ NO RESPONSE | |
| 9. REFUSED | |
| Q40 | Do you own or rent your home? |
| 1. OWN | |
| 2. RENT | |
| 7. DON'T KNOW/ NO RESPONSE | |
| 9. REFUSED | |
| Q41 | In what year were you born? |
| 19__ | |
| 777. DON'T KNOW/ NO RESPONSE | |
| 999. REFUSED | |
| Q42 | How many years have you lived in San Joaquin County? |
| ENTER NUMBER OF YEARS> | |
| 777. DON'T KNOW/ NO RESPONSE | |
| 999. REFUSED | |
| Q43 | How do you describe your race or ethnicity? |
| 1. Asian (SPECIFY>) | |
| 2. Black or African American | |
| 3. Latino or Hispanic | |
| 4. Caucasian or White | |
| 5 Other (SPECIFY>) | |
| 7. DON'T KNOW/NO RESPONSE | |
| 9. REFUSED | |
| Q44 | How many children younger than 18 years of age currently reside in your household? |
| 1. NUMBER> | |
| 7. DON'T KNOW/NO RESPONSE | |
| 9. REFUSED | |
| Q45 | Not including weddings and funerals, how often do you attend religious or spiritual services? Would you say.. |
| 1. Every week (or more often) | |
| 2. Almost every week | |
| 3. Once or twice a month | |
| 4. A few times per year, or | |
| 5. Less often than that? | |
| 7. DON'T KNOW/ NO RESPONSE | |
| 9. REFUSED | |
| Q46 | Which of the following categories best describes your total household or family income before taxes, from all sources? |
| 1. Under $20,000 | |
| 2. $20,000 TO $29,999 | |
| 3. $30,000 TO $39,999 | |
| 4. $40,000 TO $49,999 | |
| 5. $50,000 TO $59,999 | |
| 6. $60,000 TO $69,999 | |
| 7. $70,000 TO $79,999 | |
| 8. $80,000 TO $89,999 | |
| 9. $90,000 TO $99,999 | |
| 10. $100,000 TO $124,999 | |
| 11. $125,000 TO $149,999 | |
| 12. $150,000 TO $174,999 | |
| 13. Over $175,000 | |
| 77. DON'T KNOW/ NO RESPONSE | |
| 99. REFUSED | |
| ADDRESS | Lastly, the San Joaquin County Registrar of Voters lists your address as [READ ADDRESS]. Is this accurate? Your address information will not be included with your survey responses, just a “yes” or “no” to indicate whether it is accurately recorded. |
| 1. YES | |
| 2. NO | |
| 7. DON'T KNOW/ NO RESPONSE | |
| 9. REFUSED | |
| CONCLUDE | Thank you. That concludes the San Joaquin County “Vote Smart” Survey. Your participation is deeply appreciated. |
| [INTERVIEWER: CODE GENDER, LANGUAGE OF INTERVIEW, AND LEVEL OF COOPERATION] | |