
Abstract
Purpose:
To assess nationwide the pathologic characteristics and trends in type of surgery and pathologic reporting in surgically managed renal tumors ≤4 cm.
Materials and Methods:
A review of all pathologic reports of primary small renal masses operated on in the Netherlands during the period 1995 to 2005 was performed. The data source was a nationwide central archive of histocytopathology (Patologisch Anatomisch Landelijk Geautomatiseerde Archief ). Tumors were stratified into three groups: ≤2, 2.1 to 3.0, and 3.1 to 4.0 cm. Age, sex, type of operation, and tumor pathology were analyzed. For renal-cell carcinomas, grade (3-tiers Fuhrman) and stage (2002 Tumor, Node, Metastasis) were assessed. Trends in type of surgery (radical or partial nephrectomy [PN]) and pathologic reporting during the study period were analyzed.
Results:
Of all operated primary kidney tumors, 25.3% were ≤4.0 cm. The mean age of the patients was 63.1 years (standard deviation 11.7), and the male/female ratio was 3:2. Only 7.5% were benign tumors, and 9.8% were locally advanced (≥T3). Tumors ≤3.0 cm were more likely to be benign (P = 0.006) and of lower stage (P = < 0.001) than tumors of 3.1 to 4 cm. PN was performed in 16.5% of the cases. Grade and subtype were reported in 55% of the cases. The rate of PNs performed increased during the decade. There was a trend in increased reporting of grade and subtype.
Conclusions:
A quarter of all the operated primary kidney tumors were ≤4 cm. Smaller tumors were more likely to be benign and of lower stage. A cutoff size regarding biologic aggressiveness can be settled at the 3 cm size. The PN rate increased along the decade. Grade and subtype reporting rates remained suboptimal, although a positive trend was noted.
Introduction
Partial nephrectomy (PN), initially reserved for mandatory situations, is safe and an effective alternative to radical nephrectomy for tumors in this size range. 6,7 Although the technique has gained acceptance in the last decade, it is still underused. 8
The excellent long-term oncologic outcomes of PN are most likely because of the favorable histopathologic characteristics of the treated tumors. Nevertheless, several recent institutional studies have shown that some small kidney tumors display aggressive behavior, 9,10 which would support an active interventional policy. Extension outside the capsule was reported in 38% of renal tumors ≤3.0 cm in a small series of 50 cases, with 28% of the cases displaying a high nuclear grade (Fuhrman grade 3 or 4). 9 Most data that point to aggressive behavior are extracted from institutional series and consequently susceptible to selection bias. To minimize these biases, a study that is conducted by means of a nationwide registry would be preferable.
Our objectives were to assess the pathologic characteristics of the primary kidney tumors ≤4 cm that were surgically managed in the Netherlands during the past decade, the type of surgery performed, and the quality of the pathologic report.
Materials and Methods
Abstracts of the pathology report (excerpts) from all patients who underwent surgery for a primary renal tumor during the period 1995 to 2005 in the Netherlands were prospectively collected by a central nationwide histocytopathology network and archive in the Netherlands named Pathologisch Anatomisch Landelijk Geautomatiseerd Archief (PALGA). 11 Until 2000, the first 300 characters of the definitive conclusion of the pathology report were stated in the excerpts. From that year onward, excerpts extended to the first 1000 characters of the conclusion. Excerpts were retrieved from the central archive using the procedural terminology derived from the Systematized Nomenclature of Medicine published by the College of American Pathologists. 12 Tumor biopsies, primary urothelial-cell carcinomas, and metastases from other primary cancers were excluded.
All excerpts were reviewed by one of the authors (I.P.E.D.K). For our purposes, only SRMs of a diameter ≤4.0 cm were analyzed.
Tumors were stratified by size into three groups (group A: ≤2 cm; group B: 2.1–3.0 cm; group C: 3.1–4.0 cm). The following variables—age, sex, type of operation (radical or PN), type of tumor (benign or malignant), stage (2002 Tumor, Node, Metastasis classification system), 13 grade, and subtype—were compared among size groups.
Age and sex were mandatory in all excerpts. Surgical management was regarded as radical nephrectomy unless a PN was explicitly stated in the excerpt. The Fuhrman grade was converted into a three-scheme grading system for simplification of the analysis, merging grade 1 with grade 2. 14
Statistical method
Differences between normally distributed variables were compared by the unpaired (two sample) t test or one-way analysis of variance. Categorical variables were compared by the chi-square test. A P < 0.05 was considered as statistically significant.
The cause of missing data was explored by comparing cases with and without missing data on age, sex, and size. In the absence of significant differences (P < 0.05), it was assumed that missing data were completely at random and consequently could be excluded from analysis.
For trend analysis, the number of PNs was divided by the total number of surgeries per year and compared by the chi-square test (linear-by-linear association). Trends in subtype and grade report for malignant tumor were calculated by dividing the number of reports with those data by the total number of malignant tumor reports.
The data were analyzed using SPSS 15.0 (Chicago, IL).
Results
During the study period, 2421 SRMs were operated on in the Netherlands. This figure accounted for 25.3% of all operated primitive kidney tumors through 1995 to 2005 and with size available in the pathologic report. 15 The mean diameter of the SRMs was 3.1 cm (standard deviation [SD] 0.8). Groups A, B, and C consisted of 329 (13.6%), 889 (36.7%), and 1203 (49.7%) tumors, respectively.
Table 1 shows patient demographics, type of surgery performed, tumor biology, and malignant tumor stage. There was a significant difference in age and type of surgery among the three groups, while the sex ratio was equal for the three groups (male:female, 3:2).
Stage applies only for malignant tumors.
Differences group A vs group B vs group C.
Differences only between groups A or B vs C.
Biology and stage could not be determined in 0.3% of the SRM and in 0.8% of malignant tumors, respectively (Table 1). Among the benign tumors, 142 (5.9%) were oncocytomas, 18 (0.7%) angiomyolipomas, and 22 adenomas (0.9%). The percentage of benign tumors decreased with increasing diameter, but there was only statistically significant difference between groups B and C (P = 0.006) (Table 2). There were no differences in the mean tumor size of benign or malignant lesions (2.9 cm (SD 0.8) vs 3.1 cm (SD 0.8), P = 0.268).
Comparison in grades among groups (group A vs group B vs group C) was not statistically different (P = 0.354).
RCC = renal-cell carcinoma.
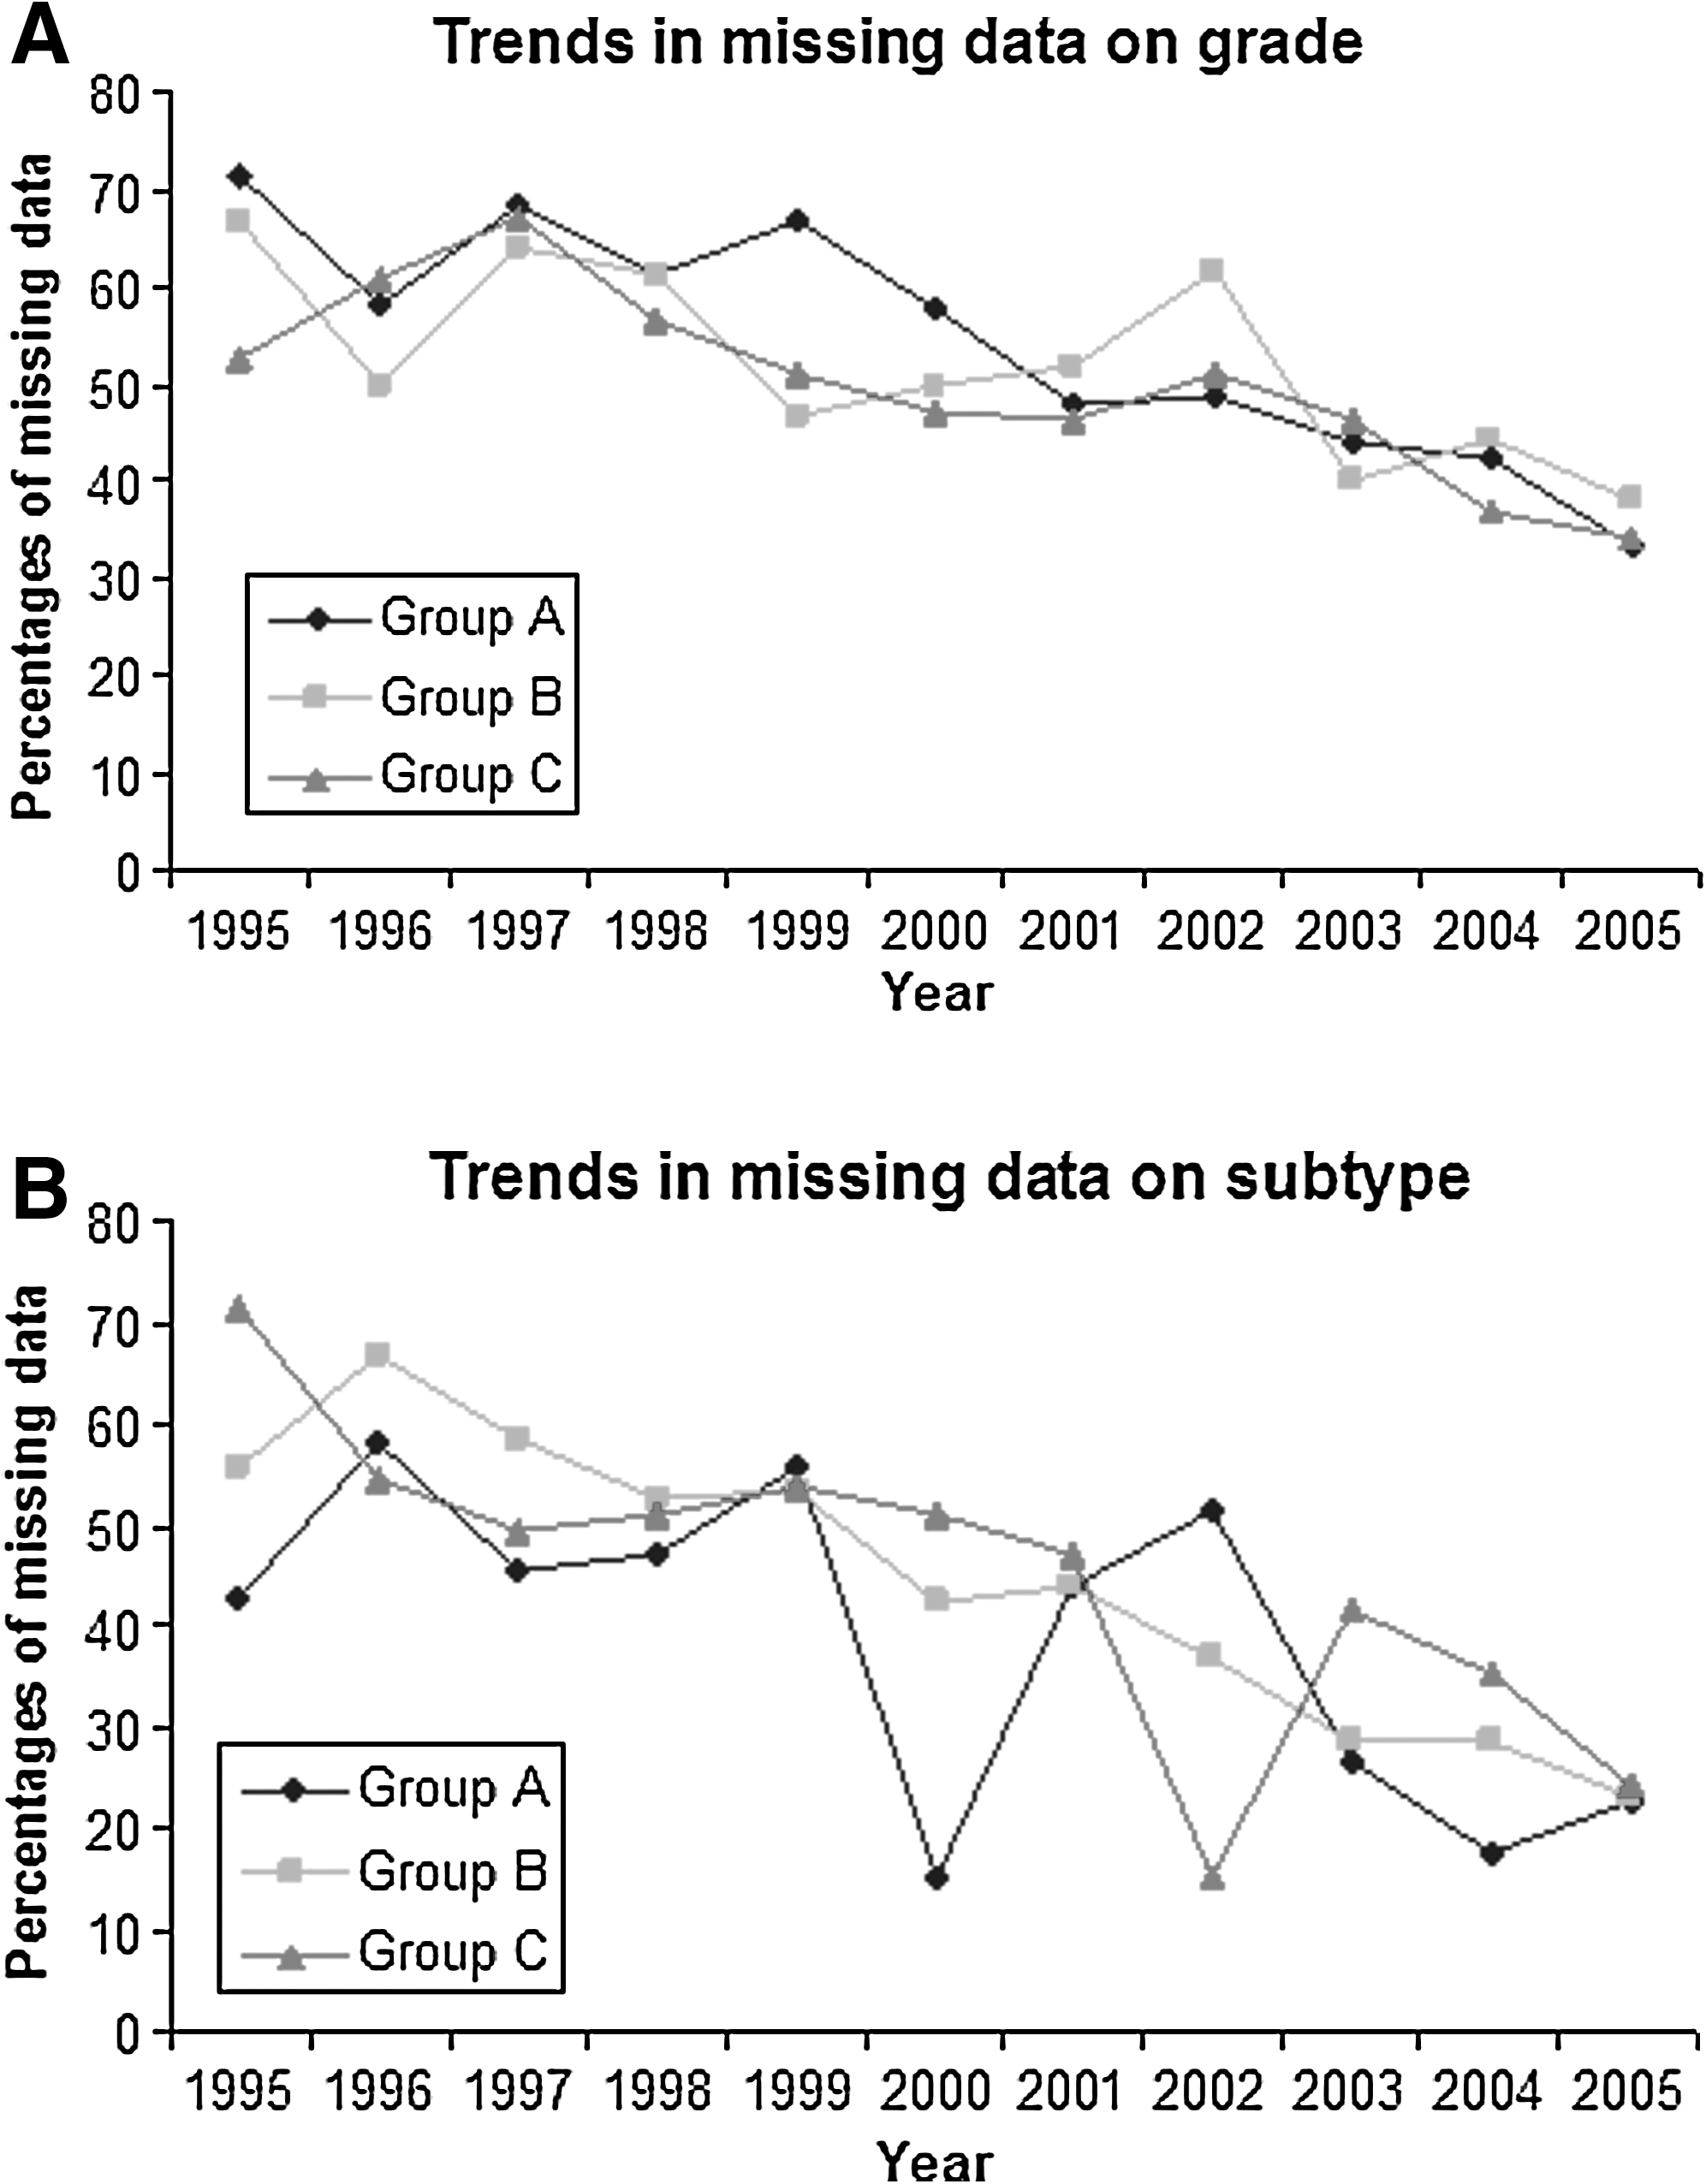
Subtype was available in a subcohort of 1214 malignant (54.3%) cases. Malignant tumors were defined only as “malignant kidney tumor” or “renal adenocarcinoma” in 1018 (45.7%) cases (Table 2). Grade was available in a subcohort of 1228 malignant (55%) cases and not mentioned in 1011 (45%) cases (Table 2). These two variables were explored for missing data. Missing data in grade was not associated with age (P = 0.33) or tumor size (P = 0.84). Grade was slightly more often missed in females (48.2%) than in males (42.8%) (P = 0.012). Missing data in the subtype was associated with age (P = 0.034) and size (P = 0.001). Subtype data were more frequently available in younger patients (62.4 vs 63.5 years) and in smaller tumors (3.0 vs 3.2). There was no statistically significant difference in subtype missing data between sexes (48% in females vs 44% in males, P = 0.084). Figure 1 shows the evolution in the missing data on grade and subtype during the decade.
(
Multifocality was described in 5.6% (135) of cases. Multifocality was present in 10.6% (n = 35), 4.5% (n = 40) and 5% (n = 60) of the cases of groups A, B, and C, respectively, and in 9.5% of the papillary tumors, 4.3% of the clear-cell renal-cell carcinomas (RCCs) and 8% of the chromophobe RCCs.
There was a statistically significant difference in the rate of PNs that were performed by groups. The rate decreased with increasing tumor diameter (Table 1). Overall, during the last decade, there was a statistically significant increase in the number of PNs (P = 0.005). Percentages of PN per size group increased from 14.3% (n = 1), 13.3% (n = 6), and 3.8% (n = 3) in 1995 for groups A, B, and C, respectively, to 35.4% (n = 17), 30.6% (n = 37), and 17% (n = 26) in 2005 for groups A, B, and C, respectively (Fig. 2). The number of PNs stratified by groups was too small for a sound statistical analysis, but there was an increasing trend for the three groups more evident from 2001 to 2002 onward.
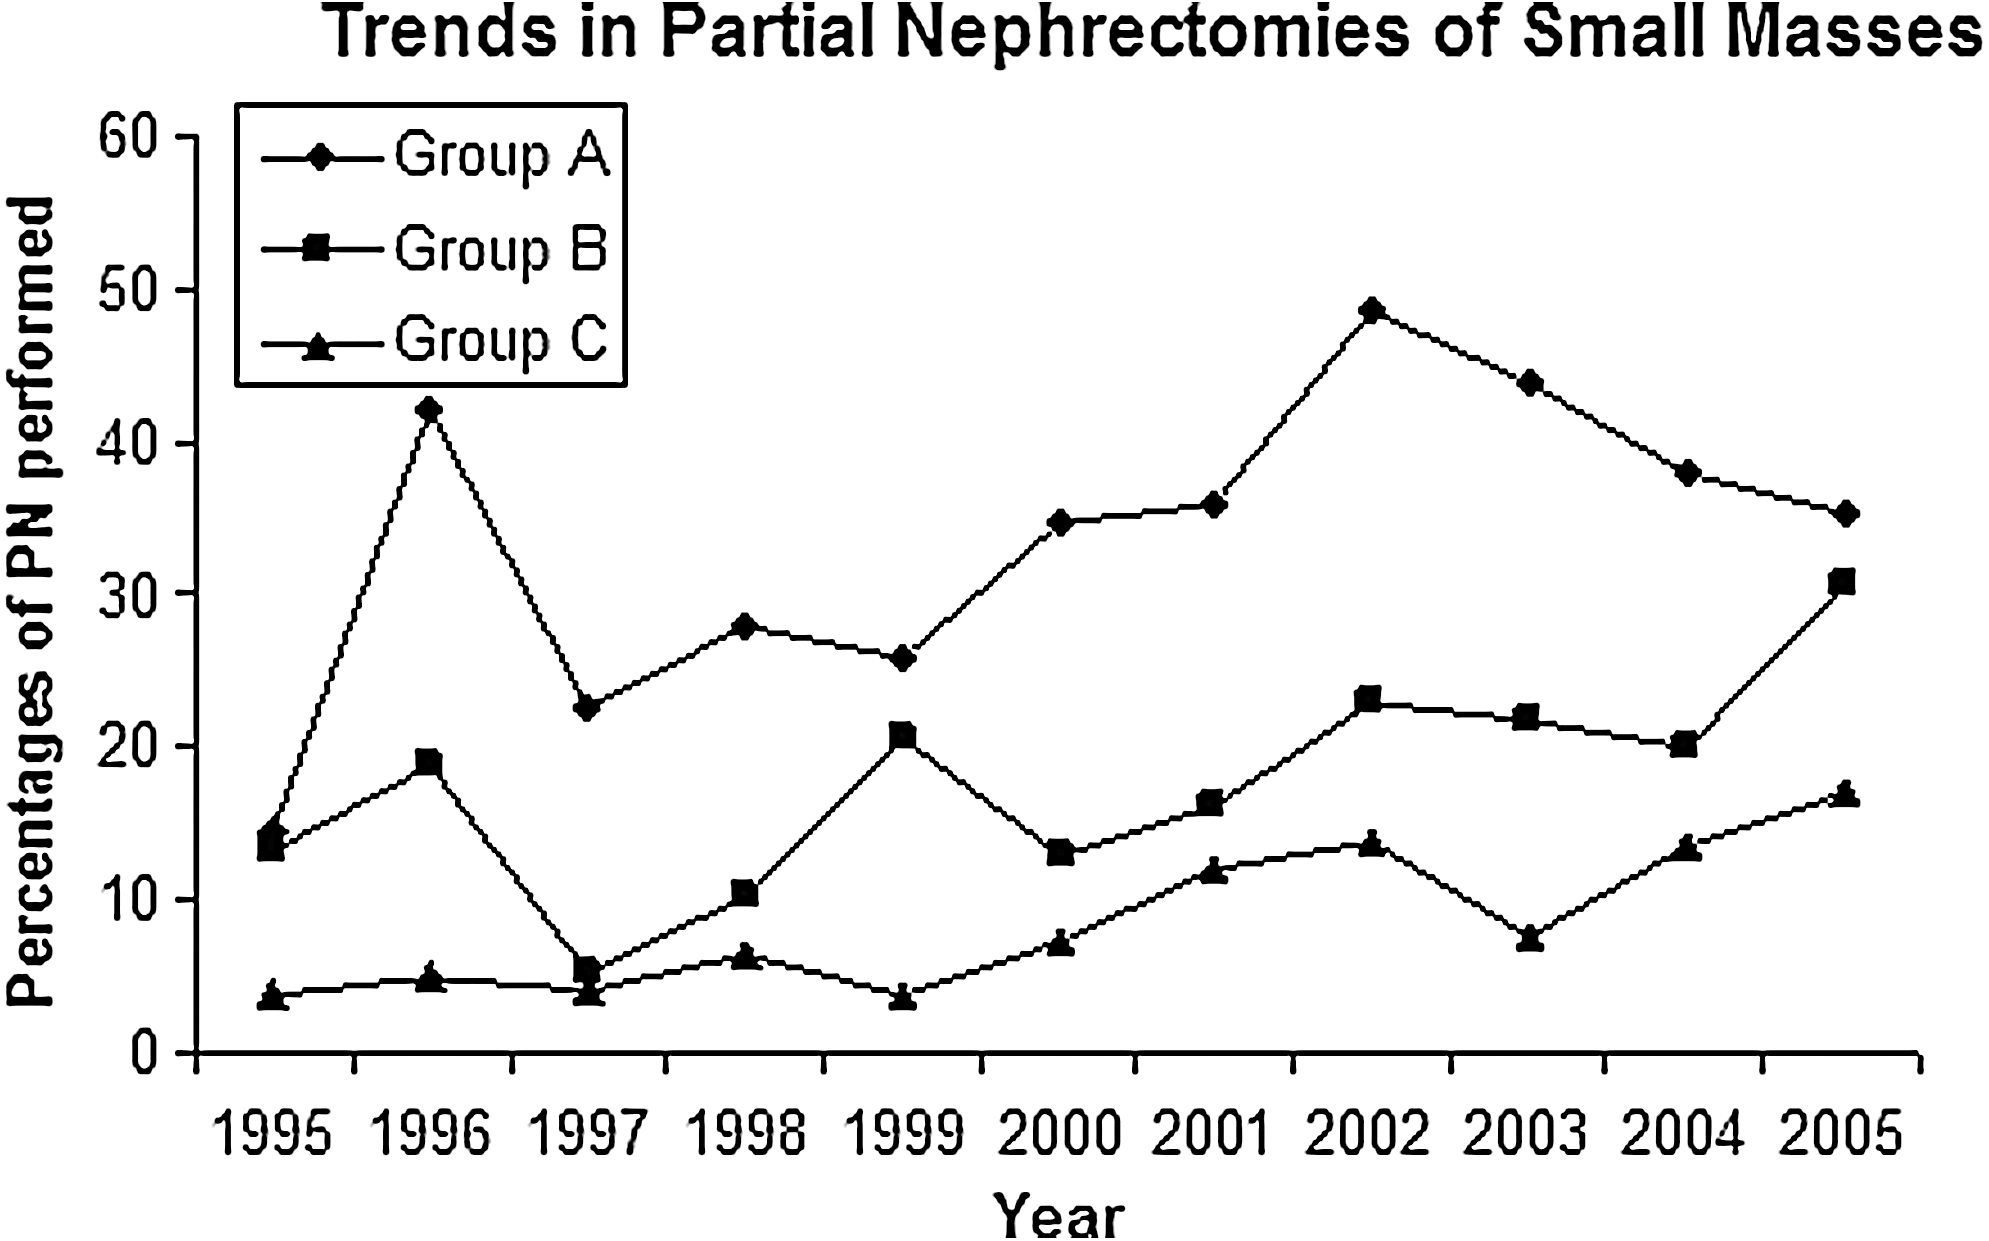
Trends in partial nephrectomies in small (≤4.0 cm) renal masses in the Netherlands in the period 1995 to 2005. Group A, ≤2.0 cm, group B, 2.1 to 3.0 cm, and group C, 3.1 to 4.0 cm. PN = partial nephrectomy.
Positive surgical margins were reported in 67 (16.8%) of 400 PNs and 35 (1.7%) of the 2021 radical nephrectomies. For those patients who were treated by PN, the rate of positive margins was 13.7% (n = 16), 14.8% (n = 24), and 23.7% (n = 27) for groups A, B, and C, respectively.
Discussion
In the Netherlands, the existence of a central archive for histo- and cytopathology (PALGA) offers the possibility of assessing at a national level demographics and tumor characteristics of surgically managed tumors. The figures and trends reported represent multi-institutional data, including all the hospitals of a Western country.
The present study confirms the already reported positive correlation between age and size for renal masses up to 4 cm, 16,17 most likely explained by earlier detection and widespread use of abdominal imaging. 18,19 A novel finding is the lower incidence of benign tumors in our national series when compared with other institutional European series. 10,20 A Japanese group recently described similar figures that could be explained by racial differences. 21 Two reasons may explain the difference: A more conservative national policy for those small tumors and the methodology selection used that excluded cystic masses unless there was the presence of a pathologic diagnosis of RCC. In fact, institutional data may be biased because of specific referral for surgical treatment. Different interpretation of the biology of the masses by the different pathologists involved is less likely, because the time frame in our series includes the years when the Heidelberg classification was introduced. 22
As for other reports, the incidence of benign lesions decreased as tumor size increased. This decrease, however, was only significant for tumors larger than 3 cm (P = 0.006). Only a moderate percentage (9.8%) of the small renal carcinomas were stage T3, confirming other authors' data. 20 Differences in the rate of T3 tumors were only encountered for those tumors larger than 3 cm (P = < 0.001). Both figures support the fact that a size cutoff of 3 cm may indicate a different biologic behavior. 10,20 This finding alone would justify an aggressive approach for those masses between 3.1 and 4.0 cm and discourage a conservative approach, especially in younger individuals.
In contrast with data on biology and stage, grade and subtype information were missed in 55% of the cases, showing that he pathology report is still far from perfect at a national level. Although the PALGA registry was implemented in 2000 with the inclusion of an extended number of report words, the decreasing trend for missing grade and subtype data continued during the next 5 years, showing that this administrative implementation was not the only factor leading to a more complete pathologic reporting. Improvement in grade reporting along the decade was similar for all size groups, while inflexions in subtype reporting were more frequently encountered for smaller and larger tumors. Introduction and penetration along the study period of the Heidelberg classification in 1996 22 and less likely of the 2004 World Health Organization classification 23 may be responsible for both the underreporting and the improvement, respectively. Nevertheless, still in 2005, grade and subtype were not mentioned in the pathologic report in 40% and 25% of the cases, respectively, which, in our opinion, is of capital importance and claims for further investigation at a national level.
Regarding data on PN, our figures suggest that as in the United States, in the Netherlands, the technique has been underused for small tumors. As advocated by others, 8 popularization of laparoscopic nephrectomy together with the inherent technical difficulties of this type of surgery and the higher rate of complications when compared with radical nephrectomy are the most plausible explanations for its underutilization. 24
Despite the overall low percentage, significant differences in the type of surgery performed were found when stratifying by size. Moreover, the number of PNs increased during the last decade with a clear positive trend following the trends in the United States. 8 Although no significant differences could be established because of the relative low number of PNs, a point of inflexion can be establish around the years 2001 to 2002, which may reflect a more rational surgical approach for SRMs, as well as mature oncologic results and better technical performance. 25 Information regarding hospital profiles where PN was more frequently performed was not available because of the anonymous nature of the registry.
The limitations of the present work include the presence of missing data on grade and subtype and the assumption that any surgery not specifically defined in the excerpt as PN was considered as radical nephrectomy. Missing data were not distributed completely at random. It seems logical that the pathologists emphasized the description of subtype in younger patients and in smaller tumors because of possible clinical consequences, but we could not find a plausible explanation for the fact that grade was more often missed in females. Consequently the lack of differences in grade among groups should be regarded with caution, especially when other groups have described an increase in higher grades in those tumors between 3.1 and 4 cm. 9,10,20 Incidence of the different subtypes of RCC did not differ from other series in spite of the presence of missing data. 5,10,20
We acknowledge that the overall number of PNs performed could have been slightly underscored by the above-mentioned assumption. Furthermore, PNs for benign cysts were not included in the cohort. While the former has to be regarded as inherent to the pathologic report limitations, the second is a consequence of the terminology selection. We do believe, however, that figures related to PN have to be framed as per group rates along the decade and trends rather than absolute numbers. Increasing rates and trends of PN substantiate our results and are in line with the current literature. 26
In spite of the above-mentioned limitations, the prospective collection of the pathologic reports in the PALGA registry offers the unique possibility of assessing trends in clinical practice at a national level that may ultimately have more impact in health policies than institutional data. The present data support a plea for a standardized pathologic report and confirm the increasing penetration of PN in the general urologic community.
Conclusions
Renal masses up to 4 cm account for 25% of all operated primary kidney tumors in the Netherlands. Only 7.5% of them were benign. When stratified in three groups according to size—≤2cm, 2.1-3.0 cm, and 3.1-4.0 cm—statistical differences regarding age and type of surgery performed were found among the three groups. A statistically significant difference in incidence of T3 stages was only found between tumors smaller and larger than 3 cm. Grade and subtype were described in 55% of the reports with an increasing trend to pathologic reporting along the decade, although still suboptimal in 2005.
PN was scarcely performed in SRMs, although an increasing trend was noted along the decade 1995 to 2005.
Footnotes
Acknowledgments
We would like to thank the PALGA registry and Mrs. M. Casparie for providing access to the data used for this study.
Disclosure Statement
No competing financial interests exist.