
Abstract
Purpose:
The objective of this study was to demonstrate the feasibility of quantum dot (QD)-mediated fluorescence thermometry to monitor thermal dose in an in-vitro thermal ablation zone generated by laser-heated gold nanoshells (LGNS).
Materials and Methods:
Hyperthermic cell death of human prostate cancer cell line (PC-3) was determined after various heating settings and correlated to the thermal conditions using an Arrhenius model prior to LGNS ablation. PC-3 cells with gold nanoshells (GNS) and QDs were exposed to a near-infrared laser and QD excitation light. When the cells were heated by GNS, local temperature was measured using the temperature-dependent fluorescence intensity of QDs. Using the predetermined Arrhenius model, the thermal dose (i.e., cell death of PC-3 cells) by LGNS was estimated with local temperatures measured with QD-mediated thermometry. The estimated thermal dose was confirmed with calcein-acetoxy-methylester viability assay.
Results:
For PC-3 cell line, the activation energy and frequency factor of the Arrhenius model were 86.78 kcal/mol and 6.35 × 1055 Hz, respectively. During LGNS ablation of PC-3 cells, QD-mediated temperature measurement showed that the temperature of the laser spot increased rapidly to ∼58°C ± 4°C. The estimated thermal dose showed that cell death reached to ∼90% in 120 seconds. The death cell zone observed after staining corresponded to a peak area of the temperature profile generated after analysis of the QD fluorescence intensity.
Conclusions:
This study shows that the QD fluorescence thermometry can accurately monitor the PC-3 cell death by LGNS ablation. This approach holds promises for a better monitoring of thermal ablation procedures in clinical practice.
Introduction
In this context, we propose a noninvasive, real-time temperature-monitoring method using quantum dots (QDs) temperature-dependent fluorescence. QDs are semiconductor fluorescence nanoparticles with superior optical properties. Compared with organic dyes, QDs have numerous advantages including tunable emission from visible to infrared wavelengths, large absorption coefficients, very high levels of quantum yield, and photostability. 4 QDs have shown a great potential for noninvasive in-vivo imaging when their excitation and emission wavelengths are tailored with a near-infrared (NIR) spectrum at which the absorption by tissue becomes minimum. 5 Recent studies have demonstrated that QDs display temperature-sensitive photoluminescence and can be used as temperature probes. 6 In this phase I study, we extended the concept of QD thermometry and demonstrated the feasiblity of QD-mediated thermometry to monitor spatiotemporal thermal dose (i.e., hyperthermic cell death) during thermal therapy using laser-heated gold nanoshells (LGNS) ablation of human prostate cancer cell line (PC-3) cells as a model system.
Materials and Methods
Cell culture
A PC-3 was maintained in 5% fetal bovine serum–supplemented growth medium and incubated at 37°C and 5% CO2. Cultured PC-3 cells were separated from culture flasks by immersion in 0.05% trypsin and 0.53 mM ethylenediaminetetraacetic acid. The cells were consistently collected when they were at 60%–80% confluence and in log phase growth. After separation, the cells were pelleted by centrifugation and the excess medium was removed. The cell pellet was resuspended in the culture medium for experiments at a nominal cell concentration of 2 × 10⁶ cells/mL.
Hyperthermic injury characterization of PC-3 cells by an Arrhenius model
Hyperthermic injury of PC-3 cells was characterized by an Arrhenius model as described previously. 7 Briefly, 50 μL of PC-3 suspension was exposed to various heating conditions using an isothermal block. To prevent dehydration during the heating protocol, the sample was sealed between coverslip and microslide using an O-ring. After the heating, the cell suspension samples were incubated at 37°C for 3 hours before the viability assay. The viability was measured by a membrane integrity assay using Hoechst (H-33342; Molecular probes) and propidium iodide (P-1304; Molecular probes). All viability values were normalized against the control viability, which was always higher than 90%. Experiment at each heating condition was repeated at least three times.
LGNS ablation of PC-3 cells
Our technique of in-vitro destruction of cancerous cells by GNS has been recently described. 8 The following points are the brief highlights of this technique:
Gold nanoshells (GNS) were provided by Nanospectra Biosciences and designed to have 110 ± 11 nm silica cores and a 10-nm gold shell in order to optimize optical scattering and absorption. Seven hundred fifty microliters of 3 × 10⁹ GNS/mL were mixed with 1230 μL growth media with 5% supplements at room temperature. Nanoshells have the ability to be tunable optically and have emission/absorption properties that range from the ultraviolet (UV) to the infrared. When simulated by the NIR light, the electrons in the outer gold shell are excited. The relaxation of these stimulated electrons back to their ground state releases energy in the form of heat.
Laser irradiation: The dishes were irradiated with an NIR 810-nm laser (Diomed) in the pulse/interval mode with 0.9 seconds pulse and 0.1 second interval for 5 minutes. The laser power density was set at 0.88 W/mm2 with a 1.6 mm spot size, based on our own experiments 8 and prior experiences. 9 Control cells were removed from the incubator and exposed to ambient air for 5 minutes without GNS.
QD-mediated fluorescence thermometry during LGNS ablation
The details of QD-mediated temperature measurement are described elsewhere.
6
Briefly, prior to measurements, we established a correlation between QDs fluorescence emission and temperature while varying temperature from 20°C to 70°C. The normalized emission intensity was linearly correlated to temperature as below:
where I is the intensity, T is the temperature, and T ref is the reference temperature (= 25°C for this study). To ensure accuracy and reliability, this linear relationship was obtained after at least three repetitions while maintaining all optical settings unchanged, and the goodness of fit (r 2 ) was 0.983. The QDs used in this study (Qtracker 655; Invitrogen) have an emission peak wavelength at 655 ± 10 nm. Prior to laser irradiation, 20 μL of 2 μM QDs were added to the GNS and cell culture dishes. During the laser activation of GNS, the QD fluorescence from the dishes was imaged using an NIR CDD camera (KP-F2; Hitachi). To remove the laser light from the images, IR cut filter (Tiffen) was attached to the camera. The images were stored on a computer using a frame grabber (PCI-1410; National Instruments) and were further processed to obtain spatiotemporal temperature information.
QD-mediated thermal dose estimation
The activation energy and frequency factor were used to estimate the thermal dose during GNS-mediated heating as below:
where T is the measured temporal temperature and t is the time. To confirm the cellular destruction, the dishes were placed at 37°C in 5% CO2 for 1 hour after the experiments. Cell viability was immediately assessed using 1 μL of calcein (Invitrogen) per dish, on the premise that only viable cells can take up and retain fluorescent green dye. Prior to staining, the cells were washed with phosphate-buffered saline. Stained cells were examined with a phase-contrast fluorescence microscope (Nikon).
Results
Hyperthermic injury characteristics of PC-3 cells using the Arrhenius model
The results of the viability assay are plotted in Figure 1. Generally, as the heating temperature and duration increase, the viability of PC-3 cells decreases. The injury threshold of 36.8% survival (1/e = 36.8%) was used to determine thermal dose (i.e., heating time at a given temperature to achieve the injury threshold). 10 These data were further analyzed to estimate the activation energy (E) and the frequency factory (A) of PC-3 cell line using the Arrhenius injury accumulation model. 11 The estimated activation energy is 86.78 kcal/mol and the frequency factor is 6.35 × 1055 Hz. Using these values, the cellular destruction by GNS-mediated heating can be estimated by integrating transient temperature measurement made with the QD-mediated thermometry. 6
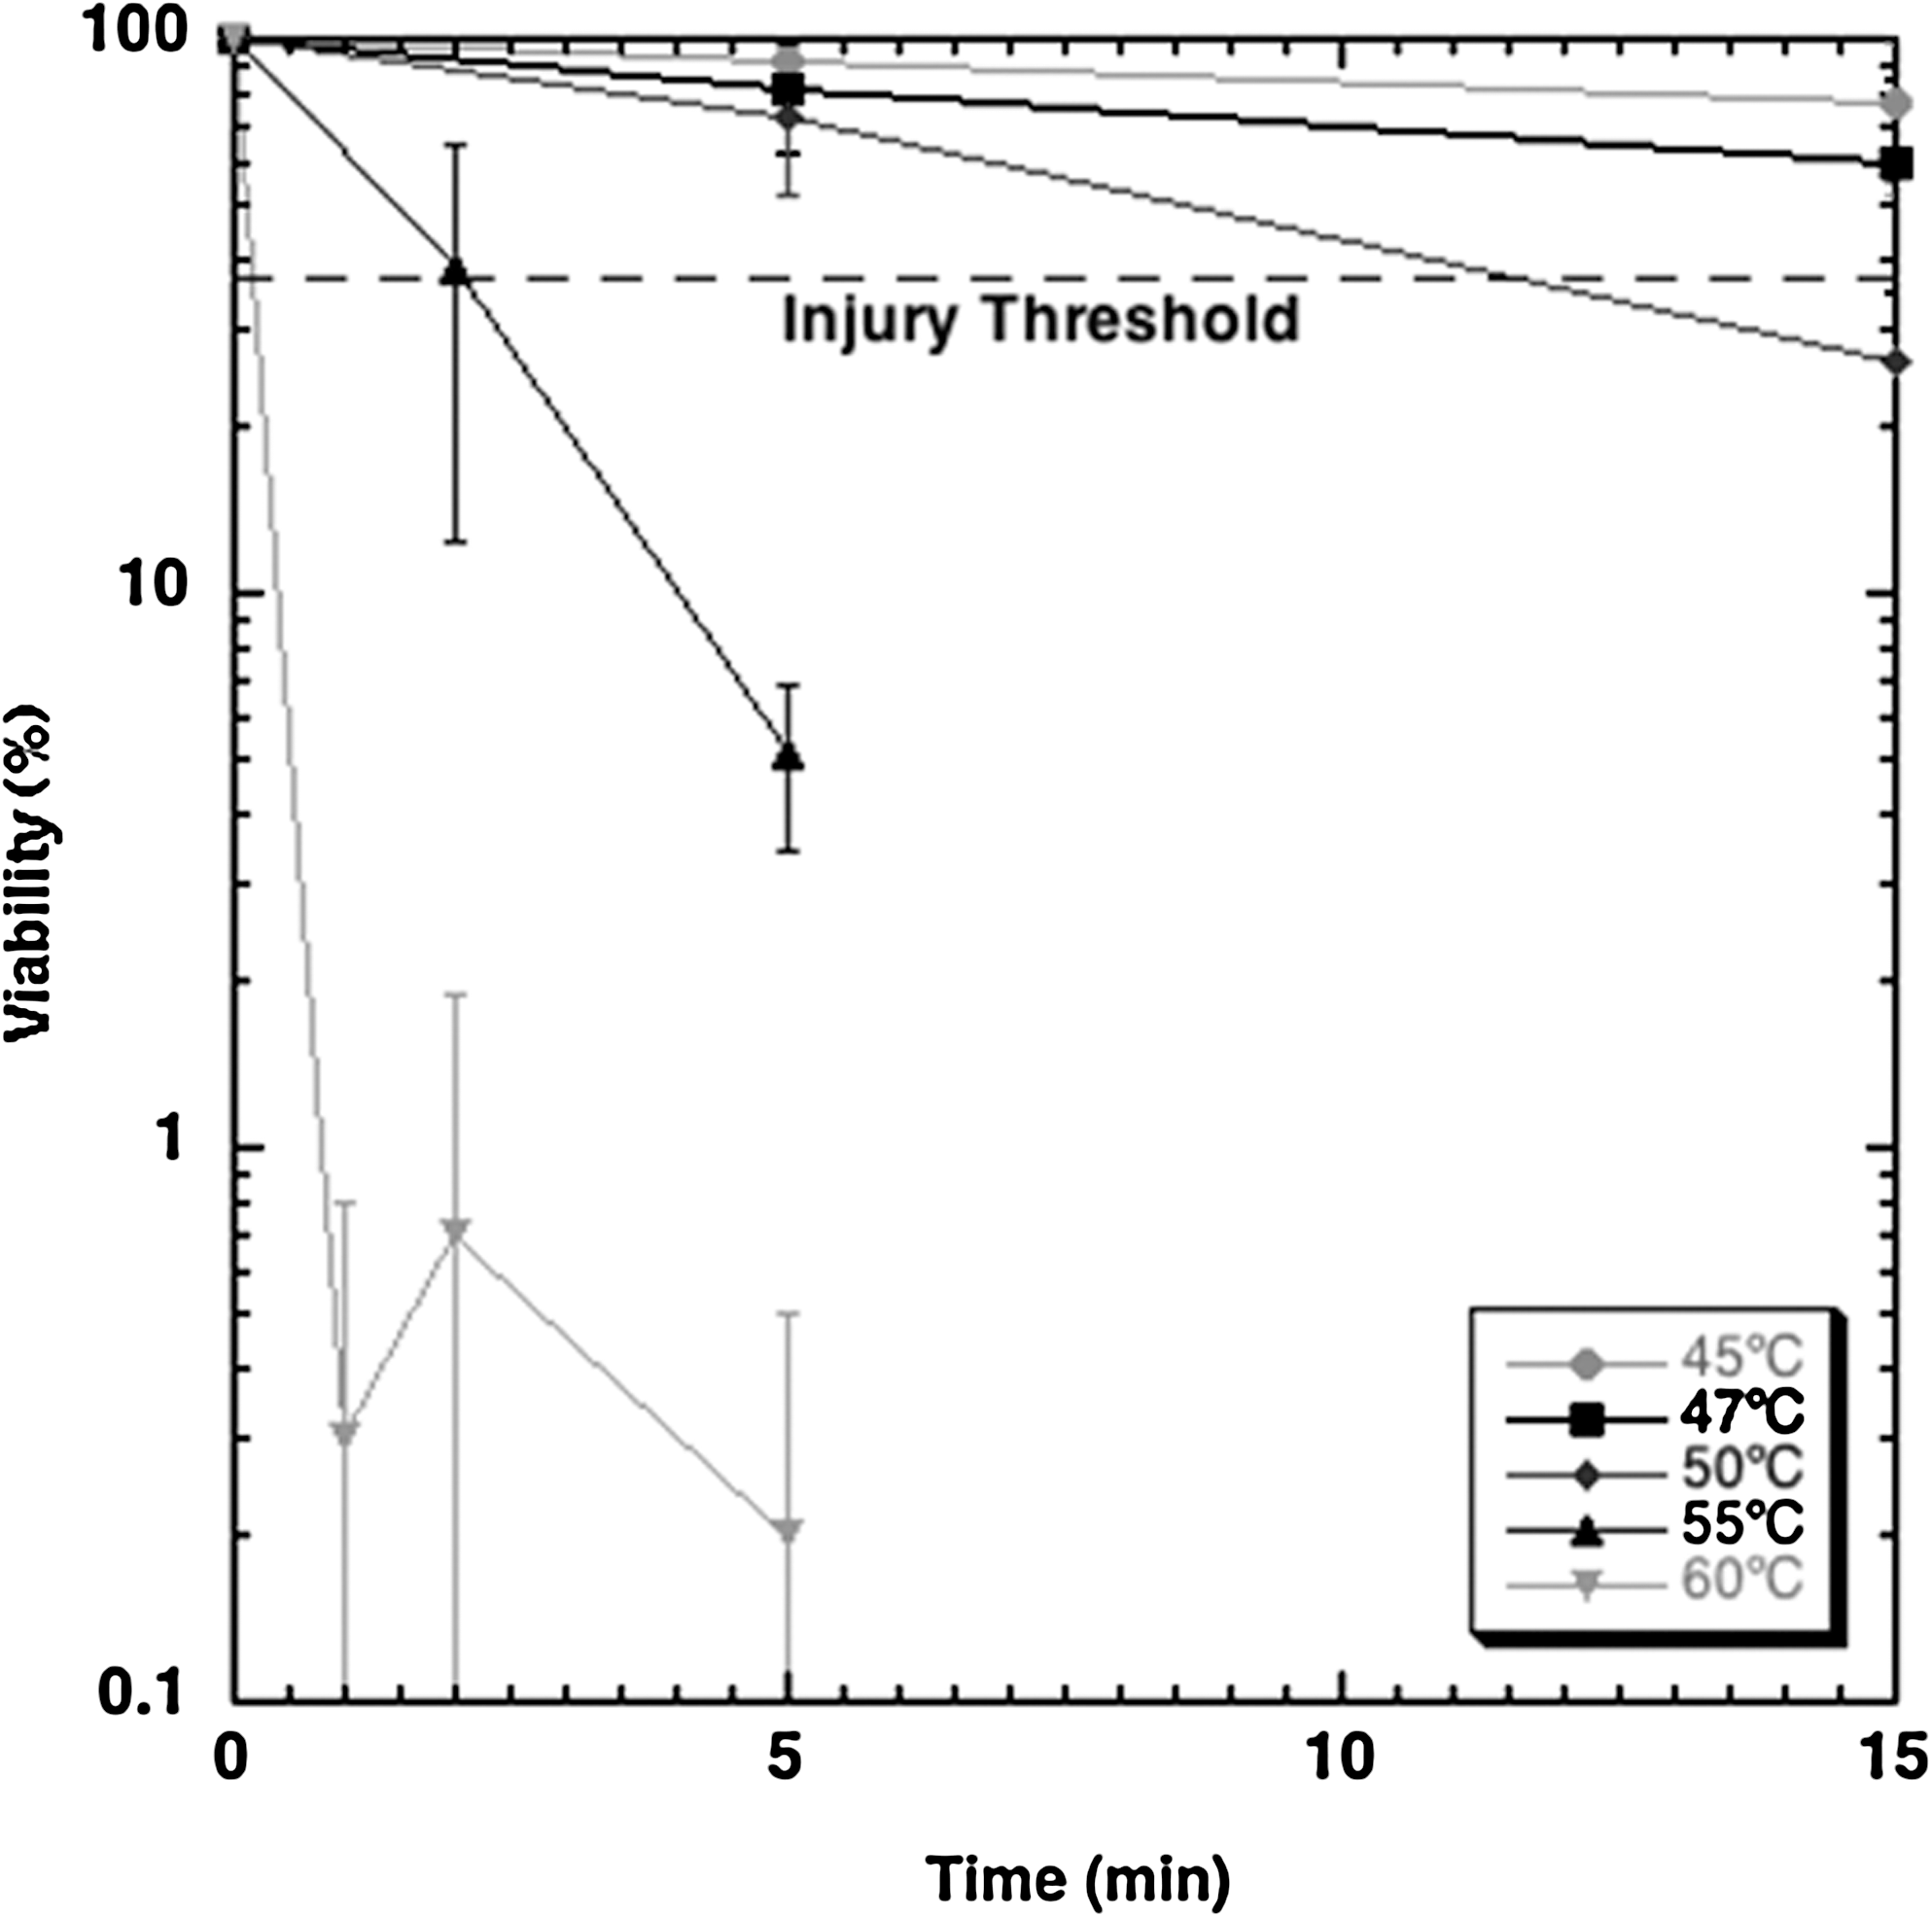
Hyperthermic injury characteristics of PC-3 cells. PC-3 = prostate cancer cell line.
QD fluorescence monitoring of ablation zone
A sequence of the captured image is shown in Figure 2. Two distinct regions of QDs intensity changes are observed. The first region is the darkest center at the location where the laser beam was focused. The second region is a dark annular region around the first center region. The intensity and size of the first region remain constant during the heating procedure. Conversely, the second annular area grows in size and decreases in intensity over time. We can see a gradient forming dark to white, which is due to illumination. This gradient effect was removed by substracting the baseline intensity (i.e., intensity value prior to illumination). Corresponding spatiotemporal temperature profiles converted from the intensity readings are shown in Figure 3. Because of heat transfer, the area of elevated temperature grows in a radial direction. We acknowledge a deviation of as much as 2°C from baseline temperature at 1 second on Figure 3 graph. This may be due to the limitation of our current experimental setup, where a spatial average of 3 × 3 interrogation window and the resulting signal-to-noise ratio should be improved for better signal-to-noise ratio and resolution. We also observed small fluctuations of the temperature, which are thought to be induced by the variation of the laser power that was set on pulse mode.
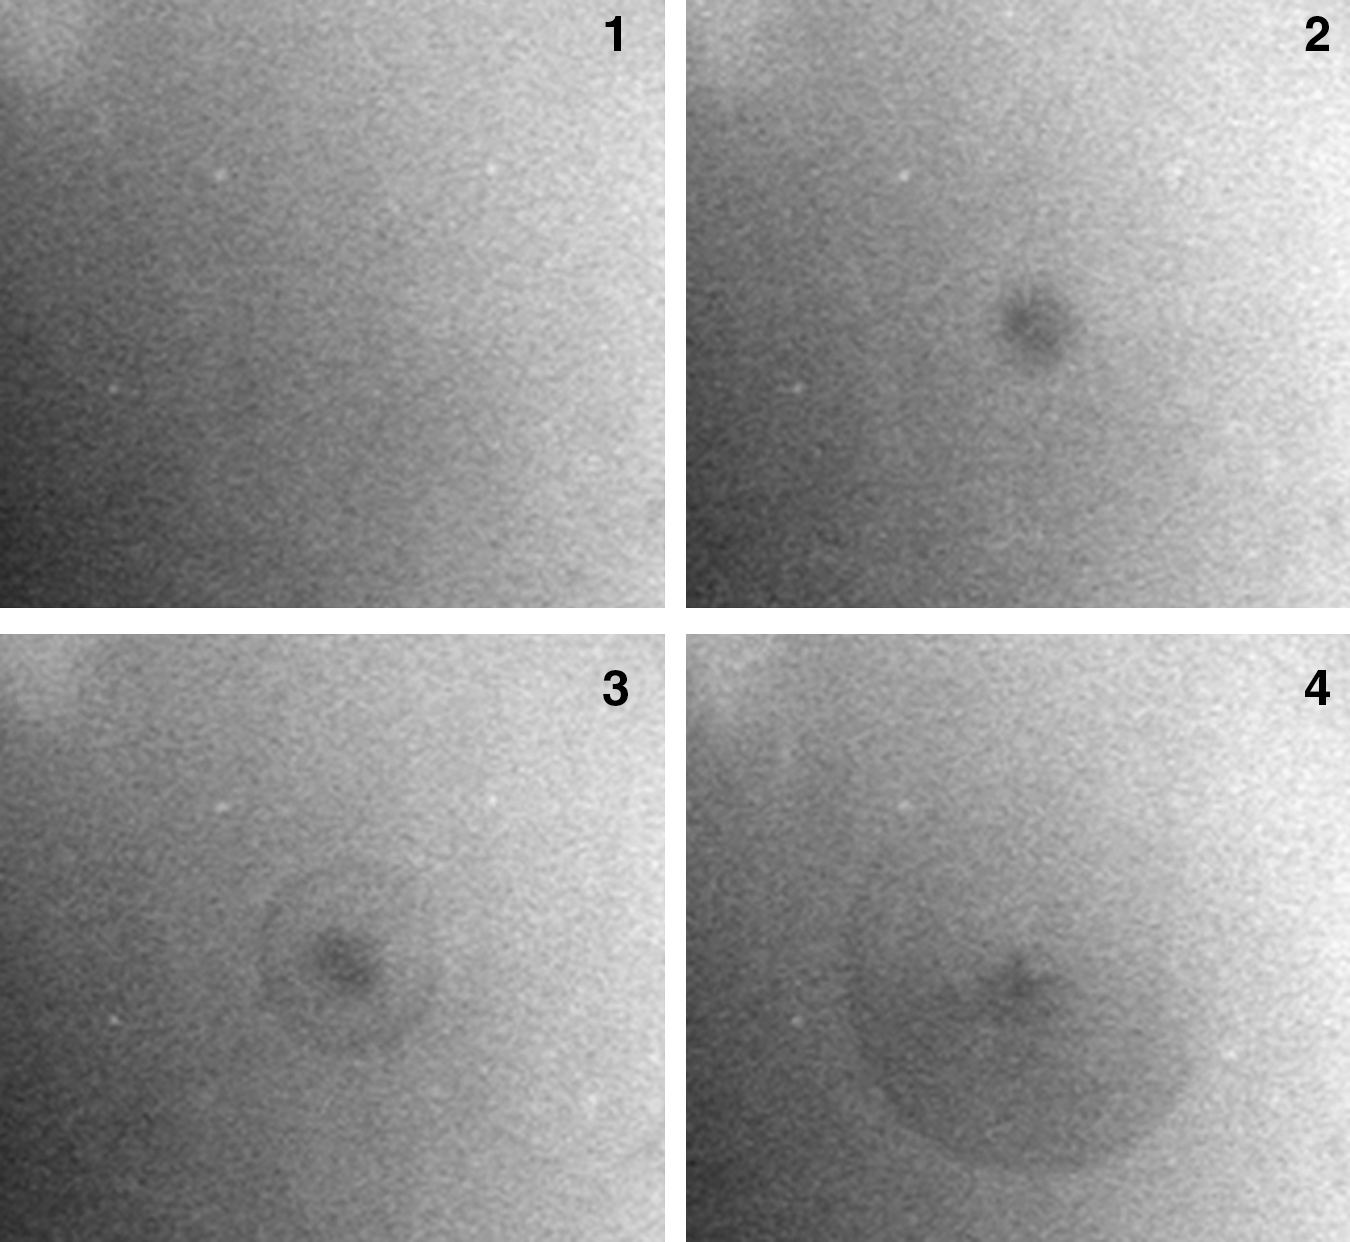
Quantum dot fluorescence during gold nanoshells-mediated heating procedure (images 1–4 captured at time 0, 5, 7, and 20 seconds respectively). This sequence of images shows that the intensity of the heating spot significantly decreases between time 0 (image 1) and 5 seconds (image 2), and this region of decreased intensity grows in the radial direction with time (images 3 and 4).
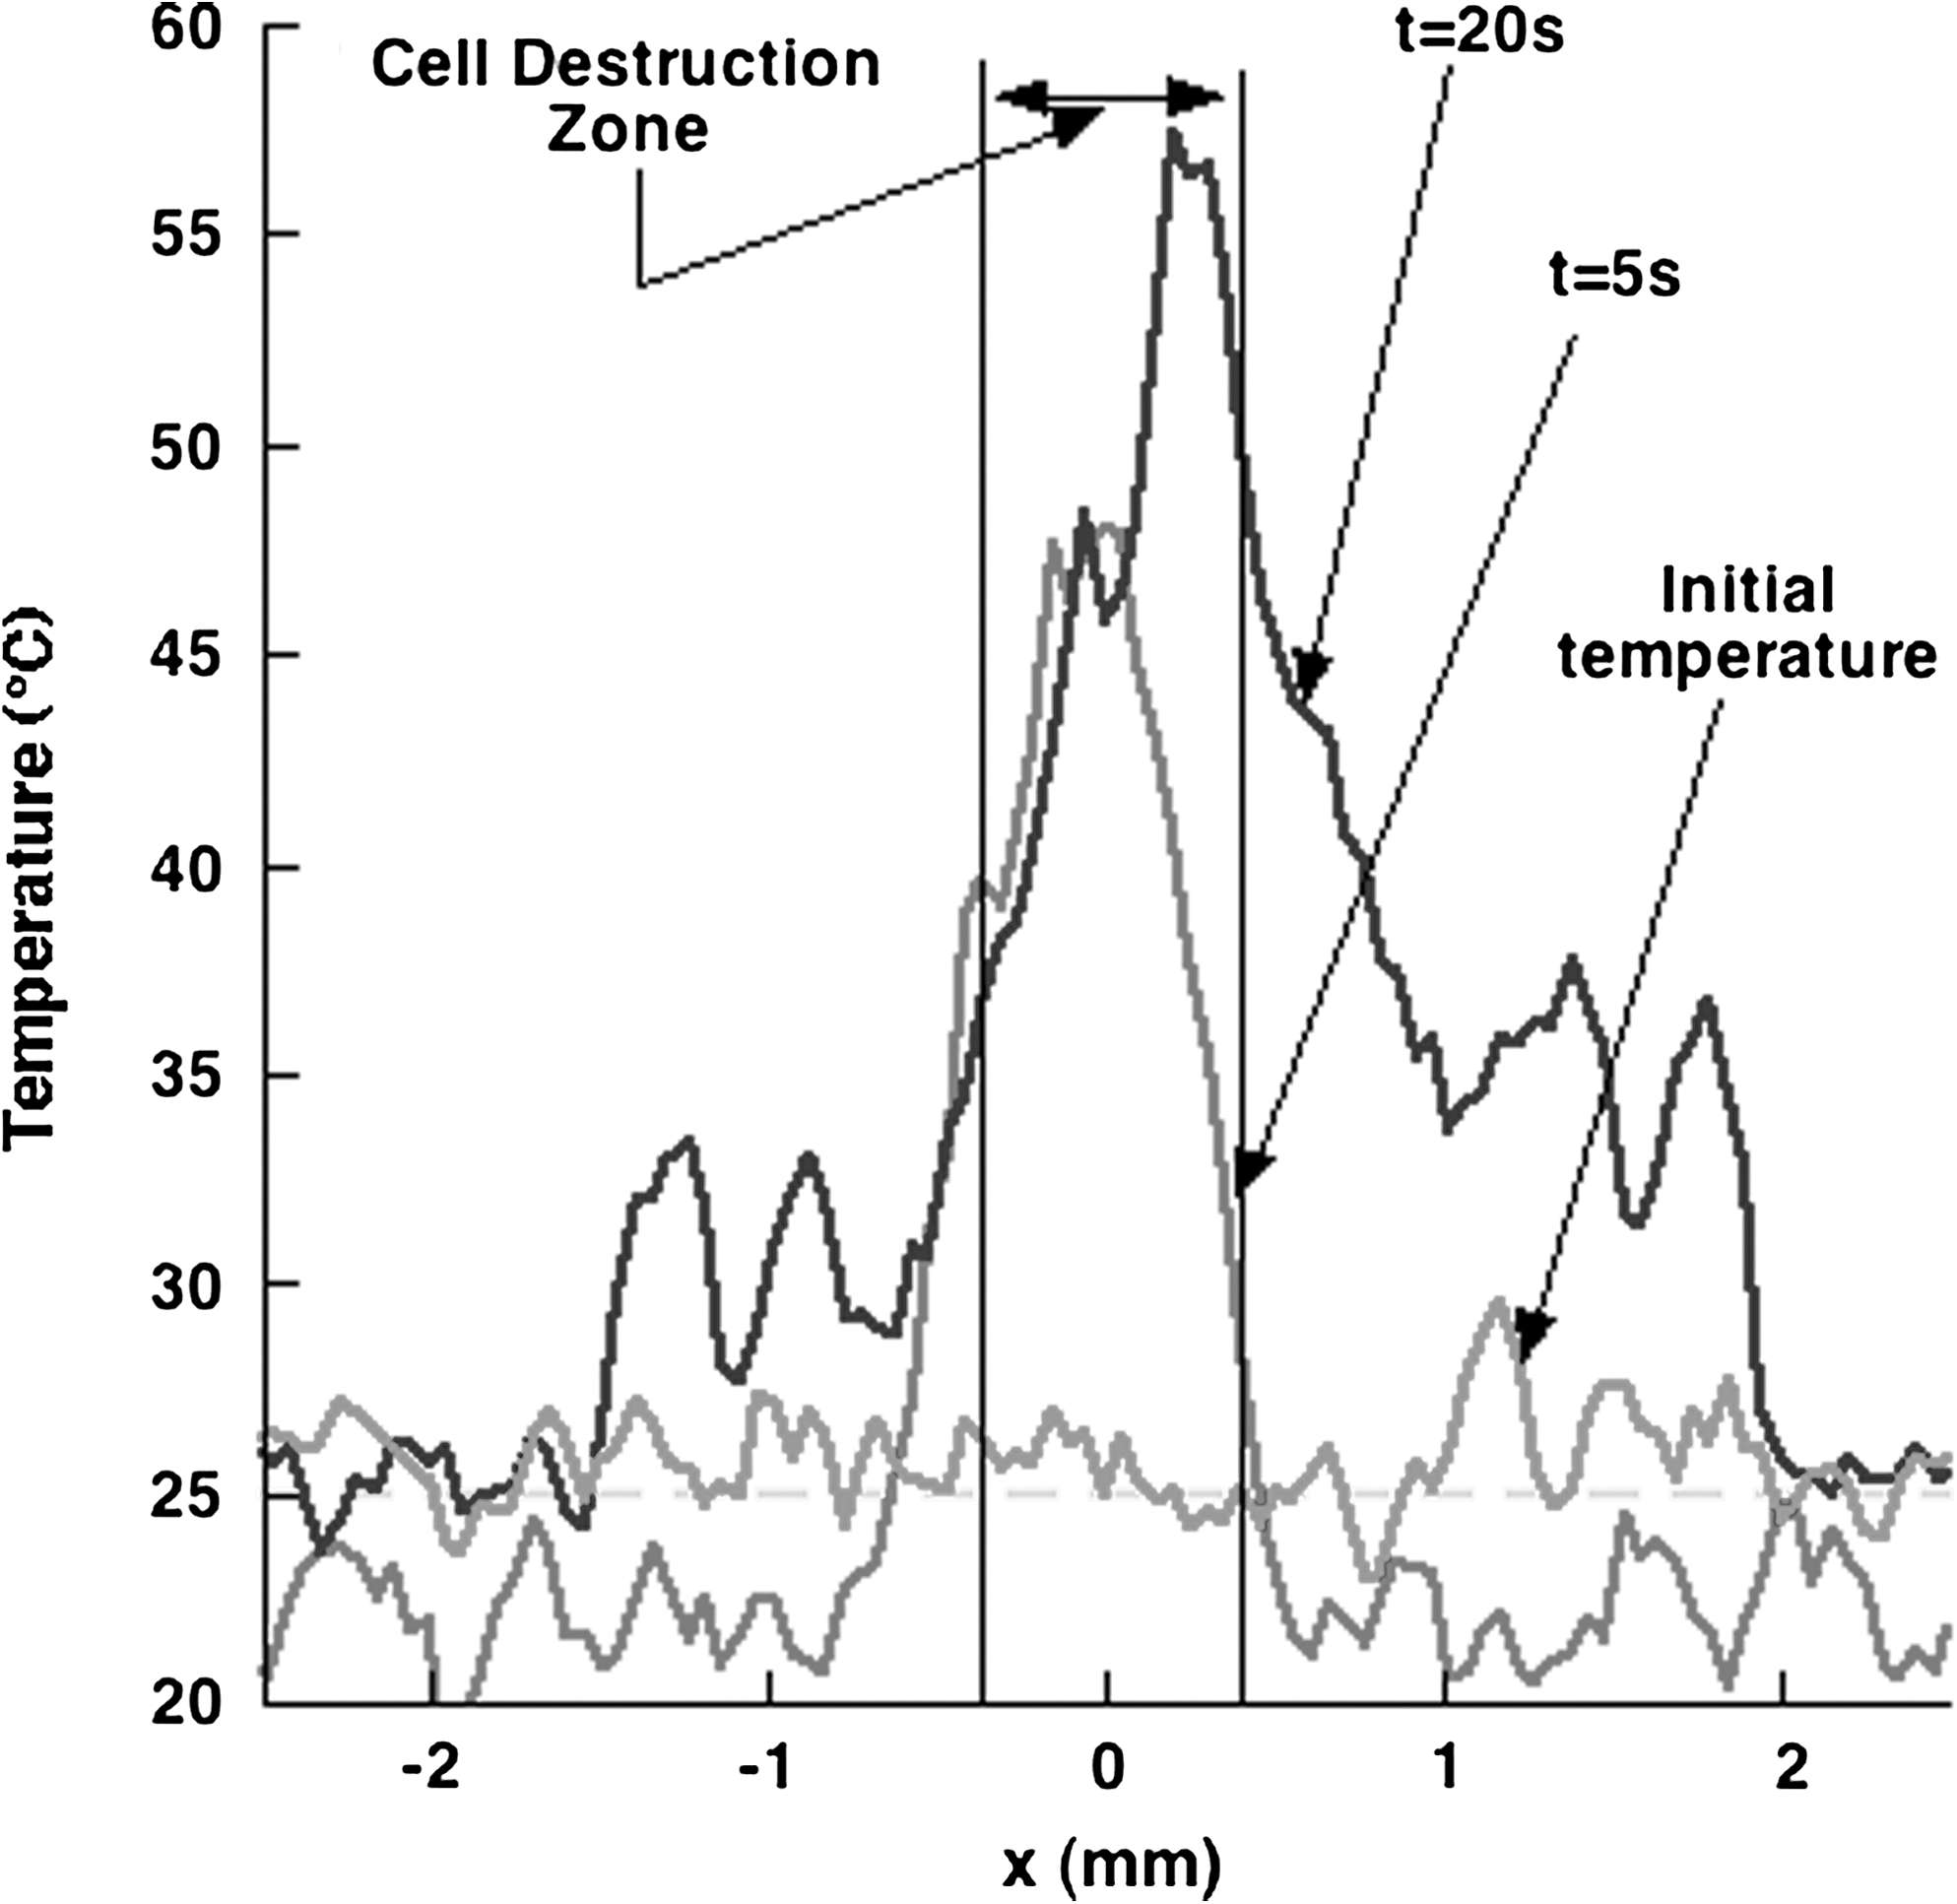
Typical temperature profiles during GNS-mediated thermal therapy. The temperature peak corresponds to the heating laser spot on the petri dish. GNS-gold nanoshells
Thermal injury induced by GNS-mediated thermal therapy
A representative temperature history at the laser focus spot is shown in Figure 4. As already illustrated, 6 the temperature rises rapidly within 20 seconds and oscillates within approximately ± 4°C during the GNS-mediated heating. This oscillation is thought to be caused by the variation of laser power during its operation. Corresponding cellular destruction is presented in Figure 5. The cellular destruction is rapidly accumulated to ∼92% in 180 seconds. The destruction continues to be accumulated and reaches 97% cell death at the end of the heating period. Although no further temperature data are available after the end of heating, the injury is expected to occur further in the postheating period because of elevated temperature. Figure 6 shows the microscopic observations made under bright and fluorescent fields. We confirmed that after the treatment, the cells are still attached on the dish, but fluorescence imaging demonstrates a nonviable area corresponding to the GNS-mediated laser heating, with an average size of 653 μm. As the present thermometry can only measure local temperature change, it cannot distinguish the cell death mediated by GNS from that by laser only. However, Stern et al 8 reported that the laser power used in the present study did not induce any direct cell death with GNS. Thus, the cell death observed in Figure 6 should be caused by GNS-mediated heating.

Temperature history of the laser spot.
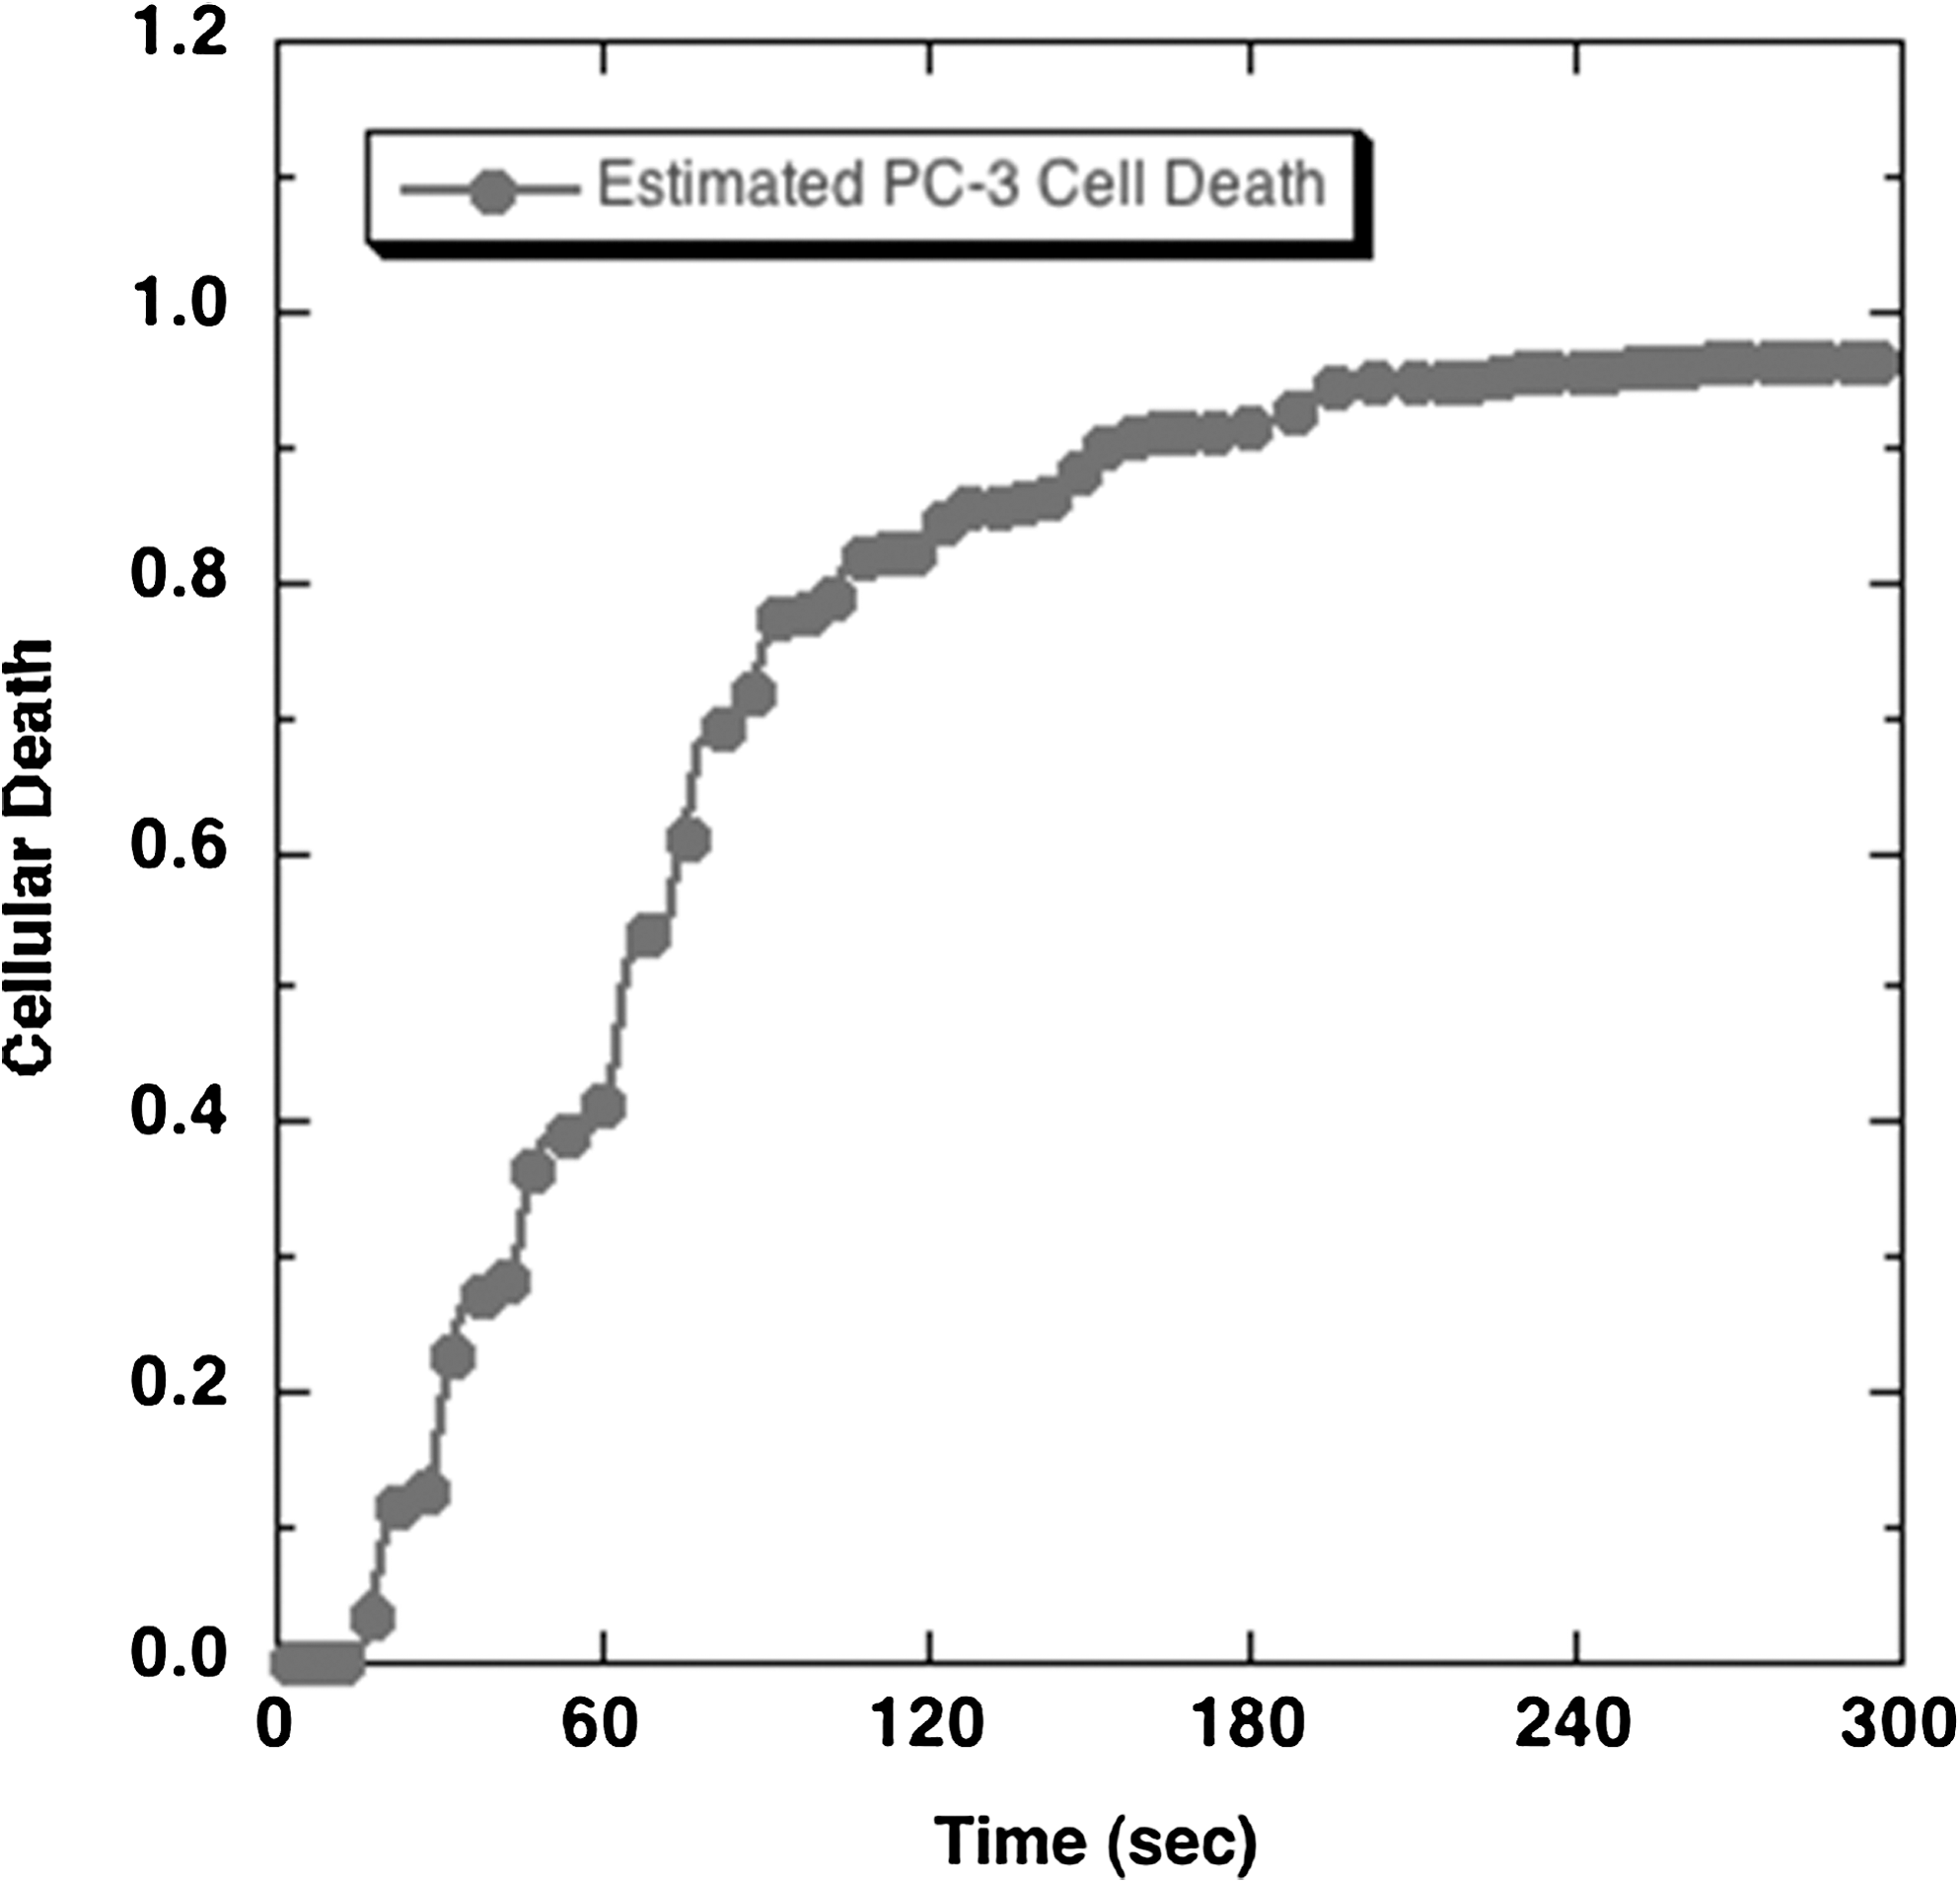
Estimated destruction of PC-3 cells in the ablation zone.
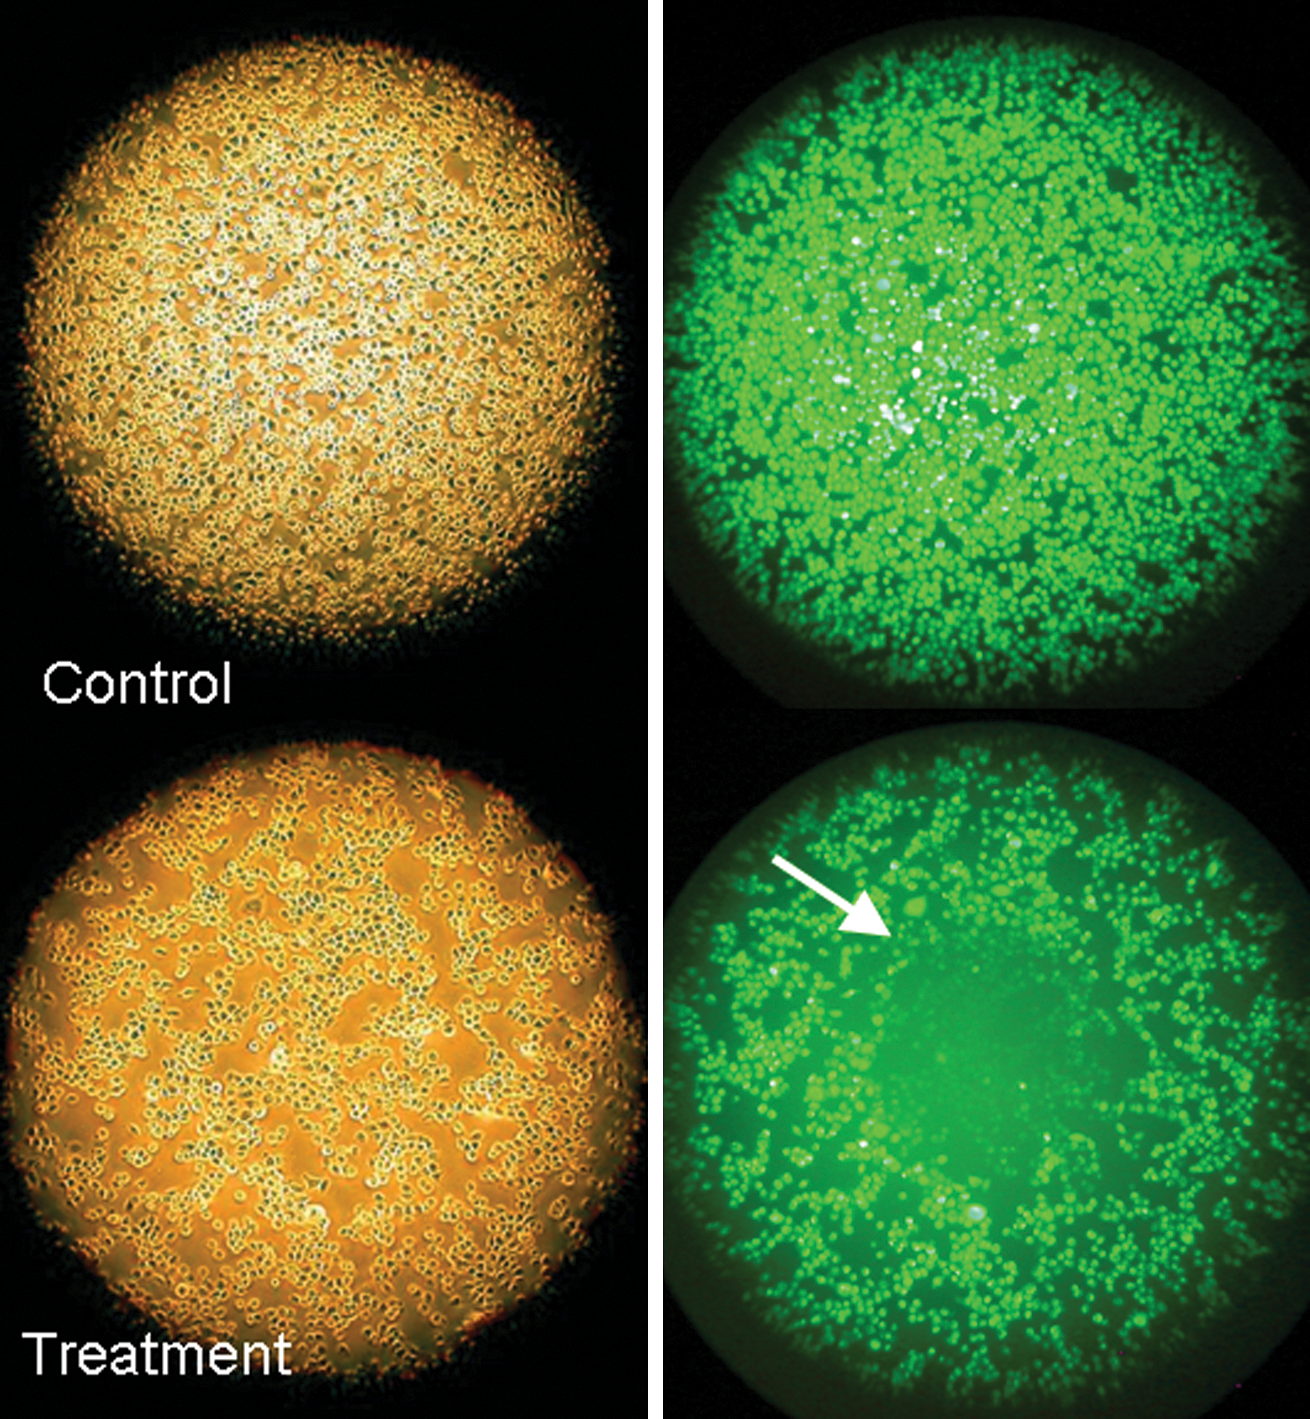
Dark-field (left side) and fluorescence (right side) micrographs of PC-3 cells after treatment. Dark-field micrographs show the cells still attached to the dish after treatment. The fluorescence micrographs show live calcein-acetoxy methylester–stained cells. In the treatment group, an ablation zone was created (arrow) with an average diameter of 653 ± 42 μm (n = 9).
Discussion
Limitations and morbidity of surgical procedures to treat cancer have led to the development of alternative therapeutics to destroy tumoral cells, using either high or freezing temperatures. Exposure of tissues to high temperatures creates desiccation and coagulative necrosis by direct alteration of cellular components and denaturation of the cellular architecture. RFA is currently the most common hyperthermic Food and Drug Administration–approved minimally invasive ablation therapy in the United States. 1 Others, including high-intensity focused ultrasound, stereotactic radiosurgery, or microwave thermotherapy, are under development.
One of the most important pitfalls of thermal ablation is the lack of comprehensive confirmation of complete tumor destruction. The heat generated in the tissue decreases with the distance from the probe. Thermal distribution is also affected by physical properties of the tissues such as thermal conductivity, impedance, and the nearby vascularization, which can lower the temperature by heat absorption. Thus, the thermal ablation zone might not accurately correspond to the targeted tumor and a small proportion of tumoral tissue (particularly around the edges of the tumor) may survive the ablation process. 2,3,12 Further, the information upon which proper heating is ensured is very imprecise. Monitoring generally relies on thermocouples, which provide very limited temperature analysis from single points in the tumor, and not volumetric readings. The improvement of real-time intraoperative temperature monitoring is therefore crucial to the success of RFA.
Our phase I study shows that the measurement of fluorescence emission of QDs can provide an accurate evaluation of the temperature of a GNS-mediated heating zone in an in-vitro setting. Fluorescence imaging shown in Figure 2 suggests that the noted decrease in brightness is directly related to GNS-mediated heating by the laser. We also observed a growing annular area of intensity decrease over time, suggesting that the heat induced by the GNS irradiation at the laser spot is transferred in a radial direction, probably through a conduction mechanism. However, the average diameter of the nonviable area measured under the microscope was 653 μm, which corresponds to a very narrow area of the temperature curves displayed on Figure 3.
Monitoring the completeness and precision of the thermal ablation zone remains a real technical challenge in clinical practice, and current techniques relying on imaging guidance have limitations. Ultrasonography is not adequate because of the steam bubbles generated by the heating process. Computerized tomography can detect residual tumoral tissue. However, its efficacy is limited by the absence of real-time visible change of the tumor during the procedure. 13 Magnetic resonance imaging has the ability to assess tissue changes instantaneously, allowing the operator to reposition the heating probe during the procedure. 14 However, the equipment and software are only available in few institutions. Fiberoptic temperature monitors are promising nonconducting devices that have been used successfully to adjust coverage of the tumor volume in real time during RFA ablation. 15,16 Our proposed QD-mediated image-guidance system for thermal therapy holds promises to address the challenge of monitoring thermal ablation, especially when the tumor is easily accessible, such as laparoscopic thermal ablation of cortical kidney tumors. It can provide in real time the thermometric data in both temporal and spatial dimensions with high accuracy. Contrast IR cameras measure surface temperature. We envision the present technique to be extended to volumetric temperature measurement by using QDs whose emission/excitation spectra are tuned in the NIR range. QDs fluorescence can be observed through tissues, which enables noninvasive volumetric temperature monitoring. Recent developments of volumetric temperature measurement have been described by Hanson et al. 17 With further development, we hope that such a system can convert QDs fluorescence intensity into temperature, thereby appraising the extent of thermal injury. This real-time feedback will allow the operating physician to determine the effectiveness of the intervention and adapt treatment parameters. Ideally, such a system would simplify the procedure and spare costs without adding any morbidity. Apart from thermal ablation, this monitoring method could also be useful for hyperthermia studies.
QDs are promising nanoscale visualization tools for biological applications, because of their long fluorescence lifetimes with broadband absorption and narrow emission. 18 The QDs we used have been specifically designed to fluoresce in the NIR spectra to overcome the limitations of the visible spectra where biological tissues have lowest absorption. This property confers them great potential for in-vivo imaging. 19 Although the optical properties of QDs are superior to those of conventional organic fluorophores, their use in human might be limited by their potential toxicity. QDs are known to be toxic to cultured cells under UV irradiation. 20 However, in the absence of UV irradiation, QDs with a polymer coating do not demonstrate any toxicity in vitro and in animals. 18 Also, recent research is proposing a new way to design QDs that can be cleared from animal without toxicity. 20 This issue must be carefully addressed before any human application is foreseen.
Conclusion
Our phase I study showed that the measurement of QDs fluorescence emission can accurately monitor the GNS-mediated temperature changes occurring on cancerous cells heated by laser. Technical refinements are needed, but this experiment holds promises for clinical applications to better appreciate the heating zone during thermal ablation and maximize the chances of tumor destruction.
Footnotes
Acknowledgment
Dr. A. Tuncel was supported by the Scientific and Technological Research Council of Turkey.
Disclosure Statement
Conflict of interest: none.