
Abstract
Background and Purpose:
A major advance in the standard practice of tissue-based pathology is the new discipline of systems pathology (SP) that uses computational modeling to combine clinical, pathologic, and molecular measurements to predict biologic activity. Recently, a SP-based prostate cancer (PCa) predictive model for both preoperative (Px+) and postoperative (Px) prostatectomy has been developed. The purpose of this study is to calculate the percent agreement and the concordance between the Px+ and Px end points.
Patients and Methods:
Fifty-three patients underwent robot-assisted prostatectomy for PCa, and had Px+ and Px testing performed. Data were collected on Px+ end points and Px end points along with pathologic specimen results. The percent agreement and the degree of correlation between the Px+ and Px end points were then calculated.
Results:
The percent agreement (PA) between Px+ end points and Px end points ranged from 77% to 87%. The PA between a high Px+ favorable pathology (FP) classification and dominant Gleason score ≤3 and Gleason sum ≤6 was 71.7% and 37.4%, respectively. On univariate analysis, Px+ disease progression (DP) score significantly correlated with Px prostate-specific antigen recurrence (PSAR) score (P<0.001), while Px+ DP probability significantly correlated with PxPSAR probability (P<0.001). Px+ FP probability significantly correlated with postprostatectomy dominant Gleason grade ≤3 (P<0.001) and Gleason sum (P<0.001).
Conclusion:
The PA between Px+ and Px testing end points for radical prostatectomy patients was very good. Furthermore, there was a direct correlation between most Px+ and Px end points. While the Px+FP classification and Gleason sum demonstrated a poor PA, Px+FP score still maintained a direct correlation to prostatectomy Gleason sum.
Introduction
In recent years, a personalized prognostic tool that integrates clinical data with tumor specimen biometrics from either diagnostic needle biopsies or radical prostatectomy specimens has been developed (Aureon Biosciences, Inc, Yonkers, NY). Biometric data for both specimen types is obtained using a combination of two independent tests: PathoMetrix™ and M-Plex.™ Similar to Gleason score, PathoMetrix uses morphologic features of the cancer to predict the degree of aggressiveness the cancer is likely to display.
While Gleason scoring depends solely on the glandular pattern as seen under a light microscope, however, PathoMetrix analyzes digital images of the specimens for additional morphologic features, such as the glandular, cellular, and nuclear size and distribution (Figs. 1 and 2). M-Plex fluorescently tags individual antibody:antigen complexes, such as androgen receptors, AMCAR, DAPI, and CK18, whose distribution is then analyzed using spectral imaging (Figs. 3 and 4). Previously, this integrated approach has been shown to predict biochemical (prostate-specific antigen [PSA]) recurrence and to predict clinical failure (metastasis and/or androgen-independent disease) using preoperative and postoperative specimens. 10 –12
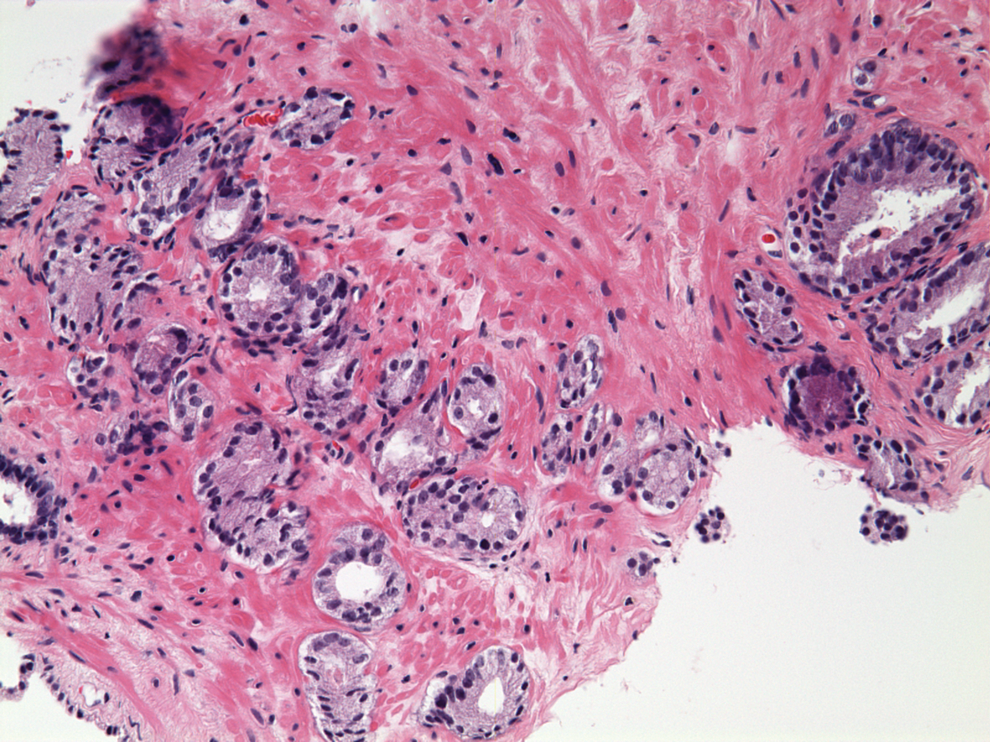
Original hematoxylin and eosin stain of prostate biopsy sample.

Same biopsy specimen as Figure 1 except image has been segmented by PathoMetrix imaging. In this image, lumens are segmented in red. Epithelial nuclei within well-formed glands around lumens are in blue, whereas epithelial nuclei that are nongland associated are segmented in green.
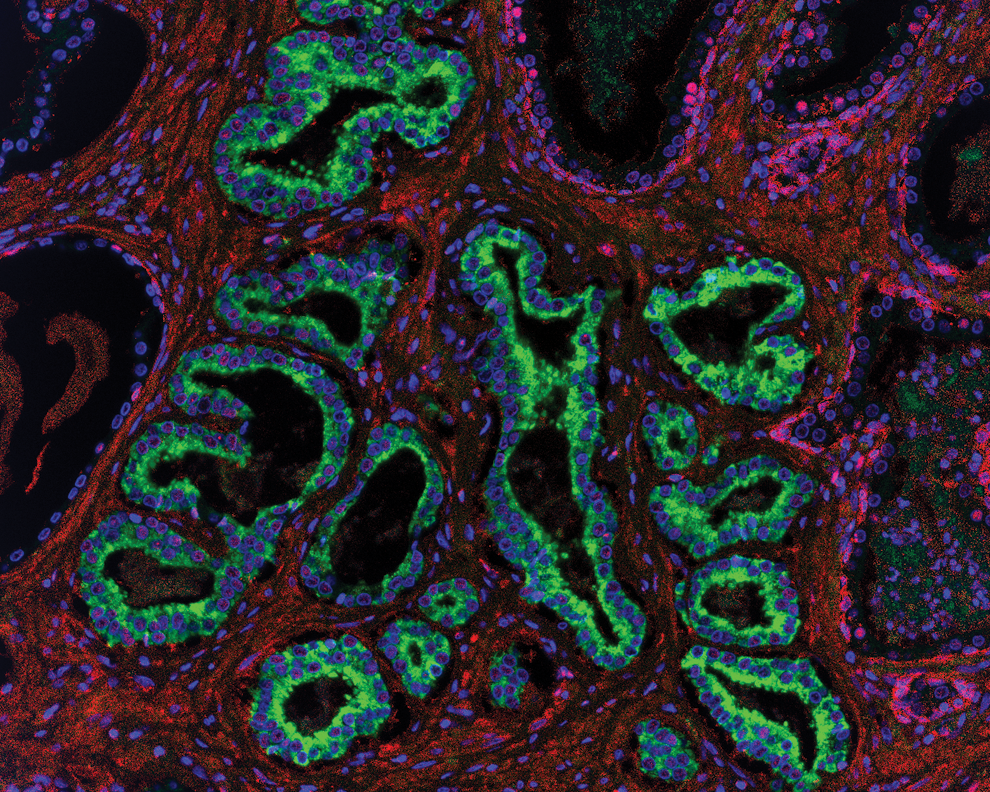
Radical prostatectomy specimen in the same patient. This image is the patient's composite picture of the immunofluorescent multiplex. In blue is DAPI, in green CK18, and in purple AR.
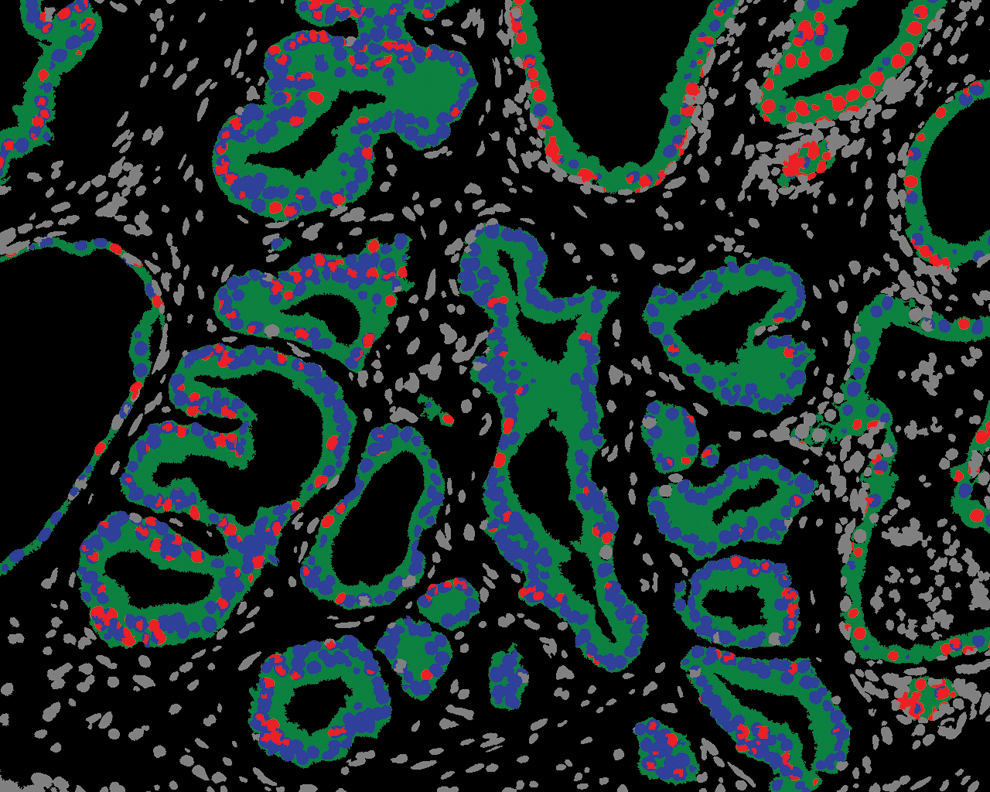
The M-Plex segmented androgen receptor image. In green is glandular CK18, in blue is epithelial nuclei, and in red are AR+ epithelial nuclei.
Two independent systems-based models have been developed to determine progressive disease using the patient's diagnostic biopsy material (Px+) and using the patient's prostatectomy specimen (Px). The two main end points for Px+ are disease progression (DP) (Px+DP), defined as the postoperative risk of death from disease, metastasis development, or a PSA rise after secondary treatment such as androgen deprivation within 8 years, and favorable pathology (FP) (Px+FP), which predicts the likelihood of favorable postoperative outcomes, including Gleason sum ≤6, pathologic stage ≤T2, and an undetectable PSA nadir. Px testing similarly provides two main end points—namely, PSA recurrence (PxPSAR), defined as the likelihood of development of a biochemical recurrence within 5 years of prostatectomy, and disease progression (PxDP). Similar to Px+DP, PxDP predicts the likelihood of DP, metastasis, death from disease, or castrate resistant PSA rise despite secondary therapy, except the predictive period is 5 years.
To apply the test results clinically, each Px+ and Px end point is given a score (scale 1–100) that is used to calculate percent probability and relative risk. The patient is subsequently stratified into either a low or high probability group for each end point. The percent probabilities and relative risks are determined from the cohort of patients that was used to validate the original Aureon mathematical model. The Px+DP cutoff for low probability is 30.2 and corresponds to a 15% probability of meeting Px+DP criteria for disease progression. Unlike other end points, Px+FP probability has an inverse correlation in that a “high risk” designation portends a better pathologic outcome. Therefore a Px+FP probability of >41% predicts more favorable pathology after extirpative surgery. The cutoffs for low risk of PxDP and PxPSAR are ≤41 (19% probability) and ≤48 (30% probability) respectively.
While both Px+ and Px end point results are calculated using the same tests (PathoMetrix and M-Plex), they are independently performed on different tissue specimens. Factors such as volume of benign/malignant specimen, multifocality, and postoperative up- or down-staging can affect results. If either Px+ or Px is to be clinically relevant, however, there should be a certain degree of concordance between the two in the same patient. Disparate end point results between the two would bring into question the accuracy of preoperative testing, postoperative testing, or both. To the authors' knowledge, however, this has not been previously evaluated. The purpose of this study was to calculate the percent agreement and the concordance between the Px+ and Px end points.
Patients and Methods
All data for this study were acquired from an Institutional Review Board-approved, prospectively maintained, robot-assisted laparoscopic prostatectomy (RALP) database. Between May 2010 and December 2010, 53 patients underwent RALP for the primary treatment of PCa and had preoperative Px+ and postoperative Px testing performed. Patients were excluded from the current analysis if they had received neoadjuvant hormone deprivation therapy or radiation therapy or if clinical, pathologic, Px+ or Px data were not available. Because this study was performed in consecutive patients, the only criteria for Px+ and Px testing was tissue availability.
Data were collected on the Px+ end points of Px+DP and Px+FP classification, which were compared with pathologic features of the radical prostatectomy specimen, and the Px end points of PxDP score and PSAR. Statistical analyses were conducted to assess agreement between selected risk groups. Comparison of factors was accomplished by comparing the percentage of instances where risk categorizations by the factors agreed with each other. In addition, a linear correlation analysis in Matlab (Mathworks, Natick, MA) was performed to assess the extent of univariate correlation of the different factors. The correlation coefficient (r value) was calculated with the P value <0.05 used as a measure of statistical significance. An absolute r value of 0 to 0.3 was considered to have a weak correlation, 0.3 to 0.7 a moderate correlation, and 0.7 to 1 a strong correlation.
Results
A total of 53 patients underwent robot-assisted radical prostatectomy for prostate cancer and had both prostate Px+ testing and postoperative Px testing performed. Both the mean and median age for the cohort at the time of biopsy was 60 years (range 43–88 y). Preoperatively, the median PSA level was 5.4 ng/mL (range 1.1–14.91 ng/mL) and the median Gleason sum was 7 (range 6–9). Of the 53 patients, 47.2% had a Gleason sum of 6, 41.5% had a Gleason sum of 7, and 92.5% had a preoperative PSA level ≤10 ng/mL (Table 1). Postoperatively, the median Gleason sum was 7 (range 6–9). Of the 53 patients, there was 1 patient with Gleason sum 6 (1.9%), 47 with Gleason sum 7 (88.7%), 3 with Gleason sum 8 (5.7%), and 2 with Gleason sum 9 (3.8%). There were 2 patients (3.8%) who demonstrated lymph node involvement (LNI), 5 patients (9.4%) with seminal vesicle invasion (SVI), and 14 (26.4%) with evidence of extracapsular extension (ECE) (Table 2).
PSA=prostate-specific antigen.
After patients were stratified into low- and high-risk groups for each respective end point, the percent agreement between Px+ and Px was analyzed (Table 3). The percent agreement between Px+DP and PxDP, Px+DP and PSAR, Px+FP and PxDP, and Px+FP and PSAR was 77%, 87%, 77%, and 79%, respectively. The Px+FP classification was also compared with the postprostatectomy pathology results. The percent agreement between a Px+FP classification of high (high probability of favorable pathology after prostatectomy) and dominant Gleason score ≤3 and Gleason sum ≤6 and ECE was 71.7%, 37.7%, and 60%, respectively. The percent agreement between Px+FP classification and the postoperative pathologic combinations of negative LNI and negative SVI alone; Gleason sum ≤6, negative LN and negative SVI; and Gleason sum ≤6, negative LN, negative SVI and ECE was 70%, 37.7%, and 37.7%, respectively.
Px+DP=preoperative disease progression; PxDP=postoperative disease progression; PxPSAR=postoperative prostate-specific antigen recurrence; Px+FP=preoperative favorable pathology; LN=lymph node; SVI=seminal vesicle invasion; ECE=extracapsular extension.
On univariate analysis, Px+DP score significantly correlated with PxPSAR score (r=0.59, P<0.001), while Px+DP probability significantly correlated with PxPSAR probability (r=0.53, P<0.001) (Table 4). Px+FP probability significantly correlated with both PxDP score and probability (r=−0.35, P=0.01 and r=−0.28, P=0.04, respectively) and PxPSAR score and probability (r=−0.65, P<0.001 and r=−0.56, P<0.001, respectively). Px+FP probability also significantly correlated with the postprostatectomy specimen's dominant Gleason grade ≤3 (r=−0.55, P<0.001), Gleason sum (r=−0.51, P<0.001), and the combination of negative LN and negative SVI (r=−0.37, P=0.006). There was no correlation, however, between Px+FP probability and the combinations of postoperative Gleason sum ≤6, negative LN and SVI, and Px+FP probability and postoperative Gleason sum ≤6, negative LN, SVI, and ECE.
Px+DP=preoperative disease progression; PxDP=postoperative disease progression; PXPSAR=postoperative prostate-specific antigen recurrence; Px+FP=preoperative favorable pathology; LNI=lymph node involvement; SVI=seminal vesicle invasion; LN=lymph node; ECE=extracapsular extension.
Discussion
An accurate assessment of the risk of recurrent disease in the treatment of patients with a diagnosis of PCa remains a challenge for clinicians. Several nomograms have been formulated to predict the probability of disease recurrence for patients who have undergone radical prostatectomy as treatment for PCa. For example, the Kattan postoperative nomogram incorporates a number of prognostic variables, including preoperative serum PSA level and radical prostatectomy pathologic characteristics. 3 There are also several nomograms that are used to predict a patient's postsurgical prognosis at the time of diagnosis. Both the Partin tables and the Kattan preoperative nomogram use preoperative PSA level, clinical stage, and biopsy Gleason score to predict the likelihood of various final pathologic stages at radical prostatectomy. 6 –9 While both preoperative and postoperative prediction tools provide useful predictions of clinical states and outcomes, they rely solely on clinical and pathologic variables to predict biologic behavior. Better tools are still needed to predict an individual patient's probability of disease recurrence, especially at the time of biopsy and before any definitive treatment.
A major advance in the standard practice of tissue-based pathology is the new discipline of systems pathology. 13,14 Systems pathology uses complex computational modeling to combine individual clinical, architectural, and tissue biomarker measurements to predict biologic activity. This concept is similar to that of nomograms currently used that combine multiple variables, such as clinical scenario, PSA level, and Gleason score, for the purpose of prognostication. In addition to these factors, however, systems pathology incorporates molecular markers measured directly from the tissue and uses complex mathematical modeling to predict tumor behavior. Through its integration of molecular and imaging data with the patient's clinical history, the systems pathology approach is positioned to significantly impact biologic discovery processes.
A good predictive model for breast cancer survival has already been produced using this approach. 15 A 70-gene prognosis profile has been identified as a more powerful predictor of outcome in young patients with breast cancer compared with standard systems based on clinical and histologic criteria alone.
For patients with PCa, the systems pathology approach has been used to identify quantitative features associated with PCa progression. This systems pathology approach for PCa, as developed by Aureon Laboratories, has been shown to be predictive of PSAR with high accuracy, as indicated by a concordance index of 0.82. 10 The same predictive test has been shown to be a highly accurate tool for predicting clinical failure (metastasis and/or androgen-independent disease) within 5 years after prostatectomy with a concordance index of 0.84. 11
Currently, the usefulness of such an approach in PCa is controversial despite evidence that the prognostic value for systems pathology in PCa is quite good. Previously published studies evaluating the validity of the systems pathology approach for prostate cancer used compiled databases to train and then validate Px+ and Px individually. 11,12 As such, the conclusions that can be drawn from the studies are based on Px+ and Px as separate entities, when, in fact, to a certain extent there should be a correlation between the two. In other words, if the clinical application of this new technology is to be believed, Px+ testing performed on diagnostic needle biopsies taken from an individual patient should concord, within reason, with postoperative Px testing of the prostatectomy specimen from the same patient.
In the current study, Px+DP and Px+FP classifications and scores agreed favorably with PxDP and PxPSAR in almost every combination—approximately 70% to 87%. Px+FP classification, however, had poor agreement with Gleason sum and combinations that included Gleason sum (38%). This is likely because of the high pathologic upstaging rate. Px+FP class is designed to predict a Gleason sum of ≤6. The Gleason sum is provided by the institution and not by Aureon. In the current study, 96% of patients who had an original diagnosis with Gleason 6 on biopsy were upgraded to Gleason 7 after RALP, a rate 2.5 fold greater than the expected undergrading rate of 38%. 16 The aberrantly high upstaging rate significantly decreased the percent agreement rate.
Interestingly, the Px+FP score, which is a continuous variable, maintained significance with moderate correlation with both Gleason sum (r=−0.51, P<0.001) and dominant Gleason grade (r=−0.55, P<0.001), suggesting that while the class designation itself agreed poorly, the overall correlation remains strong in that a lower Px+FP probability continues to predict higher Gleason grades.
Correlation between the remaining Px+ end points and the Px end points faired equally as well with moderate r values (0.28–0.65) that retained a high degree of significance. These results are quite promising and suggest a certain degree of precision for both tests. The question of accuracy and long-term predictability of systems pathology in PCa remains unanswered, however.
There are several limitations that deserve mention. The first is the relatively small cohort size of the current study. Despite being a high-volume PCa center, many of the patients seen at our facility received a diagnosis of PCa at an outside facility. As such, specimens were not readily available for Px+ testing. In addition, routine use of Px+ and Px testing in the same patient is a relatively new concept dating back less than 1 year, and our experience is therefore somewhat limited. A second limitation is the lack of long-term data available on the cohort. Although it can be argued that long-term data are beyond the scope of the current study, it would be interesting to confirm the findings in the validation study in a prospective cohort in which both preoperative Px+ and Px testing was performed. The high upgrading rate significantly skewed agreement rates. Because the Gleason score is provided by the institution, this may indicate either a particularly high-risk population attended to at our facility or a demonstration in the subjective nature of Gleason grading. A larger, multi-institutional study may temper this effect and provide a more accurate assessment of the agreement rates.
Conclusions
The percent agreement between Px+ and Px testing end points for radical prostatectomy patients was very good. Furthermore, there was a direct correlation between most Px+ and Px end points. While the Px+FP classification and Gleason sum demonstrated a poor percent agreement, Px+FP score still maintained a direct correlation to prostatectomy Gleason sum. Overall, the results demonstrate that these two independent systems-based models for PCa provide strong cross-model agreement and demonstrate significant correlation with clinical end points. Further testing with a large cohort including long–term studies is warranted.
Disclosure Statement
Michael J. Donovan, Faisal M. Khan, and Qiuhua Liu are employees of Aureon Biosciences. For the remaining authors, no competing financial interests exist.