
Abstract
Purpose:
To investigate the utility and limitations of stone surface area (SA) as a predictor of stone-free (SF) status after a single semirigid ureteroscopy (URS), with or without a flexible component, for the treatment of patients with urinary stones.
Patients and Methods:
Cases of patients with urinary stones treated by combined URS with holmium laser lithotripsy at a single institute were retrospectively evaluated. Correlations of possible predictors with SF status were analyzed using a logistic regression model. Two types of SA were measured: “Traced stone surface area” (tSA) and “calculated stone surface area” (cSA).
Results:
According to the univariate analysis, the following variables were significantly associated with non-SF status: Stone number (P<0.001), ureteral stone location (P=0.045), presence of renal stones (P<0.001), tSA (P<0.001), cSA (P<0.001), stone volume (P<0.001), and operator experience (P=0.02). According to multivariate analysis, stone volume (P=0.016) was an independent predictor of SF status. The scatter diagrams for tSA and cSA showed strong correlations between these parameters, and Spearman ρ was 0.975.
Conclusions:
Stone volume and SA were highly indicative of stone status after single semirigid URS, with or without a flexible component. The formula for cSA, maximum diameter×width×π×1/4, was demonstrated to accurately represent SA in this study. SA, however, indicated a lower clinical priority and utility as a predictor of stone status than stone volume. The combination of semirigid and flexible URS could access any ureteral stones, including those that semirigid URS alone could not treat. The cutoff points for these predictors of outcome were 110.0 mm2 for cSA, 125.0 mm2 for tSA, and 840.0 mm3 for stone volume.
Introduction
Radiologic images are most important to the preoperative assessment of stone status. The efficacy of extracorporeal shockwave lithotripsy (SWL), URS, and percutaneous nephrolithotripsy are highly dependent on stone burden determined from these images. 1 –7 Advanced CT has turned out to be a more reliable tool because it can determine the stone morphology and composition. 8 –11 These innovations improve surgical outcomes and help us recommend to patients appropriate treatment methods.
Many previous reports have shown that plain radiography offers less potential than CT for the measurement of stone size. 12 –14 We previously examined the priority and utility of three parameters of renal stone burden (cumulative stone diameter [CSD], stone surface area [SA], and volume) at flexible URS and found that stone volume obtained by noncontrast CT (NCCT) and CSD obtained by kidneys-ureters-bladder (KUB) radiography were significantly and independently predictive of stone status after URS. 15 By contrast, SA was an inferior predictor of URS outcome compared with CSD and stone volume. 15
In clinical practice, however, SA obtained from plain radiography has often been used as a predictor of success rate of stone treatment. 16 –18 Moreover, our clinical impression indicated that SA is still a useful predictor of URS outcome in clinical practice. The characteristics and potential of SA have yet to be investigated in detail, however. In this retrospective study, we evaluated the potentials and limitations of SA as a possible predictor of SF status after a single combined URS for the treatment of patients with urinary stones.
Patients and Methods
Patients
The 256 procedures using a combined ureteroscope for management of urinary stones performed between November 2009 and December 2011 were retrospectively analyzed. We excluded 69 of 256 procedures from the study because of staghorn stones, sponge kidney, or unclear KUB films. The remaining 187 eligible procedures consisted of 167 first-time URS, 16 second URS, and 4 third URS. Second and third URS were performed within 3 to 6 months of the previous URS. The indications for treatment of urinary stones in our hospital are described in our previous reports. 15,19 In brief, we offered all patients URS as a first- or second-line treatment. For renal stones >20 mm diameter, percutaneous nephrolithotripsy was recommend as a first-line treatment. The patients made the final choice of treatment in all cases.
This study was approved by the Institutional Ethics Committee of Ohguchi East General Hospital. We obtained written informed consent from all patients for their data to be used for research purposes.
Technique
Our surgical technique and strategies were well-described in our previous reports. 15,19 Briefly, we passed a 6/7.5F or 8/9.8F semirigid ureteroscope (Wolf™, Knittlingen, Germany) over a guidewire with fluoroscopic guidance. For distal ureteral stones, lithotripsy was then performed with 550-μm holmium laser fibers without an access sheath. If proximal or pushed-up stones were identified, a ureteral access sheath (12/14F or 14/16F, Cook Medical, Bloomington, IN or 11/13F or 13/15F, Boston Scientific, Natick, MA) was placed, and lithotripsy was performed in the same manner as for proximal stones. For renal and ureteral stones that were difficult to treat using a semirigid ureteroscope because of a restricted angle of access or deflection, we used a flexible ureteroscope (Flex-X2,™ Storz, Tuttlingen, Germany or Olympus P-5,™ Olympus, Tokyo, Japan) with 200- to 365-μm holmium laser lithotripsy. In all procedures, we used a 1.9-F zero-tip nitinol stone basket (Boston Scientific) or a 1.5-F N-Circle nitinol tipless basket (Cook Medical). If operation duration exceeded 120 minutes, we decided to stop procedures to minimize perioperative complications. These strategies for URS were not different between first-time and more than second URS.
Clinical and imaging assessments
We performed plain KUB radiography on postoperative day (POD) 1 and at postoperative month (POM) 3 to determine the stone status. The outcome was defined by stone status on KUB films as follows: Having no detectable stones (stone free, “SF”), residual stone fragments ≤4 mm (“residual fragments”), and residual stone >4 mm diameter (“treatment failure”). The first two classifications were defined as efficient outcomes (EO).
Preoperative factors analyzed included SA (mm2), stone volume (mm3), stone number, stone side (right or left), age, sex, body mass index (BMI), presence of hydronephrosis (including even partial hydronephrosis), stone-related complications, placement of ureteral stent, presence of renal stones, and location of the ureteral stone. Two types of SA were measured on plain KUB radiography: The “traced stone surface area” (tSA), which was determined by making a digitizing trace of the stone edge with digital free-hand calipers (SYNAPSE-PACS Software Program System, Fujifilm, Tokyo, Japan), and the “calculated stone surface area” (cSA), which was calculated using the following formula
17,18
:
We obtained the stone volume utilizing 5-mm axial and 3.5-mm reconstructed coronal NCCT. The following formula was used to calculate stone volume
15,19
:
We used digital calipers to determine stone diameter on KUB and three-dimensional (3D) information on NCCT. 8 The number of stones, presence of hydronephrosis, stone-related complications, location of the ureteral stones, and presence of renal stones were also evaluated by preoperative NCCT. For second and third URS, all of these parameters were reevaluated before the repeated procedure.
In all procedures, the same urologist (H.I.) did stone status judgment and measurement/calculation of two parameters of stone burden.
Statistical analysis
Data were analyzed using the SPSS software package (SPSS, Chicago, IL). First, to validate the formula for cSA, the correlation between tSA and cSA was analyzed using a scatter diagram and Spearman rank-correlation coefficient test (ρ). The relationship between SF status and each of the factors, including SA and stone volume, was then analyzed using the values for the area under the receiver operating characteristics (AUROC) curve and a logistic regression model.
BMI and patient age were treated as continuous variables. The number of stones was divided into two groups: Solitary stones and ≥2 stones. The cutoff points used for categorizing tSA, cSA, and stone volume were set depending on the highest value of both sensitivity and specificity in the ROC curve, using SF status on POD 1. Stone location was categorized into two groups: Proximal+middle and distal ureteral stones. In cases of multiple stones, location of the largest stone in diameter was used to categorize the location. There were six urologists as the operators, and we divided equally into inexperienced (<10 years of experience) and experienced (≥10 years of experience) urologists.
We used a logistic regression model to do univariate and multivariate assessment. All variables associated with univariate P<0.05 were included in the multivariate model. In all statistical tests, P<0.05 was considered significant.
Results
Patient characteristics and surgical outcome
Of the187 eligible procedures, 146 and 41 were performed under general anesthesia and spinal anesthesia, respectively. We used a ureteral sheath in 172 of the 187 procedures. Semirigid URS with lithotripsy alone was performed in 80 procedures; the other 107 procedures involved both semirigid and flexible URS with lithotripsy.
Table 1 shows a comparison of the backgrounds of the patients and the treatment outcomes according to stone status on POD1. Significant differences were revealed between the SF and non-SF group in the following parameters: Stone number (P<0.001), ureteral stone location (P=0.013), presence of renal stones (P<0.001), tSA (P<0.001), cSA (P<0.001), volume (P<0.001), duration of procedure (P=0.005), amount of laser use (P<0.001), and operator experience (P=0.028). Necessity of using an access sheath (P=0.056) showed no significant differences.
Mann-Whitney U test, bchi-square test.
SF=stone free; POD=postoperative day; BMI=body mass index; SWL=shockwave lithotripsy.
High-grade fever occurred in 11 patients. We treated all patients conservatively (Clavien classification, grade II). Ureteral stricture occurred in four patients. In these 4 cases, no obvious perioperative problems were identified. Balloon dilation of the ureter was performed in all four cases and resulted in successful outcomes in two patients (Clavien classification, grade III). Unfortunately, in the remaining two patients, balloon dilation of the ureter failed, and placement of permanent Double-J stents was performed (Clavien classification, grade III).
Correlation among three parameters of stone burden
The scatter diagrams for tSA and cSA in Figure 1A show a strong correlation between these parameters. Spearman ρ was 0.975.
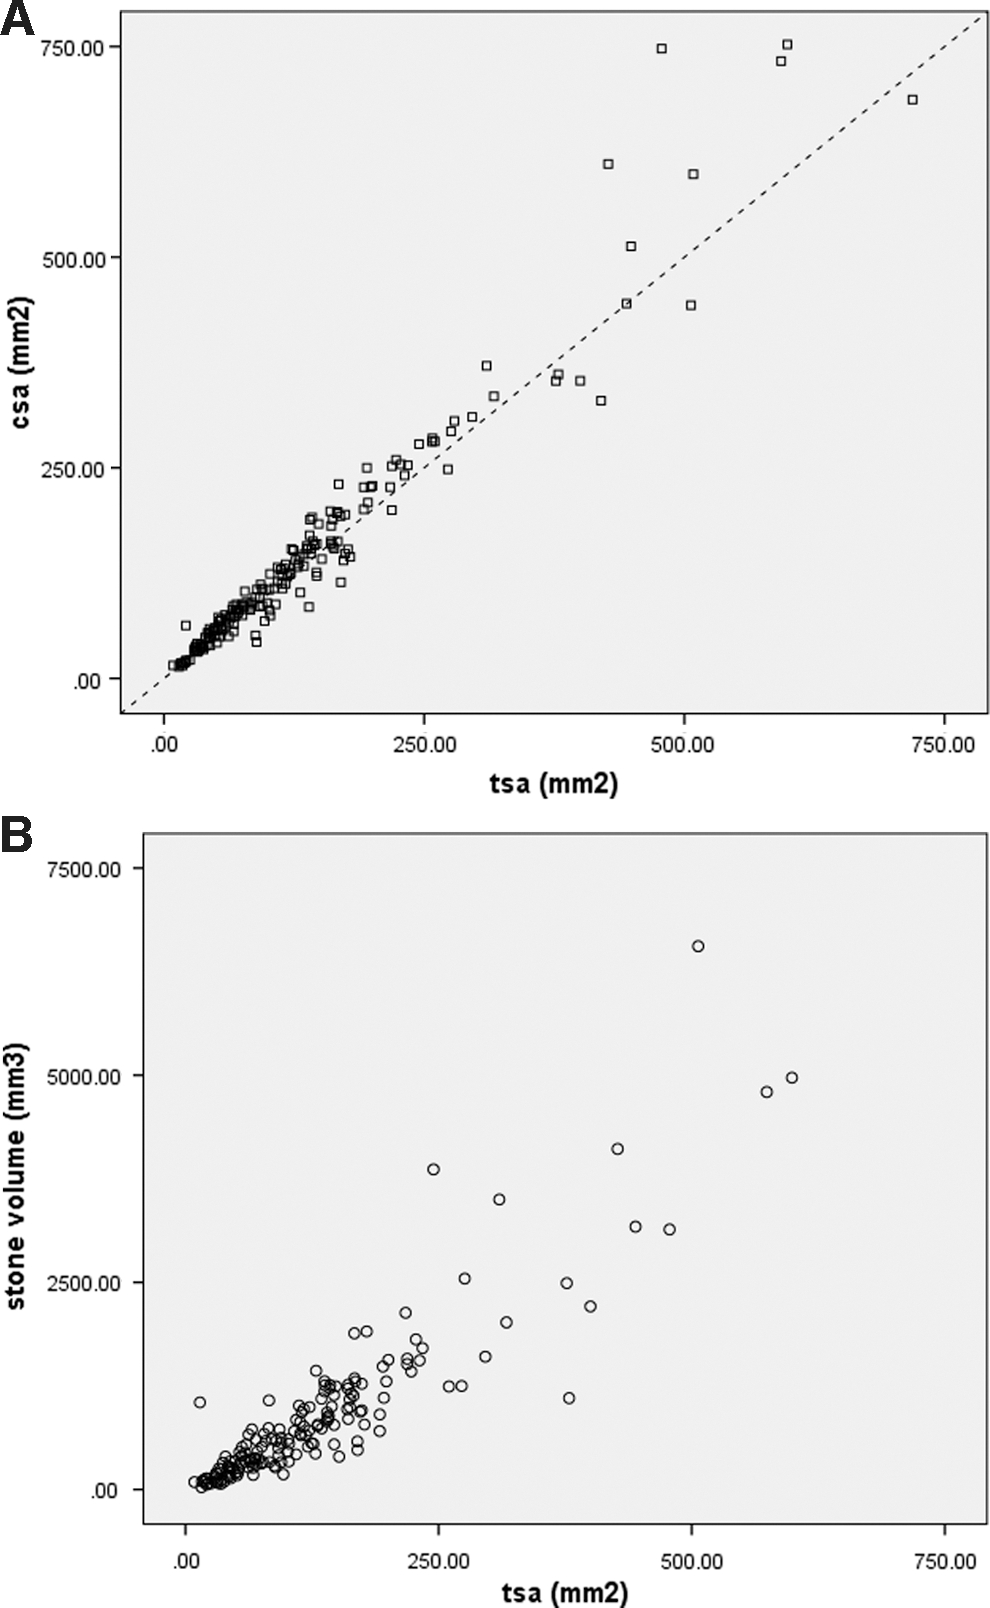
The scatter diagrams for tSA and stone volume are shown in Figure 1B. Spearman's ρ was 0.907.
Determination of cutoff points for stone burden
The values for the AUROC curve 20 of tSA, cSA, volume, and stone number are shown in Figure 2A. We set four end points: SF at POD 1 and POM 3, and EO at PODv1 and POMv3. All three parameters of stone burden were highly indicative of each of the endvpoints (Fig. 2A).
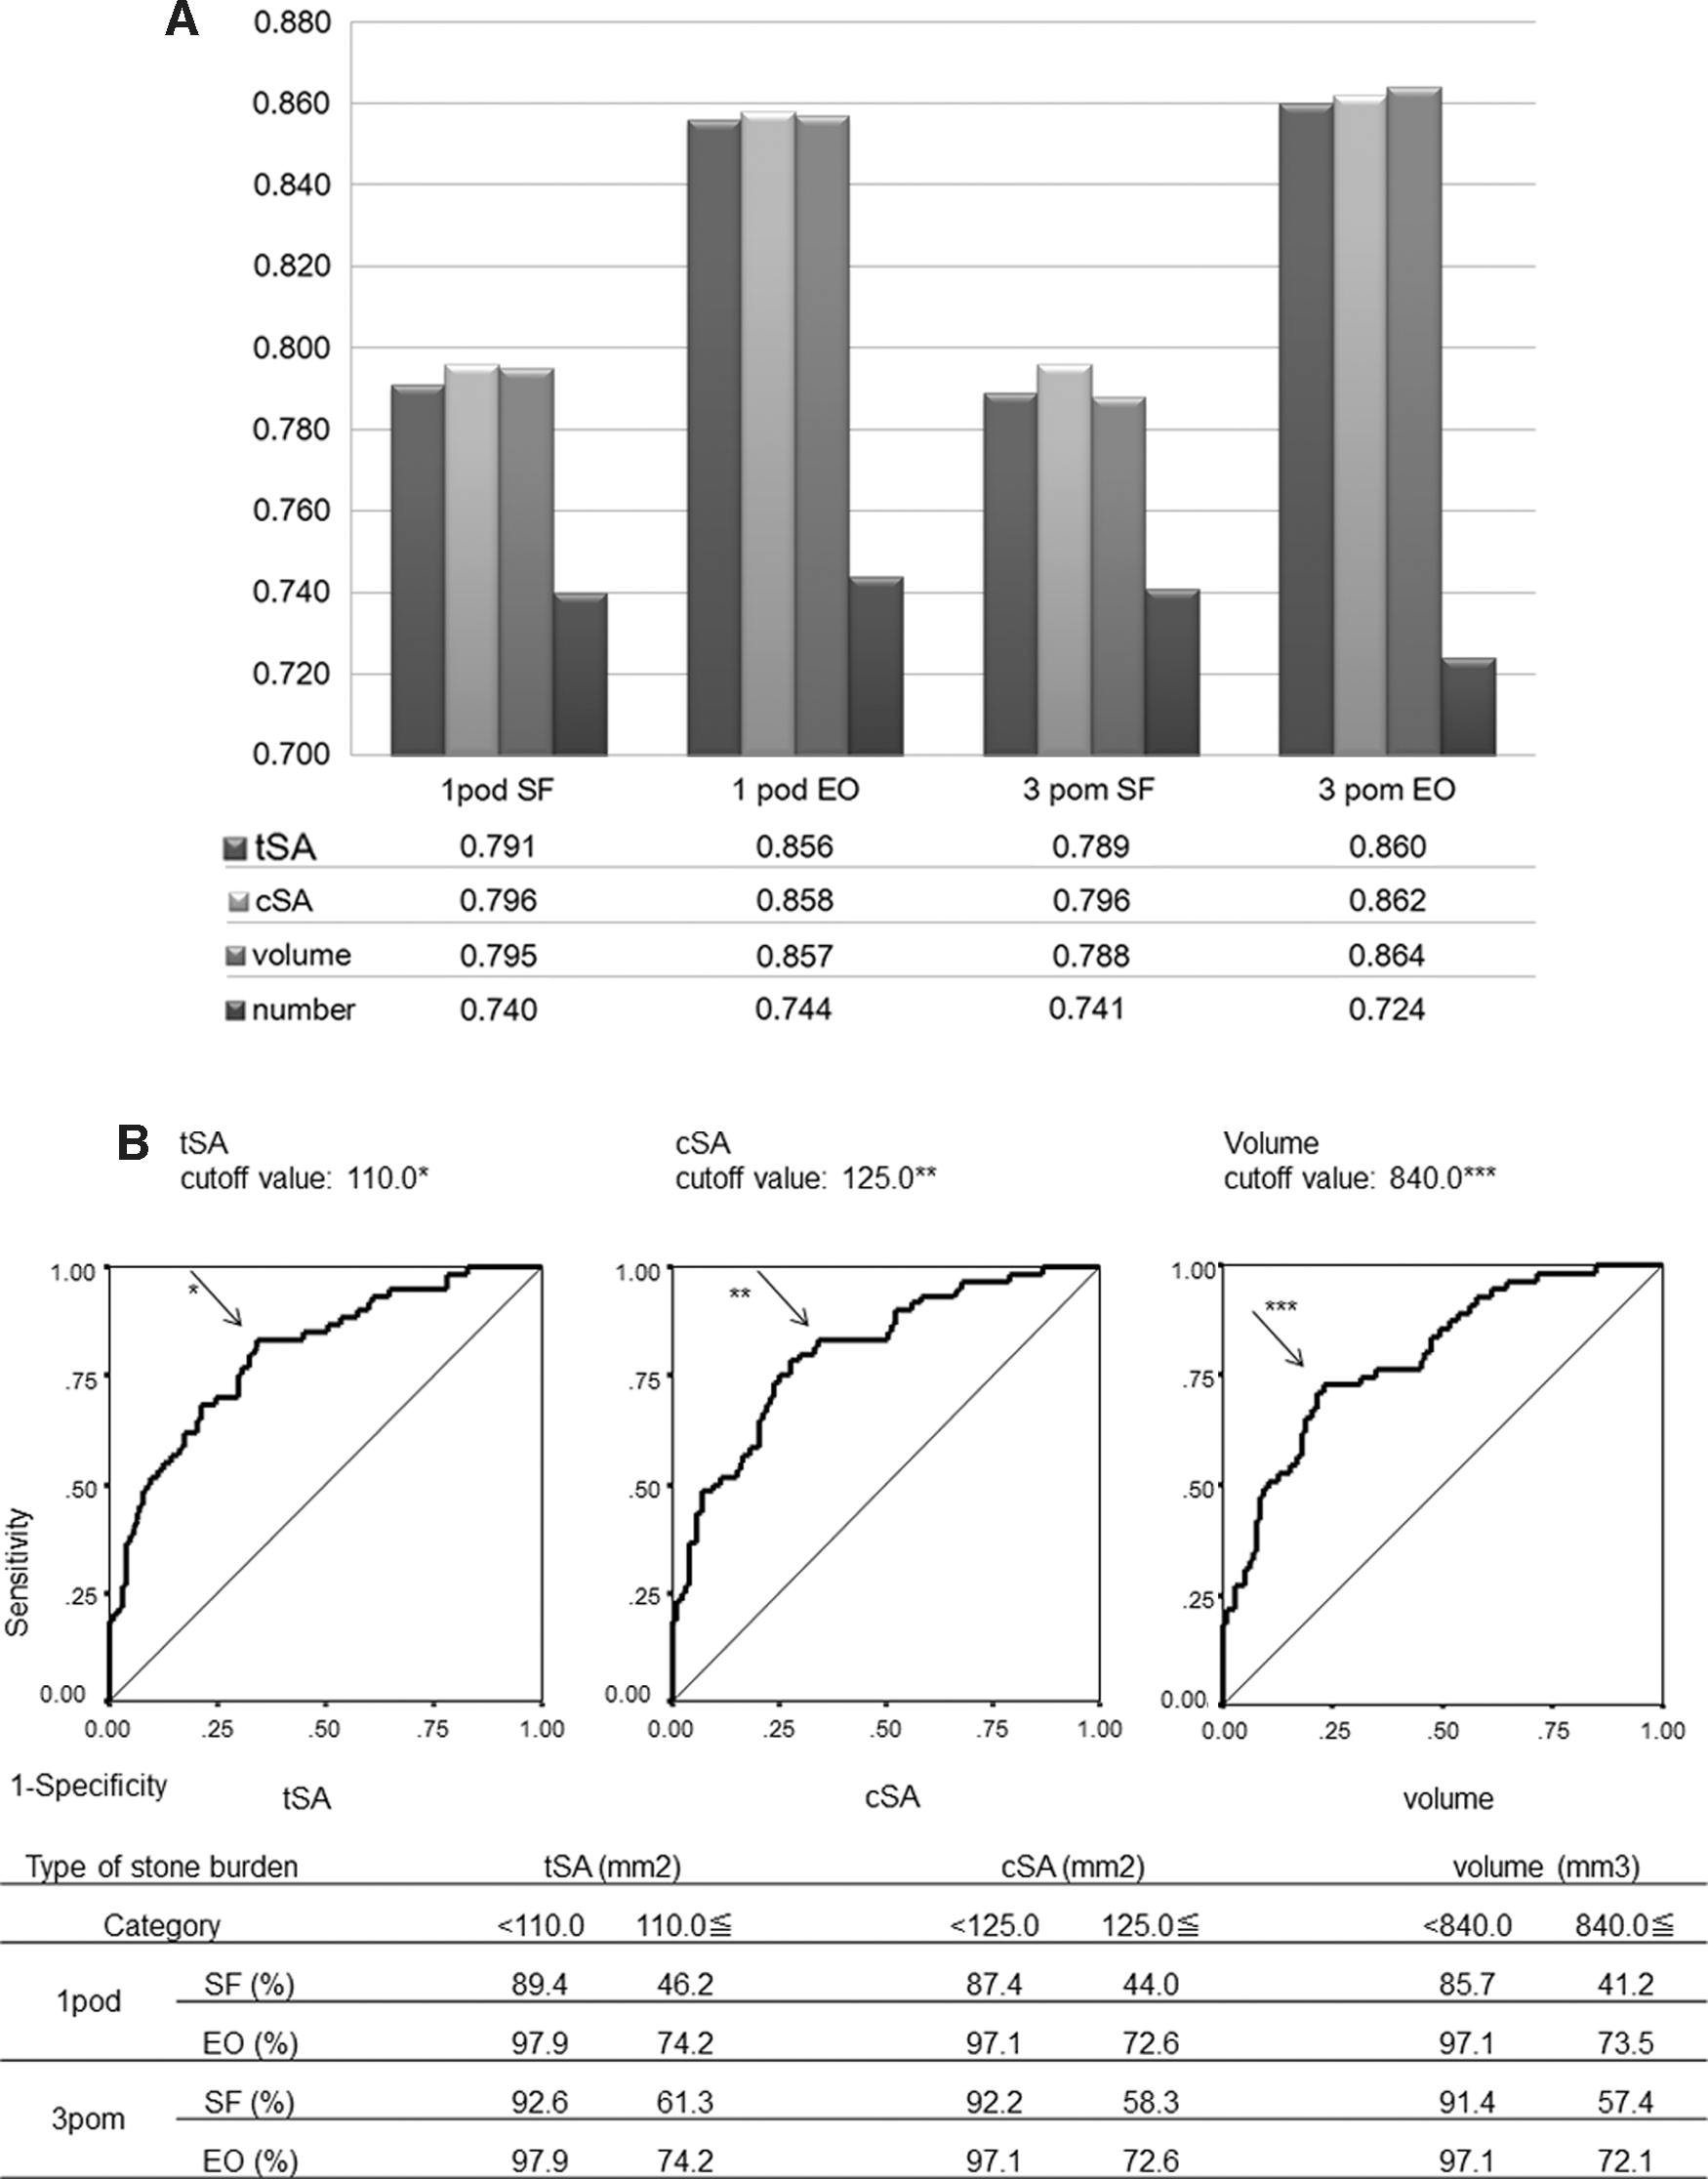
Figure 2B shows the ROC curves for SF status on POD 1. The ROC curves for tSA, cSA, and volume showed one peak and the respective cutoff points were at 110 mm2, 125 mm2, and 840 mm3. Figure 2B also shows the outcome of URS defined by these cutoff points.
Univariate analysis of outcome predictors
Our univariate assessment showed that the following parameters were significantly associated with non-SF at POD 1 (P<0.05): Stone number (P<0.001), ureteral stone location (P=0.045), presence of renal stones (P<0.001), tSA (P<0.001), cSA (P<0.001), stone volume (P<0.001), and operator experience (P=0.02) (Table 2). BMI (P=0.884), necessity of using an access sheath and flexible ureteroscope (P=0.058 and 0.074, respectively), preoperative presence of hydronephrosis (P=0.504), and stent placement (P=0.203) had no significant influence on SF status (Table 2).
HR=hazard ratio; CI=confidence interval; BMI=body mass index; SWL=shockwave lithotripsy.
Multivariate analysis of outcome predictors
In logistic regression, we had to avoid explanatory variables that had high correlation with one another because this would prevent accurate analysis. 21 Accordingly, cSA was excluded from the multivariate analysis, because this parameter would show a strong correlation with tSA (Fig. 1A). Stone volume (P=0.016) was found to be an independent predictor of SF status (Table 2). The tSA parameter (P=0.237) indicated a lower clinical priority and utility as a predictor of the status of stone after URS than stone volume (Table 2).
Discussion
This study focused on the priority and utility of SA for the management of urinary stones with semirigid URS, with or without a flexible component. Our results show that stone volume was significantly associated with the success rate of URS. Although SA was inferior to stone volume as a predictor of URS outcome, the analysis of AUROC and correlation between stone volume and SA showed that SA was highly indicative of stone status after URS. In addition, Equation (1) was demonstrated to accurately represent SA in this study.
Based on the AUROC curve analysis, the indicators of tSA, cSA, and volume had a higher sensitivity and specificity than stone number (Fig. 2A). These findings indicate that stone burden has a greater potential for predicting stone status after URS than other stone parameters.
When comparing stone volume and SA, stone volume showed greater potential for predicting surgical outcome. In this study, the dimensions for Equation (2) were obtained from a 3D digital image of the stones obtained by NCCT. We have shown that this formula accurately estimates urinary stone volume (Table 2). 15 This result demonstrates that we may be able to calculate stone volume using only NCCT, even with thick slices, in clinical practice and thus reduce the need for recent innovative CT procedures 8 –11 to evaluate stone volume.
Although SA was inferior to stone volume as a predictor of URS outcome (Table 2), Figures 1B and 2A still demonstrated that SA was highly indicative of stone status. In fact, SA is a well-established indicator and is used frequently in clinical practice to evaluate stone status. 16 –18 Notably, this stone parameter can be determined on KUB radiography, which is easier and cheaper to perform and exposes the patient to less radiation than a CT scan.
In clinical practice, cSA is a more useful parameter than tSA; it can be calculated more easily, because it does not need a digitizing trace of the stone edges. Equation (1), the most widely used formula for determining cSA, has not, however, been validated for measurement of this parameter. Therefore, in this study, we evaluated the validity of cSA by comparing it with tSA. The scatter diagram for the two parameters (Fig. 1A) and Spearman ρ indicated a strong correlation between them, and this result validates Equation (1) as a measure of SA. In addition, Fig. 1A showed that cSA was bigger than tSA using a diagonal line (y=x) as a reference. Moreover, Fig. 2A revealed that the cutoff point for cSA is larger than that for tSA. These findings indicate that cSA might slightly overestimate SA compared with tSA. These small differences between the two SA methods, however, were not associated with significantly different abilities to predict surgical outcomes (Tables 1 and 2, Fig. 2A).
As often reported, there is a significant difference in the outcome of semirigid URS between proximal ureteral stones and distal ureteral stones. 17,21 –23 Our multivariate logistic regression analysis, however, did not reveal the impact of stone location on SF status (Table 2) probably because combined semirigid and flexible URS was able to treat any ureteral stones that semirigid URS alone could not reach, whereas with regard to renal stone location, the probability of treatment failure was higher for lower pole stones (Table 1). This is consistent with some previous studies. 24,25 Treatment failure for lower pole stones is attributable to the failure of fragments to clear from this site and difficulty associated with retrograde ureteroscopic access to this location. 24,25 In the future, to evaluate the efficacy and limitation of this combined URS, comparisons of URS outcome and surgical complications with other URS alone will be necessary.
In this study, we found that using one cutoff point for stone volume and SA was most effective for predicting URS outcome. These were: tSA, 110.0 mm2; cSA, 125.0 mm2; and stone volume, 840 mm3. These cutoff points proved appropriate, because they provided significant predictors of SF and EO rates for each stage of URS procedure (Table 2B). In this study, we had inherent limitations. The design of this study was retrospective, and there were nonblinded radiologic interpretations. To try to minimize the measurement bias and confounding factors, we included procedures conducted by a large number of urologists that could influence outcome. Another limitation of the study was that these data were from only a single institution.
Conclusions
Stone volume and SA were highly indicative of stone status after single semirigid URS, with or without a flexible component. The formula for cSA—that is, maximum stone diameter×width×π×¼—was demonstrated to accurately represent SA in this study. This finding provided clinicians with a significant advantage, because cSA is easier to perform and calculate than tSA in clinical practice, because it does not need a digitizing trace of the stone edges. SA, however, showed a lower clinical priority and utility as a predictor of surgical outcome than stone volume. The combination of semirigid and flexible URS could access any ureteral stones, including those that semirigid URS alone could not treat. The cutoff points for these predictors of outcome were 110.0 mm2 for cSA, 125.0 mm2 for tSA, and 840.0 mm3 for stone volume.
Footnotes
Acknowledgments
Each author had participated sufficiently in the work of the study.
Disclosure Statement
No competing financial interests exist.