
Abstract
Introduction:
Nephrolithiasis in the United States has been on the rise during the past several decades. Temperature has been shown to directly correlate with increased stone disease. We examine the association between climactic factors and monthly urolithiasis presentation rates for 6 years at a single institution in New York City.
Methods:
Emergency department (ED) data on patient visitations were collected along with patient demographics. Meteorological data were collected using the website “Weather Underground” (
Results:
The total number of renal colic visits to the hospital's ED from January 2007 through December 2012 tallied 3647 visits. The lowest average monthly rate per 1000 ED visits occurred in the month of February (28.8) and the highest in the month of August (43.8). There was a strong correlation between monthly presentation rate and temperature (P<0.01) and relative humidity (P=0.06) but no correlation with precipitation and sea level pressure. On multivariate ARIMA analysis, only average monthly temperature was significantly associated with monthly urinary calculi presentation rate among all comers (P<0.01). The crude correlations held true for both sexes with respect to temperature but not for females in regard to relative humidity. The age groups of 21 to 44 and 45 to 64 had a rate correlation with temperature and all races correlated with temperature, but only Caucasians had a weak correlation with relative humidity.
Conclusions:
This is the first study examining the role of climate on stone presentation rate in a large city above the Southern “stone belt” states. Temperature has a strong correlation with calculi presentation rate, and relative humidity has a trend toward overall calculi presentation rate.
Introduction
N
Seasonal variations in urolithiasis were first investigated in 1960, 6 establishing that temperature and sunlight exposure, but not humidity, directly correlated with increased stone disease. Later studies corroborated this relationship proving that the highest incidence of stone disease occurred in the summer months, when temperature and sunlight exposure were at their maximum. Chen and associates 7 recently investigated additional climactic factors, including atmospheric pressures, and calculated that temperature had the greatest effect on kidney stone presentation rates.
Although several studies have examined the role of meteorologic factors on stone formation and presentation, no study has examined the role of these factors on renal stone colic within the largest United States city. Here we examine the association between meteorologic parameters (temperature, relative humidity, sea level pressure, and precipitation) and monthly urolithiasis presentation rates for 6 years, among various populations and demographics of patients, at a single institution in New York City. The results of this study may help clinicians and researchers predict the rates of stone formation in any given month based on future weather patterns.
Methods
Institutional Review Board approval was gained before the commencement of this study. A retrospective review of data was collected from the ED's electronic database at a 1083 bed academic urban hospital in the borough of Manhattan, New York City. ED visits were tallied between January 2007 to December 2012 using two International Classification of Diseases-9(ICD-9-CM) codes (592.0 and 788.0) corresponding to calculi diagnoses. These two codes were used as the original codes used at our institution to assign a diagnosis of calculi, despite several other codes present in the ICD-9-CM classification system. Inclusion criteria were restricted to only patients diagnosed with these ICD-9-CM codes. There were no specific exclusion criteria.
Patient demographics including sex, age, and race were collected and the data was pooled by monthly presentation. Ages were grouped from age 21 to 44 years, 45 to 64 years, and 65 years and above. These age groups were specifically chosen to contrast with the study by Chen and colleagues 7 in Taiwan. Race was stratified based on the patient's response during the initial intake survey into the following categories: Asian, African American, Hispanic, Caucasian, or Other, which includes a response of unknown. The patient's disposition was recorded as admittance to an inpatient floor or discharge home after initial treatment in the ED. The population of the persons who reside in the closest neighborhoods to the hospital was obtained using the U.S. Census Bureau 2010 report and grouped by race.
Meteorologic data were collected using the website “Weather Underground” (
The rate of renal colic per 1000 ED presentations was calculated and organized by rate of patient age, sex, race, and admissions per month in accordance with the four meteorologic points for each month. The data for each of the 72 months were pooled by month with averages calculated for each of the epidemiologic variables and the four meteorologic factors.
Crude frequency of overall ED visits by year and ED visits for urolithiasis by age group, sex, and race were calculated. Stone presentation rates and meteorologic factors were summarized by mean, standard deviation, minimal, and maximal values. Pearson product-moment was used to analyze the correlations between meteorologic factors and ED presentations by month among all comers and stratified by age group, race, and sex. A plot of monthly calculi rates per 1000 ED admissions by age group and sex was used to identify seasonality. An autoregressive integrated moving average (ARIMA) model was used to analyze the effects of multivariable meteorologic factors on ED visits, adjusting for time trend effect among all comers and stratified by age group, race, and sex. A plot was formulated to depict the correlation of average monthly stone presentation rates and average monthly temperature. All statistical analyses were two-tailed and performed using SAS (SAS Institute, Cary, NC) and Stata 11.2 (StataCorp, College Station, TX). A P value of 0.05 was chosen to indicate statistical significance.
Results
The total number of urolithiasis colic visits to the hospital's ED from January 2007 through December 2012 tallied 3647 visits. The number of visits per year was 424 in 2007, 530 in 2008, 486 in 2009, 689 in 2010, 741 in 2011, and 775 in 2012. The total number of visits to the ED rose every year from 79,612 in 2007 to 116,627 in 2012, in part because of the 2010 closing of a 758 bed teaching hospital in close proximity. Data obtained from the U.S. Census Bureau 2010 allowed for estimation of the races of the population living in the neighborhoods in closest proximity to the hospital. Caucasians made up 33.3% of the population, African Americans 22.8%, Hispanics 28.6%, Asians 12.6%, and other 2.8%. The monthly rate per 1000 ED visits across the entire study period was a low of 28.8 in February to a high of 43.8 in August. The highest overall monthly presentation rate was seen in August 2011.
The percentage of male and female patients who presented with stones during our study period was 63% (2290) and 37% (1355), respectively. The age group 21 to 44 years old comprised 50% (1819) of stone patients, age 45 to 64 years old made up 42% (1524) of patients, and those age >65 years made up the remaining 8% (302). By race, Asians comprised 3.4% (122) of patients presenting with a stone, Hispanics 31.4% (1143), Caucasians 61% (2226), and African Americans the remaining 5.2% (154). Approximately 14% of all patients presenting with a stone were admitted as inpatients, and the remaining 86% were discharged from the ED. The overall average yearly stone presentation rate was calculated per 1000 ED visits. These average stone presentation rates for the year are shown in Table 1 with corresponding averages and deviations for sex, age groups, and the four monthly meteorologic factors.
Total stone presentations are totals averaged per month; **stone rates are represented as a calculation per 1000 emergency department admissions, presented by month.
SD=standard deviation.
All rates presented below are stone presentation rates to the ED, not total ED presentations for nonstone related causes. The average yearly stone rate in men was 45.7 and in women, 26.9. Specifically, the male stone presentation rate varied from a low of 39.8 in 2009 to a high of 49.9 in 2010 and in females, the rate varied from a low of 21.0 in 2007 to a high of 29.7 in 2010. For the age groups, the average yearly stone rate in the 21 to 44 years group, 45 to 64 years group, and in the 65 years and older group was 36.2, 30.4, and 6.0, respectively. The mean yearly stone rate in Asians, Hispanics, African Americans, and Caucasians was 2.4, 22.6, 3.1, and 44.6, respectively.
The mean monthly temperature over the study period was 56.1°F (standard deviation [SD]±15.7°F) with an average monthly stone rate of 6.09 presentations (SD±0.70 presentations). Figure 1 visually demonstrates the correlation between average stone presentation rates and temperature, with the highest rates and temperature both seen between the months of July and August and the lowest between the months of January and February.
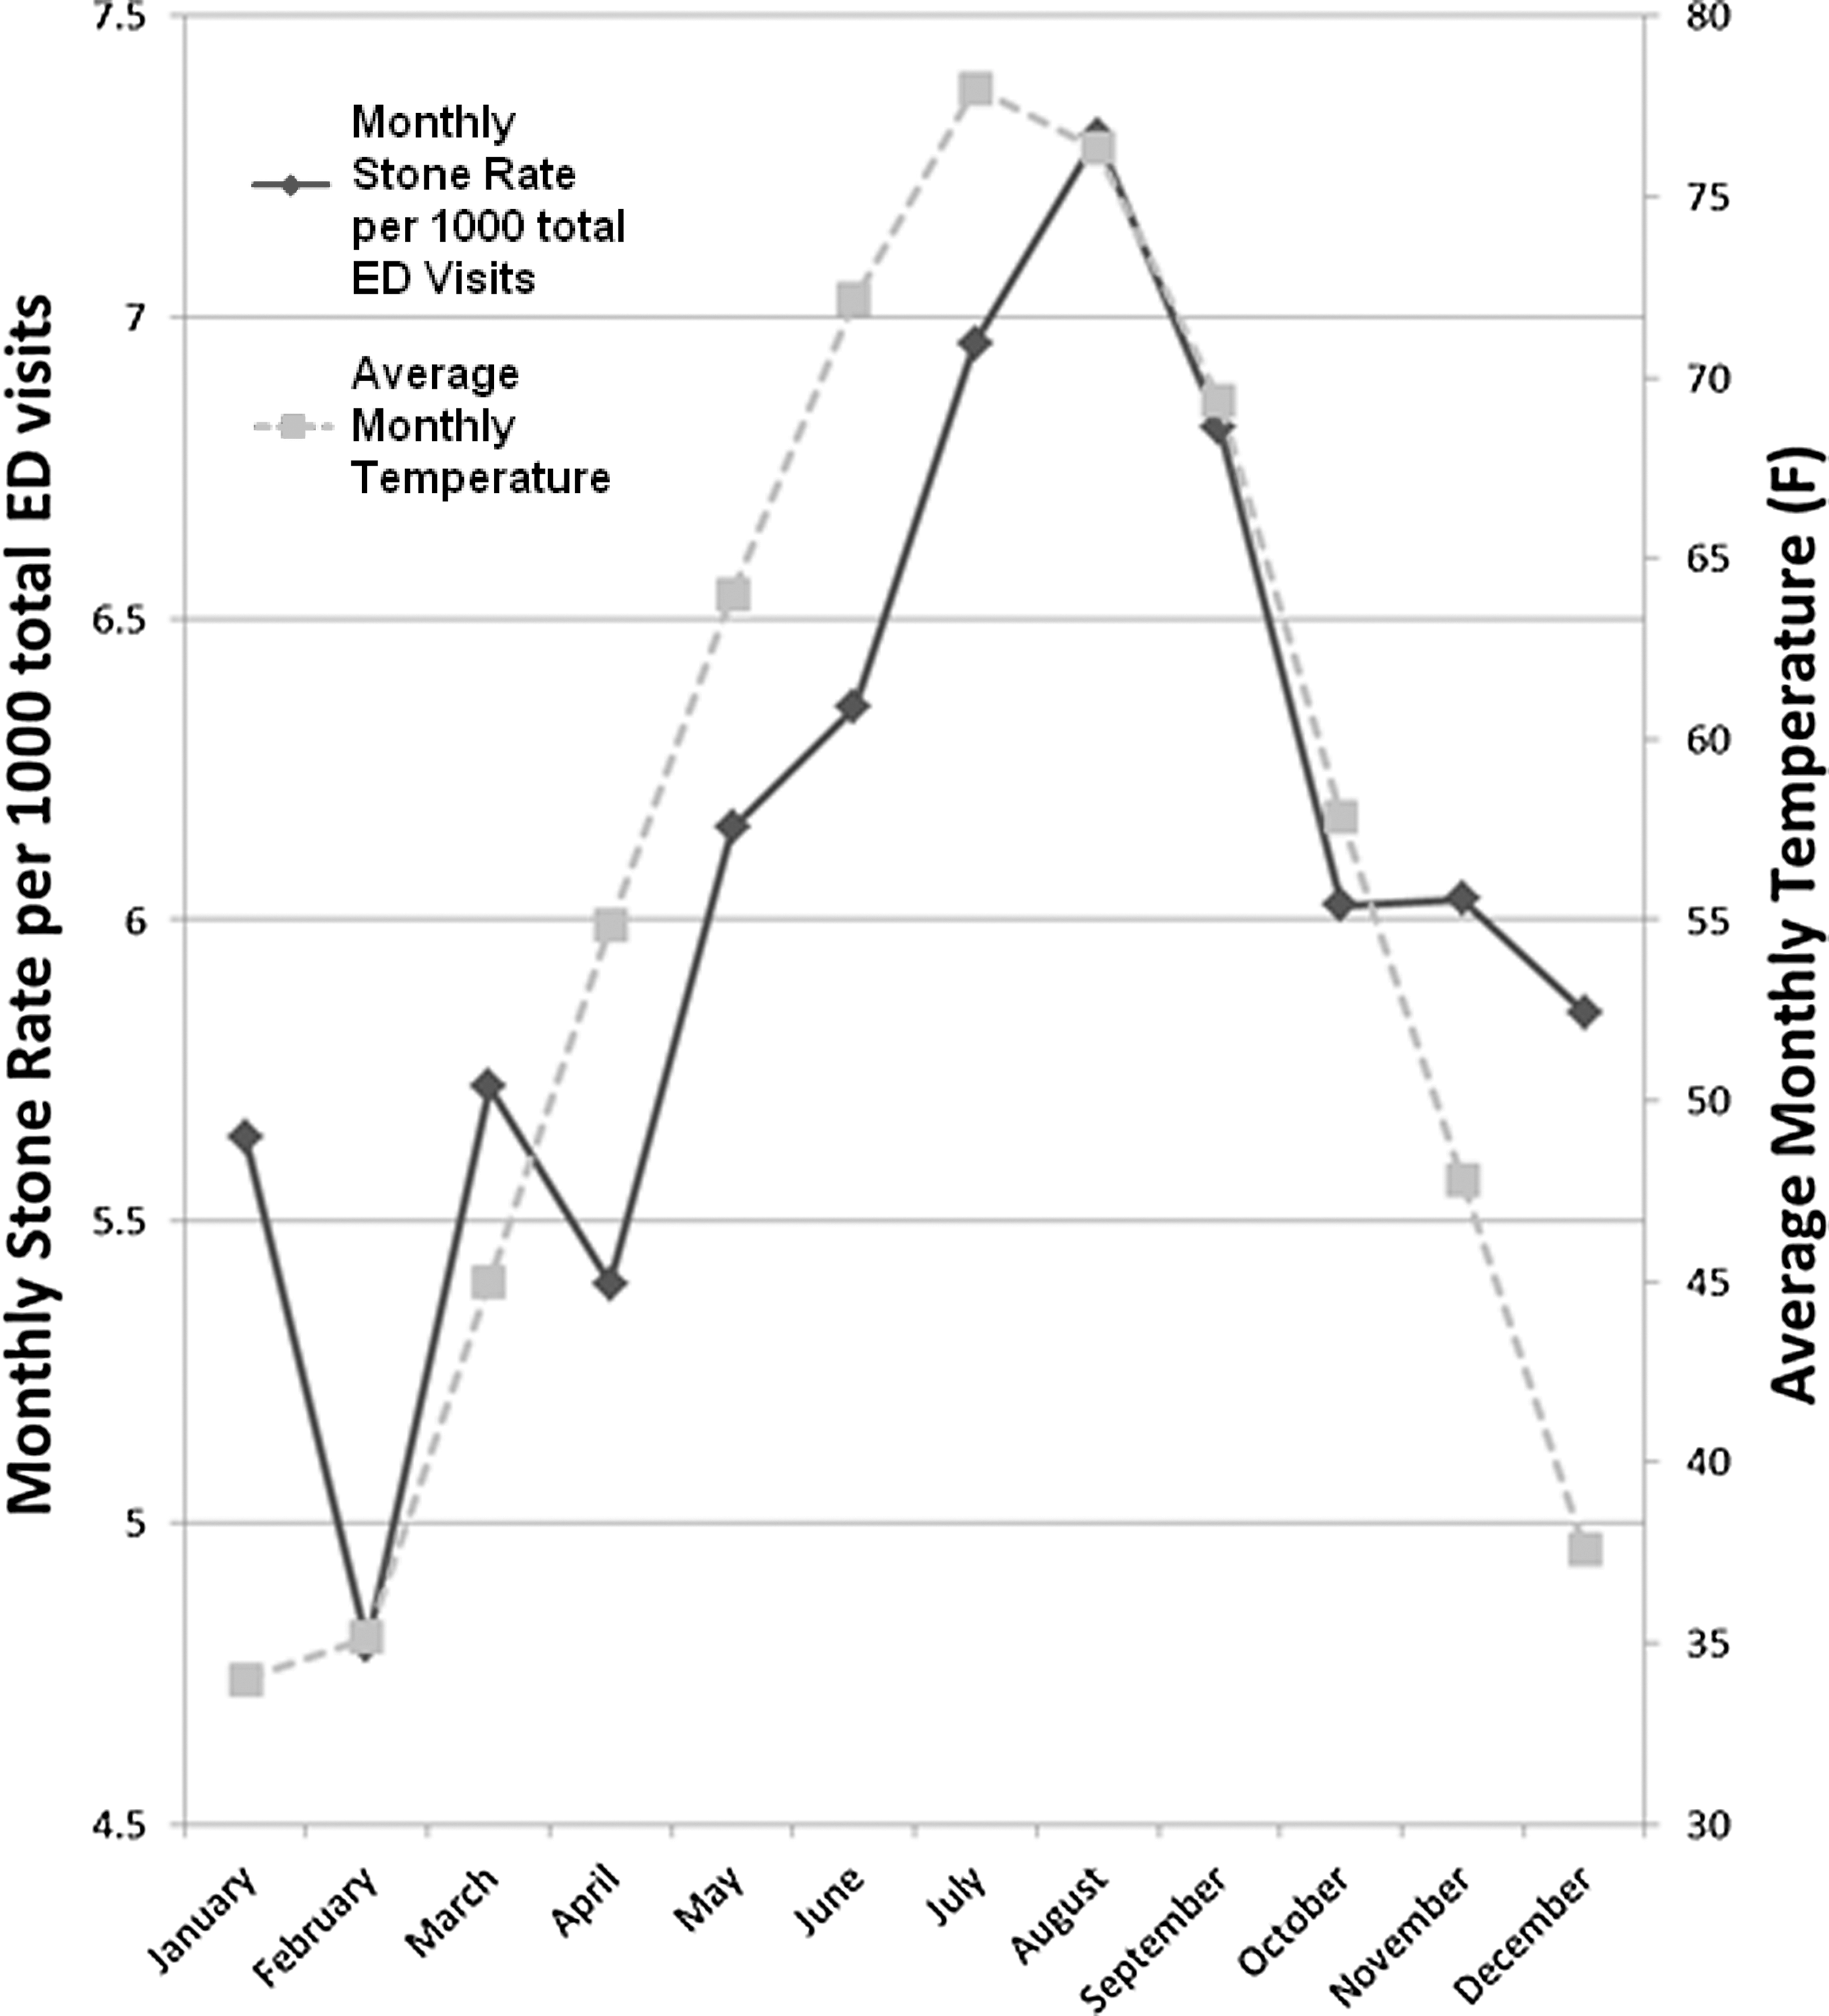
Monthly stone presentation rates correlated with temperature. ED=emergency department.
The correlation between stone presentation rates and meteorologic factors is seen in Table 2 and multivariate ARIMA analysis represented in Table 3. There is a strong association between overall monthly stone rate and temperature and relative humidity (temperature r=0.340, P<0.01; relative humidity r=0.222, P=0.06). There is no correlation seen between overall monthly stone rate and precipitation and sea level pressure (P>0.05). On multivariate ARIMA analysis, only average monthly temperature was significantly associated with monthly urinary calculi presentation rate among all comers (0.269; P<0.01).
P<0.01.
P<0.05.
P<0.10.
All others unlisted have P>0.10.
P<0.01.
P<0.05.
All others unlisted have P>0.10.
The crude correlations hold true for both male and females with respect to temperature (male r=0.372, P<0.01; female r=0.367, P<0.01) but only for males with regard to relative humidity (male r=0.223, P=0.06; female P=0.13). No correlation is seen for precipitation and sea level pressure (P>0.05) except for a negative correlation between the female sex and sea level pressure (r=−0.212, P=0.07). Age groups of 21 to 44 years associated with temperature (r=0.298, P=0.01) and weakly with relative humidity (r=0.199, P=0.09). The age group of 45 to 64 years correlated with temperature (r=0.413, P<0.01) but not relative humidity, precipitation, or sea level pressure (P>0.10). The age group of 65 and older correlated with temperature (r=0.253, P<0.05) and weakly with relative humidity (r=0.202, P=0.09). On ARIMA analysis, both male and female sex rates correlated with temperature but not with any other factor (male 0.190, P<0.01; female 0.106, P<0.05). Surprisingly, only the age group of 45 to 64 years presentation rate correlated with temperature.
We found the Asian, African American, and Caucasian races to have a statistically significant correlation with temperature (P<0.05) and only the Caucasian race to have a weak correlation with relative humidity (P=0.06). Interestingly, the only predilection that the African American race had with any of the meterologic parameters was a weakly negative correlation with sea level pressure (r=−0.202, P=0.09). No race correlated with precipitation. There was no correlation between the admission rate for stones and any of the meteorologic parameters.
Discussion
Urolithiasis incidences differ by region, race, and time of the year. It has been previously described that increases in temperature are associated with increased urine calcium and subsequent calcium oxalate and calcium phosphate supersaturation. 9 Although the true incidence of stone disease is difficult to determine, the lifetime incidence in the United States is 5% to 15%. 1 –3,5,10 There is a lack of studies on the variations of stone presentations to EDs based on demographics. We investigated urolithiasis ED rates in a diverse northeastern urban population to examine a meteorologic relationship.
It is known that urinary calculi presentation rates correlate with several climactic factors. For example, when examining only symptomatic episodes of renal colic in soldiers stationed in the desert, an increase in acute colic was seen during the summer months. 11 A later study 12 ascertained that soldiers in desert climates had a mean time of stone formation of 93 days. More recent studies directly correlated temperature with stone disease in the southeastern U.S. stone “belt.” 13 We have found reliable monthly variations in urolithiasis presentation rates for all populations. The highest rate was found in the months of July and August, while the lowest rate occurred in the months of January and February, directly corresponding to the average monthly temperature. The correlation in our study held true for both sexes, all age groups, and for all races except African Americans using crude correlation analysis. In ARIMA models, where the analysis is adjusted for time trends, we found similar results, suggesting temperature and stone rates are associated despite ascending trends in both variables.
As seen in Figure 1, the stone presentation rate lags behind the average monthly temperature by one data point, corresponding to 1 month. This lag, however, later disappears as the warmer summer months progress to the colder winter months. Although it is unreasonable to assume that new stones form in this 1 month lag period, perhaps already existent stones grow during this time of dehydration and, thus, increased presentations.
Past studies have clearly established that in various parts of the world, temperature has been associated with stone formation and presentation rate. Eisner and coworkers 9 have delineated that temperature, but not humidity, increases urine excretion of several metabolites and minerals that play a role in stone formation. Recently, Lo and colleages 14 reported the number of acute presentations of urinary calculi in New Zealand were significantly related to temperature and hours of sunshine. In fact, they deduced that for each degree increase in temperature, the number of presentations increased by almost 3%, and for each 1 hour increase in sunshine, the number of presentations increased by 0.2%. The same study found, however, that humidity did not relate with the number of presentations. In addition, Chen and associates 7 reported that monthly urinary calculi presentation rates were significantly associated with temperature and pressure in Taiwan, but not humidity.
There have been conflicting reports on whether humidity correlates with calculi formation and presentation rate. In addition, several seminal articles originally reported that humidity did not correlate with stone presentation rate. 4,15 This is in contrast, however, to our study, which establishes that there is a correlation between relative humidity and stone presentation rates (P=0.06 for all comers). It would be interesting to examine not only the role of climate but the role of a specific location within the United States in relation to climate and time spent outdoors. Although we show that both Southern states and New York City have similar presentation rates based on climate, perhaps rural geographic locations to the west will have differing or stronger correlations between climate based on a patient's occupation and outdoor exposure to the weather.
Racial differences in stone prevalence rates have also been studied, determining that Asians and Hispanics have a higher rate and African Americans have a lower rate of stone prevalence compared with Caucasians. 16 When examining the more unique demographics and factors in association with climate, we came to a few fascinating conclusions. We found that no correlation existed between African American stone presentation rate and temperature, relative humidity, or precipitation; there was a weak correlation with sea level pressure (P=0.09). This could be a genetic or socioeconomic phenomena involving extent of exposure to the outdoor environment or diet or underpowering of this specific subset population of patients.
Although the overall rate of Asian Americans presenting to our ED was higher than most other EDs, we found that the rate of stone presentations is not much higher than the general public. In addition, we found only temperature correlated with the stone presentation rate of Asians. This finding could be justified by the relatively low power when stratifying the Asian race out of the entire population studied at our ED. Nevertheless, it could also signify that other factors such as diet and genetic predisposition may play a larger role in stone formation and presentation than climate.
It is extremely difficult to estimate the racial composition of the surrounding area and the socioeconomic status of patients presenting to a Manhattan hospital with several surrounding neighborhoods, but we included our best estimation of the population in the results section. An interesting future study would entail examining and comparing sex and racial presentation rates of our study with a control condition that is not temperature dependent. When analyzing our overall admission rate of patients to the hospital from the ED, no correlation rested with temperature or dew point. Plausibly, meteorologic factors only play a role in stone formation and presentation rather than criteria for admission, such as pain, renal failure, or infection.
Albeit this is the first study to investigate the role of climate on stone presentation rate in Manhattan, a recent article by Fletcher and coworkers 17 reported the association of summer temperatures with hospital admissions for renal diseases in New York City. Not only was temperature associated with stone admission rate, but it was also associated with rates of acute renal failure, urinary tract infections, and other urinary tract disorders. Perhaps the increased incidence of calculi in the warmer months coincides with these other renal disorders.
Willard and Nguyen 18 recently explored the role of the Internet and search engines in their affiliation to stone disease. They discovered that geographic and temporal variability in kidney stone disease appears to be accurately reflected in Internet search trends data. Future studies examining the role of climate or other factors on urinary calculi could use the Internet because it may have deeper applications for urologic research, particularly to articles studying the incidence of several diseases.
We recognize the inherent limitations of the study because it is a retrospective single-institution design examining billing codes as a surrogate for renal stone presentation. There could be errors in coding, misdiagnosis, or a patient presenting with more than one medical issue. Although the two ICD codes used in the study represent the vast majority of patients presenting to our ED with urinary calculi, there may be a small percentage of patients who are coded with one of the other calculi codes. A patient's nonresponse on our intake survey automatically groups him or her into the “other” category, which limits our analysis of the stone presentation rate and correlation based on race. Using ambient temperature and humidity does not take into account the amount of time each patient spends indoors vs patients who are exposed to the outside environmental elements.
Another limitation to the study is that patients may have presented multiple times, with each presentation assigned as a unique visit. This would lead to a falsely high number of new presentations related to the monthly temperature. In addition, the statistical analysis is underpowered when examining some of the individual patient demographics, such as race, which could lead to false conclusions. A further study is needed to prospectively survey these patients and track their ED and outpatient presentations using multiple institutions within a single city. Finally, although this is the first study examining the role of climate on stone presentation rate in the Northeast, it is a single center study and may not represent the same patterns as those of other hospitals in New York City.
It is important to research the effects of climate, specifically temperature and humidity on the stone presentation rate because these variables are in a constant shift. In more recent years, the average monthly temperatures have steadily increased in New York City, as exemplified in this study. This effect could be attributed presumably to the global warming effect or to natural variations and cycles in the Earth's climate. Fakheri and Goldfarb 19 analyzed the role of temperature and humidity on stone formation, concluding that these factors have a clear cause in stone formation. They predicted that there would be an expansion in the current “stone belt” high-risk stone areas to include areas as far north as New York City by the end of this century. These data can aid in allocation of limited hospital resources and personnel. An interdepartmental “fast track” could be implemented between the emergency, urologic, and interventional radiology departments during the late summer months.
Conclusion
This is the first study examining the role of climate on the stone presentation rate in a large city above the Southern “stone belt” states. Temperature has a strong correlation with the calculi presentation rate, and relative humidity has a trend (P=0.06) toward the overall calculi presentation rate. Urologists should recognize that warmer seasons might result in an increased incidence of patients presenting to the ED with renal colic. We can combat this effect by instructing patients to take several known preventative measures such as increasing fluid intake and decreasing protein consumption. More information must be obtained on the effect of calculi presentation rates across the United States as they pertain to different environments, but as demonstrated, a variety of practical methods may be utilized.
Footnotes
Disclosure Statement
No competing financial interests exist.