
Abstract
Background and Purpose:
The R.E.N.A.L. Nephrometry Score (RNS) was developed to standardize the reporting of anatomic information of a renal mass. This study aimed to identify the association of preoperative clinical and tumor features assessed by the RNS with pathologic upstaging of clinical T1 renal-cell carcinomas (RCCs) in complete en bloc radical nephrectomy (RN) specimens.
Patients and Methods:
A review was performed for 65 consecutive patients (2005–2013) who underwent RNs for a unilateral clinical T1N0M0 RCC. The RNS was measured in all patients based on preoperative CT scans. Pathologic review was performed to identify patients with final pathologic upstaging. Associations were assessed with the Fisher exact test, Student t test, and Wilcoxon rank sum test.
Results:
Of the 65 patients (41 male, mean age 59 years), 4 (6%) patients were upstaged to pT2 and 16 (25%) were upstaged to pT3a and above in the final histologic evaluation. Upstaged patients were not significantly different from those without in terms of age, sex, race, surgical approach, side of surgery, Fuhrman grade, and histologic cell type. Independent tumor features associated with pathologic upstaging were (R) tumor diameter (P=0.021), and (L) central location within polar lines (P=0.010). Tumors that were upstaged had a higher median total RNS than those without (10 vs 9, P=0.010). Complex tumors, with RNS≥10, were associated with significantly increased risk of upstaging compared with low and intermediate complexity categories (RNS<10) (relative risk=2.56, 95% confidence interval 1.22–5.37, P=0.014).
Conclusions:
A higher RNS was associated with an increased risk of upstaging in clinical T1 cancers, predominantly from perinephric or sinus fat invasion in RN pathologic specimens. This may have implications on the selection of surgical option for the clinical T1 renal mass.
Introduction
N
The current 2010 Tumor-Node-Metastasis (TNM) staging system for localized renal-cell carcinoma (RCC) divides T1 tumors to T1a (<4 cm) and T1b (4–7 cm). T2 tumors are also defined by size >7 cm. The T3a tumor category was modified from earlier systems to include invasion of the perinephric or renal sinus fat without involvement of the Gerota fascia. 6 As larger and more difficult clinical T1 tumors are attempted increasingly for nephron-sparing surgery, there is a risk of pathologic upstaging to T2 or T3a. Although controversial, there is evidence that the T3 stage in the TNM system for locally advanced RCC is associated with different cancer-specific survival rates, especially if it involves the sinus fat. 7,8 Pathologic upstaging can be accurately assessed in RN specimens, where the kidney with the Gerota fascia and perirenal fat are removed en bloc.
The R.E.N.A.L. (radius; exophytic/endophytic; nearness; anterior/posterior; location) Nephrometry Score (RNS) was developed to standardize the reporting of renal tumor size, location, and depth. 9 The aim was to facilitate better communication of anatomic complexity of a tumor and facilitate treatment in decision making. Clinically, it has been shown to be useful in predicting outcomes and complications of PN. 10 –12
The aim of this study is to retrospectively identify preoperative tumor features, as measured by the RNS, which are associated with the pathologic upstaging of clinical T1 kidney cancers in RN specimens.
Patients and Methods
After Institutional Review Board approval of this study, a retrospective study of clinical T1 kidney cancers managed with RN at the National University Hospital, Singapore, from January 2005 to March 2013, was performed. Patients with bilateral synchronous tumors or von Hippel-Lindau syndrome, and end-stage kidney disease were excluded. During the study period, a total of 207 kidney cancers were treated, of which 105 were clinical T1 cancers. Because PN was a newly adopted treatment option at our institution, the majority of these T1 cancers were treated with RN (n=65, 62%). This group formed the study cohort.
Patients undergoing RN were recorded in our kidney cancer database. RN was performed by either laparoscopic or open approaches, and the selection was based on clinical assessments. Preoperative investigations included medical history, physical examination, laboratory studies, and preoperative contrast enhanced CT scans. This imaging was used to assign a clinical stage according to the 2010 TNM staging system.
6
In addition, the lesions were scored based on their complexity using the RNS system, with the aid of the online tool available at
We categorized the groups into their various complexities according to the original RNS score proposed by Kutikov and Uzzo, 9 whereby each component of the RNS is scored on a 1-, 2-, or 3-point scale, except for the anterior or posterior location of the tumor, which is denoted by a prefix. Subsequently, a total RNS score is obtained by the summation of each component, excluding the anterior/posterior prefix. The complexity of the tumor is then divided into that of being low, moderate, or high complexity, with low complexity having a total RNS score of 4 to 6, moderate complexity having a score of 7 to 9, and high complexity with a score of 10 to 12. This categorization of tumor complexity has been widely adopted by others to study the impact of tumor complexity on outcomes of renal mass treatment. 10 –12 Data pertaining to tumor pathology were obtained by chart review. Tumor pathologic staging was reviewed and independently verified by our pathologist (T.T).
After surgery, patients were followed up at 4 to 6 weeks and then 4 to 6 monthly for 2 years and annually thereafter. Time to recurrence was defined as the interval from surgery to the first evidence of disease recurrence. The follow-up schedule is based on the European Association of Urology (EAU) guidelines for the follow-up of patients with RCC after surgical treatment. According to the EAU guidelines, patients should have their first follow-up 4 to 6 weeks after surgery. Patients with T1 and T2 tumors are followed up every 6 months for 3 years and annually thereafter. Recommended imaging consisted of chest radiography annually, and kidney imaging every 6 to 12 months. For our patients, at each follow-up visit, a physical examination is performed and laboratory investigations consisting of a full blood cell count and renal function test are repeated. Chest radiography and kidney imaging are performed annually. Kidney imaging consists of a contrasted CT scan if renal function is normal, or ultrasonography of the renal system if the patient has a reduced glomerular filtration rate or chronic kidney disease.
Patients were divided into two groups for comparison purposes—those tumors with and without final pathologic upstaging. The Fisher exact test, Student t test and Wilcoxon rank sum test were performed to compare patients with and without upstaged histology. In particular, the risk of upstaging comparing RNS score ≥10 vs <10 was quantified using the relative risk (RR) estimate and its associated 95% confidence interval (CI). All statistical analyses were performed using STATASE 12.0 (StataCorp LP, College Station, TX) assuming a two-sided test with significance level of 0.05.
Results
In the 65 patients (mean age±standrd deviation [SD]=59±11) with masses clinically staged as T1, 69% (n=45) of them were confirmed to be pT1 on final pathologic analysis. Twenty (31%) masses were upstaged, however. Of these, masses of 4 patients were upstaged to pT2 and those of 15 patients were upstaged to pT3a. For tumors upstaged to pT3a, 5 were upstaged as a result of microscopic perinephric fat invasion, and 10 were upstaged as a result of renal sinus fat infiltration (Fig. 1). One mass was upstaged to pT4 secondary to adrenal invasion and perinephric fat invasion. There were no pT3b cases. All tumors were removed with negative resection margins.
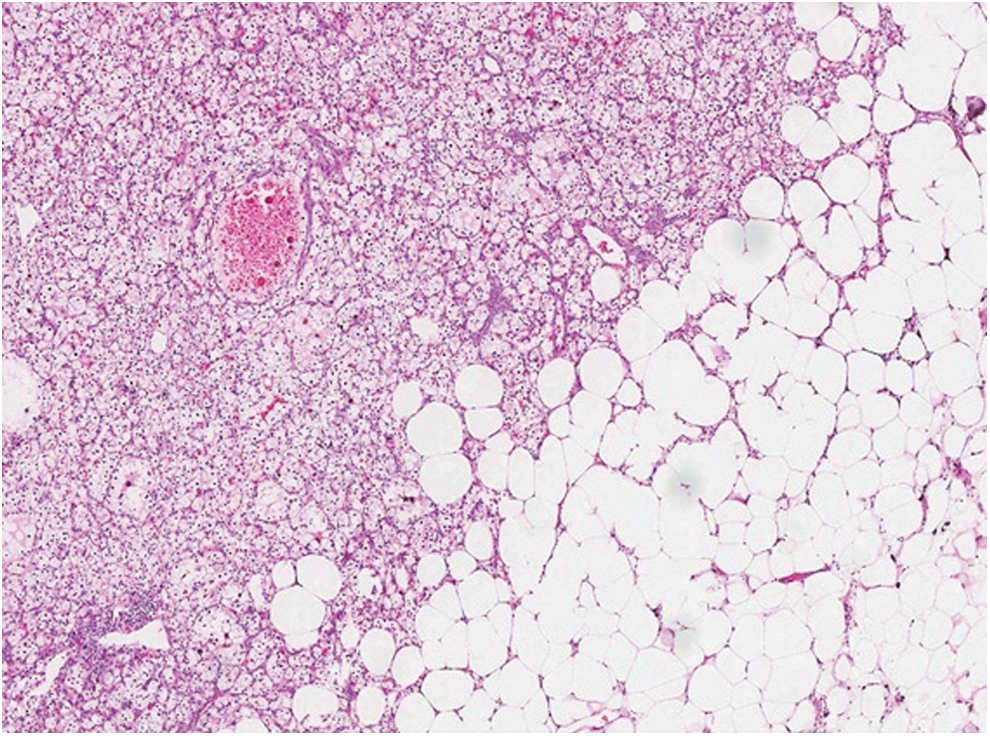
Renal-cell carcinoma, clear-cell type, seen invading renal sinus fat (hematoxylin and eosin; original magnification ×70).
Table 1 shows the demographic and clinical characteristics of patients with and without upstaged tumors. There was no significant difference in terms of age, sex, race, choice of surgical approach, and side of lesion between the two groups. There was also no difference in the histology and Fuhrman grade of the cancers between the upstaged and without upstaged tumors. Table 2 compares the independent tumor features, as recorded by the RNS, between the patients with and without upstaged pathology. Tumors with increased tumor diameter (R) or with a central location within the polar lines of the kidney (L) were significantly associated with pathologic upstaging. The distance to the collecting system or sinus (N), the anterior or posterior location of tumors (A), and the exophytic or endophytic nature of the tumors (E) were factors not significantly associated with upstaging.
SD=standard deviation; lap=laparoscopic.
SD=standard deviation.
According to the total RNS, 7 (11%) tumors were of low, 34 (52%) of moderate, and 24 (37%) of high complexity. Tumors that were upstaged had higher median total RNS scores than those without (10 vs 9, P=0.010). Complex clinical T1 tumors with RNS scores of ≥10 were significantly more likely to be upstaged pathologically (RR=2.56, 95% CI 1.22–5.37, P=0.014).
The numbers of patients in the individual lower and intermediate complexity groups were relatively small, and analysis of comparison between individual complexity groups was not significant.
In comparison with T1 RCC patients (n=40) who underwent PN, total RNS score was significantly lower compared with those who had RN, with a mean RNS score of 6.96 (SD 1.7, P<0.001) for PN patients. None of the PN specimens were upstaged in the final pathologic examination. The selection of cases for PN of lower complexity tumors was therefore partially accountable for the lower numbers in the less complex tumor groups (RNS<10).
Over a median period of 4 years of follow-up, local recurrences and metastasis developed in three (15%) patients in the upstaged group, distant metastasis without local recurrence developed in one (5%) patient. On the other hand, two (4.4%) tumors in the pathologic T1 cancers had distant metastasis with local recurrences developing in no patients, respectively.
Discussion
For clinical T1 kidney cancers, this study showed that tumor size and its position within polar lines as defined by the RNS system was significantly associated with pathologic upstaging in RN specimens. In addition, complex tumors with total RNS scores of 10 or more were 2.5 times as likely to the upstaged pathologically as those with scores of less than 10.
The RNS was developed in 2009 originally to quantify pertinent characteristics of renal tumors to address the difficulty of comparing outcomes and complications of PN because of the heterogeneity in small renal tumor complexity. 9 The RNS is shown to be reproducible with high interobserver fidelity even between urology residents. 13,14 It has been used successfully to predict warm ischemia time, blood loss, complications including urine leak, and hospital length of stay and functional recovery for open, laparoscopic, and robot-assisted PN. 10 –12,15 More recently, there have been attempts to correlate RNS with tumor pathology and biology. Increasing RNS score of a tumor is associated with increasing risk of malignant clear-cell pathology as opposed to a benign lesion. 16 By combining the RNS with age and sex, a nomogram was developed by the original developers of the RNS to predict the risk of malignant and high-grade pathology of a renal mass. 17 Our study adds to these recent RNS reports on tumor pathology with the finding that clinical T1 renal cancers with high RNS are more likely to be of a higher stage pathologically.
The correlation of RNS with the risk of upstaging is not unexpected because the main anatomic components of the RNS such as size and tumor centrality are intuitively expected to be associated with increasing risk of size upstaging (to T2) and microscopic perinephric or sinus fat invasion (to T3a). Size is a known factor associated with malignant potential and, hence, local invasiveness of RCC cases, 18 with increasing tumor diameter shown to be associated with tumor recurrence after treatment. 19 Tumor centrality as assessed by location within the polar lines is a significant predictor of sinus fat involvement.
On the other hand, tumor anatomic characteristics such as endophytic or exophytic nature, anterior/posterior location was not associated with upstaging on their own. In the above group, distance to renal sinus was not a statistically significant factor for upstaging despite the fact that 100% of the cases upstaged was within 4 mm of the sinus or collecting system compared with 86.6% of cases not upstaged. This might be a reflection of the relatively small number of patients in this study cohort. Despite this, the total RNS effectively takes into account the interplay of all the different anatomic features of a renal mass to define its complexity; as such, upstaged cancers consistently had higher median and mean scores than pathologic T1 cancers, with a total score of 10 or more predicting a significant risk of upstaging.
The important question of pathologic upstaging is whether there are any prognostic implications. Although the outcome prediction of RCC cancer based on the TNM staging system is still controversial, it remains the only staging system that has achieved widespread acceptance in clinical practice. 7 Tumors greater than stage T1 are associated with early recurrence, as shown in the CORONA/SATURN project. 19 Upstaging of tumors to T3a by perirenal fat invasion was reported to have the same recurrence-free survival as patients with pathologic T1 lesions. 7,20 On the other hand, renal sinus fat invasion is thought to be more important. 7 Thompson and associates 21 and Bertini and colleagues 8 reported that pT3a clear-cell tumors with renal sinus fat involvement, but without nodal involvement and metastasis, had a poorer cancer-specific survival when compared with those with perinephric fat involvement only. The renal sinus contains numerous veins and lymphatics, and invasion into this compartment may permit dissemination of a tumor otherwise considered limited to the kidney. 22
In the above study, the majority of the upstaging to T3a involved renal sinus fat infiltration. Of the three patients in whom local recurrences developed, all belonged to the upstaged group with no patients in the group without pathologic upstage having local recurrence development. It is clear that upstaged tumors may have important implications with regard to local recurrence even for RN patients.
A limitation of our study is the small sample size. Because of the small study sample and an even smaller rate of cancer progression and death, we were unable to perform a meaningful survival analysis. The associations of the RNS with the risk of upstaging, however, makes biological sense and should hold true even in a larger study population. As more and more institutions including us move toward PN and other nephron-sparing procedures to treat patients with clinical T1 lesions, the above study cohort represents a unique group, where adequate perinephric and renal sinus fat sampling is available by nature of the RN specimen. Adequate perinephric and renal sinus fat sampling has been identified as an important factor to accurately stage tumors in the T3a category. 7 This study therefore reinforces a recent large-scale report of increased tumor complexity, size, and location predicting upstaging of clinical T1 to pathologic T3a after robot-assisted PN. In that series, however, only 4.8% of clinical T1 lesions were found to be upstaged to pathological T3a, compared with 31% in our RN population. This suggests that there might be missed cases of pathologic upstaging of patients in the PN group. 23
With successful oncologic and functional outcomes reported for PN in clinical T1 renal masses 24 and improvements in techniques for minimally invasive PN including the use of robotic surgery, there is a push for performing PN on increasingly complex kidney lesions. The RNS therefore provides an assessment of the risk of upstaging. Together with its predictive ability for surgical and functional outcomes after PN, it may be a clinical tool to guide the management of T1 cancers in the decision-making regarding the choice of nephron-sparing surgery by analyzing the anatomic complexity of the tumor based on RNS features. The final decision with regard to the surgical option, however, still lies at the discretion of the attending clinician. We would recommend that if PN is performed for complex lesions with score RNS>10, more extensive perinepheric and sinus fat sampling should be performed. This may facilitate more accurate staging knowing the increased risk of microscopic involvement of these complex lesions.
Footnotes
Disclosure Statement
No competing financial interests exist.