




Abstract
Objectives:
To determine the incidence of computed tomography (CT) identifiable Randall plaques in a CT explored population; to determine the clinical relevance of this radiological finding by a 7-year follow-up; to determine a cut point to identify a population with high risk of developing calcium stone disease (SD).
Materials and Methods:
Retrospective study of all patients explored by abdominal CT in our center between January and March 2005. Inclusion criteria: age 30–60 years and no SD. Papillae attenuation was measured on nonenhanced CT in Hounsfield units (HU) and the mean of all papillae was calculated. Patients were re-evaluated after 7 years to identify calcium stone formers. Anamnesis and already available CT, ultrasound, kidney, ureter, and bladder radiograph (KUB) or intravenous urography (IVU) images performed as part of their follow-up were used. In patients with no follow-up, ultrasound and KUB were to be performed. Pearson correlation, Student t-test, and the receiver operator curve were used for statistical analysis.
Results:
A total of 362 patients fulfilled the inclusion criteria and were analyzed; 12 developed calcium SD after 7 years. A significant difference was encountered between the papillae attenuation of stone formers (SF) versus non-SF (47.2HU vs. 35.5HU, p=0.001). There was good correlation between papillae attenuation and the possibility of developing SD (R=0.87). An optimal cut point of 43HU with a sensitivity of 81% and specificity of 97%, area under the curve 0.91, separated SF and non-SF.
Conclusion:
Patients with high papillae density have a higher risk of developing SD. A cut point of 43HU could accurately be used to identify a high-risk population.
Introduction
R
Previous studies have proven that papillae's tip increment of density can be identified by an unenhanced CT-scan (uCT) in patients with active stone disease (SD) 4 –6 being present only in the region corresponding to the tip of the renal papillae. 7 These findings support Randall's theory of stone formation. The same modification in the distal renal papillae was identified even when active SD was not present, before its development. 7 However, important questions over the real incidence and prevalence of these findings and its clinical applicability still remain unanswered.
The objective of our study was to determine the clinical relevance of the Randall plaques identified in abdominal CT images. For that purpose, we decided to evaluate the incidence of uCT identifiable Randall plaques in a uCT explored population; to monitor the evolution of these patients after a 7-year follow-up, and to determine a radiological measurement cut point that would allow us to identify a population with high risk for developing SD.
Patients and Methods
We retrospectively reviewed 1000 consecutive patients explored by abdominal CT in our center between January and March 2005 to have a minimum follow-up of 7 years. We performed a cohort study to identify the outcome of our uCT explored population. The inclusion criteria were as follows: (1) no history of SD; (2) no SD on the uCT performed in our center; (3) no conditions predisposing to stone development (hyperparathyroidism, intestinal inflammatory disease, etc…); (4) no chronic renal failure, patients with acute renal failure were included if normalization of serum creatinine could be documented; (5) No malignant diseases.
The reason for performing the abdominal uCT did not influence the eligibility for the study, except in patients who underwent uCT for SD. Patients who underwent nephrectomy or died during follow-up were excluded.
All CTs were performed for clinical or diagnostic purposes other than renal lithiasis as part of the standard protocols of our center. The study adheres to local regulations and standards and was approved by the Institutional Review Board.
A uCT was performed on Siemens (Erlangen, Germany) CT multidetector scanners (Emotion Duo or Sensation 64). In all cases, coronal reformatted images were obtained. In those patients who had nephrographic and excretory phases, these were used together with the unenhanced one for a better localization of the renal papillae. The examinations were done with 5 mm slice thickness reconstruction. In some patients, 1 mm slice thickness reconstructions were also obtained. As 1 mm slices were not available in all patients, we performed the measurements using the 5 mm slides. A subanalysis of the patients where 1 mm slices were available was performed, comparing the results with the 5 mm slices of the same patients.
The CT images were reviewed using the Raim Alma 2010 (©ALMA IT SYSTEMS, Barcelona, Spain) software. Patients were reviewed consecutively. The reviewers had no knowledge of subsequent imaging in those patients who might have developed SD in the follow-up. Each kidney was divided into three parts corresponding to the three caliceal groups; in each one the density of the renal papillae was recorded.
Renal papilla attenuation was measured in Hounsfield units (HU) by placing regions of interest (ROIs) with a mean size of 0.1 cm2 over the tip of the papilla (Fig. 1). The images were magnified to 5× to prevent contamination of the ROIs with fat of the renal sinus. Each kidney was divided into three parts corresponding to the three caliceal groups; in each one the attenuation of the renal papillae was recorded. A total of six measurements for each patient were recorded, three in each kidney using unenhanced CT images. In every kidney, one papilla from each caliceal group was measured, choosing the easiest to identify. The mean attenuation was calculated for each kidney.
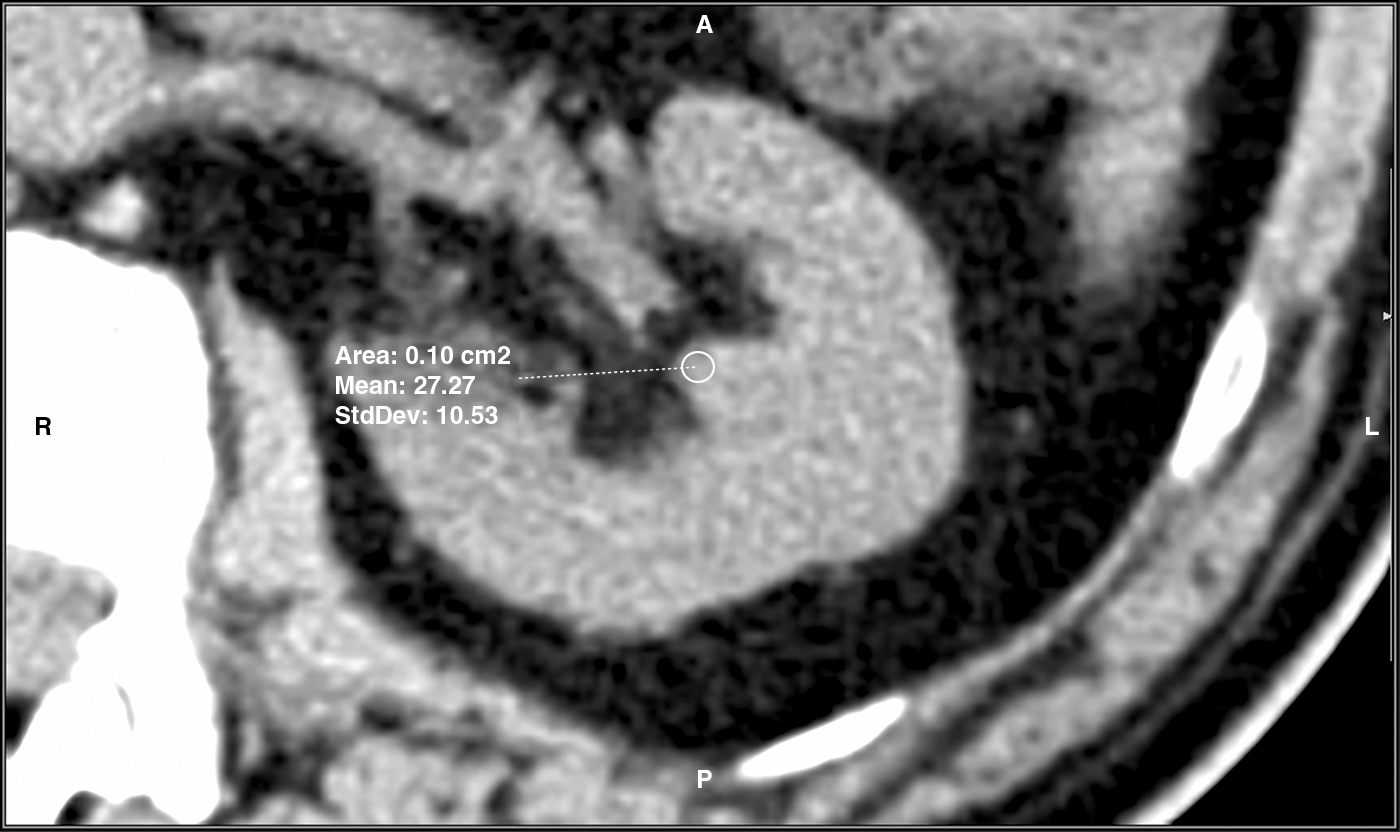
Renal papillae Hounsfield attenuation values measured by placing regions of interest over the tip of the papilla.
The patients who fulfilled the inclusion criteria were re-evaluated in 2013 after a mean interval of 7 years. Medical history was updated in all patients. If available, abdominal CTs, abdominal ultrasound, and kidney, ureter, and bladder radiograph (KUB) or intravenous urography (IVU), already performed as part of their follow-up by different specialties, were used. In patients with no active follow-up between 2005 and 2013, ultrasound and KUB were performed. Ultrasound alone as evidence of SD was not accepted because of the possibility of uric acid stones. KUB was considered necessary in these patients to support the diagnosis of CS.
For the evaluation of the composition of stones, in the case of stones already obtained and analyzed, the result was registered. For the rest of the stones, we used surrogate markers as the unenhanced CT attenuation (a cut point of 600HU was used to separate uric acid and CS), and if CT images were not available, clear visibility on plain x-ray films was considered suggestive of CS. In all stone patients, urine bacterial cultures were registered.
For the statistical analysis, we defined two groups: calcium stone-forming patients (CSF) and nonstone-forming patients (NSF). Pearson correlation coefficient was used to evaluate the correlation between the renal papillae attenuation and the possibility of developing SD. The two-tailed independent sample t-test and the Wilcoxon signed-rank test were used to test the significance of differences between groups. A p value inferior to 0.05 was considered significant from a statistical point of view. A receiver operator curve (ROC) analysis was used to define a cut point between CSF and NSF that could help characterize a high-risk population. The relative risk to develop calcium SD was calculated for this population. The Bland Altman analysis was used to evaluate the mean dispersion of attenuation values between the papillae of the same kidney.
Results
Demographics
The first consecutive 1000 patients who underwent abdominal CT between January and March 2005 were evaluated. SD prevalence was 8.6%. Another 1.2% had a prior history of SD although they had no evidence of SD on the 2005 CT. A total of 576 patients fulfilled the inclusion criteria, 177 patients were lost to follow-up, and 37 patients died. A total of 362 patients were analyzed. Patients' demographic data can be found in Table 1. In the follow-up, 87 patients had a recent (less than a year) CT and 163 a recent ultrasound.
Follow-up stone status outcome
Of the total of 362 patients, 12 patients (3.3%) developed SD after 7 years. SD was diagnosed in 10 of the CTs and 2 of the ultrasounds. One hundred twelve patients had no follow-up and underwent ultrasound showing presence of SD in 1 case. Both patients diagnosed by ultrasound had clearly radioopaque stones on KUB and these were considered CS.
In one patient, the stone attenuation measured on abdominal CT images was lower than 600HU (237HU) and considered as uric acid stones. In all other patients, the stone attenuation measured on uCT was superior to 600HU, the lowest one being 619HU, and considered as CS. Stone analysis was available in seven patients who also had available CT images, confirming calcium oxalate composition. All stone patients had negative urine culture.
Of the 12 patients, 7 were symptomatic and required treatment (4 medical expulsive treatments with spontaneous expulsions, 2 external shock wave lithotripsy, and 1 ureterorenoscopy). The mean stone size was 4 mm (3–6 mm) for symptomatic and 2 mm (1–3 mm) for nonsymptomatic patients.
The baseline distribution of the attenuations of the tip of the papillae measured on abdominal CT images was continuous and is shown in Figure 2.
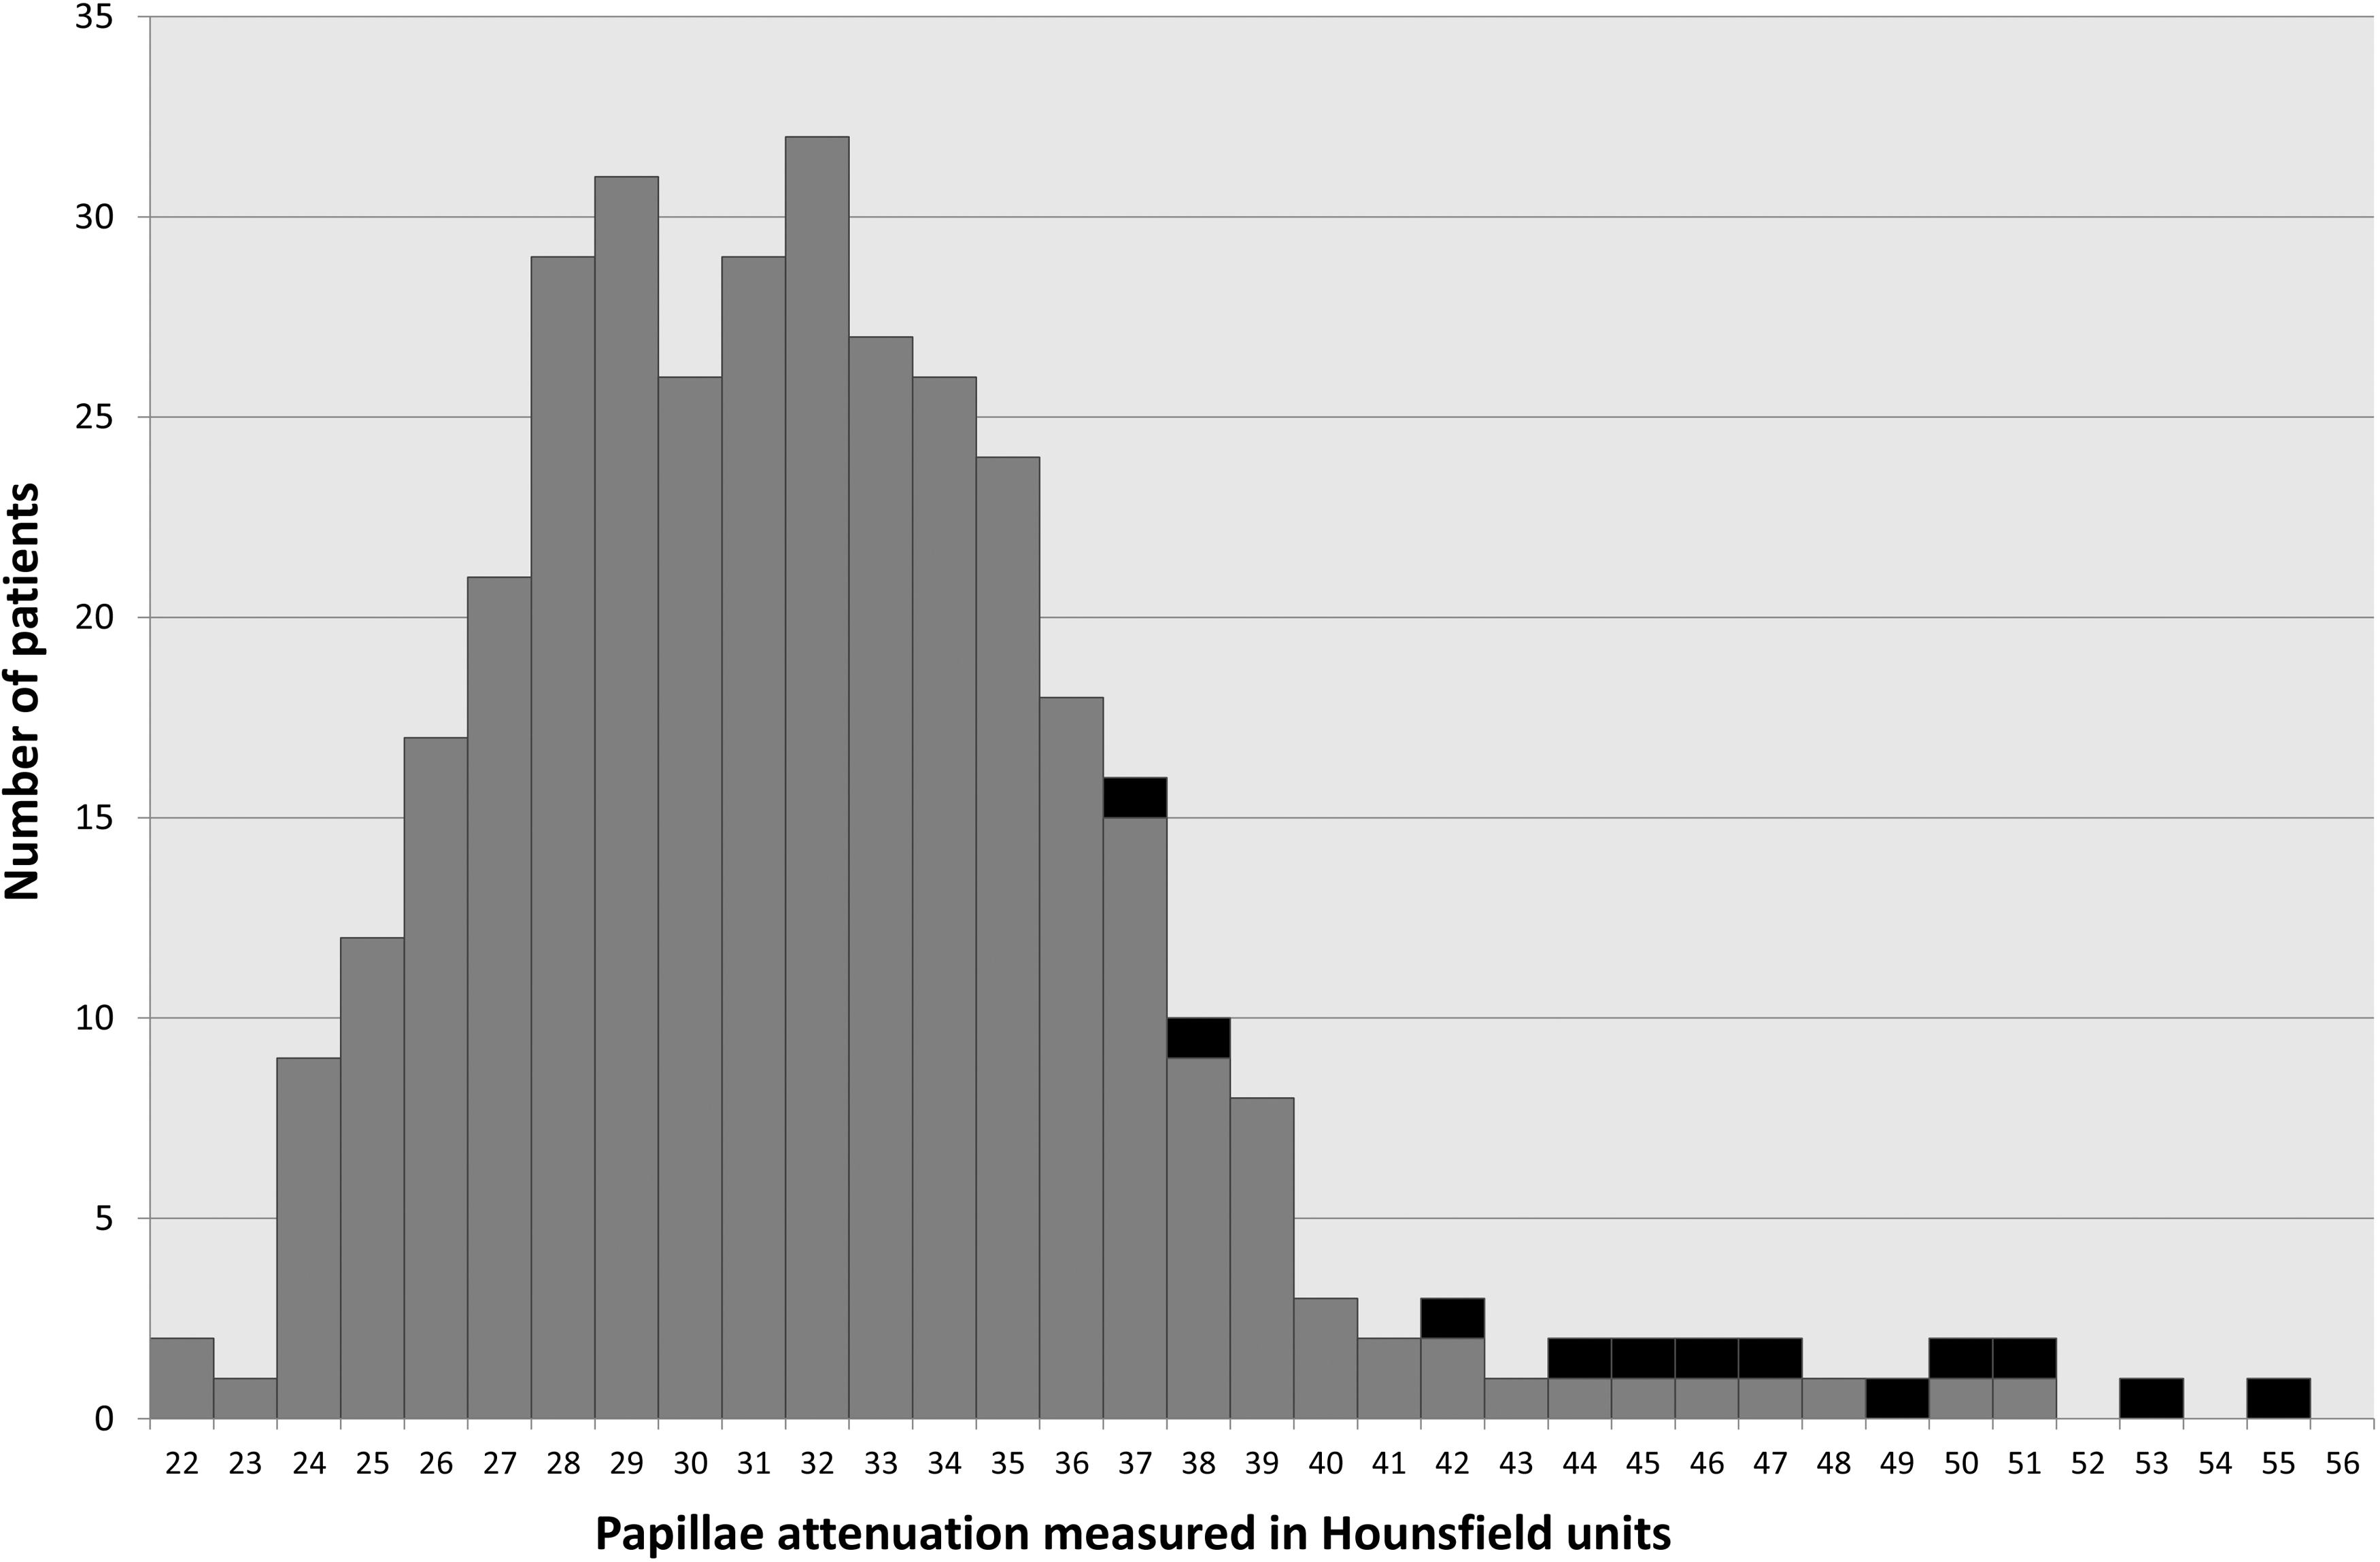
Distribution of renal papillae attenuation. Black represents stone-forming patients, gray—nonstone-forming patients.
Statistical groups
A total of 11 patients (3.03%) developed CS after a mean follow-up of 7 years and were included in the CSF statistical group. The uric acid stone formers were not included in the statistical analysis. The remaining 351 patients were considered as the NSF group.
Statistical analysis results
There was a significant difference between the mean papillae attenuation of patients who developed calcium SD when compared with the NSF group (47.2HU versus 35.5 HU, p=0.003). There were no significant differences between the SF and NSF group from a demographical point of view (Table 1).
We found a good correlation between the attenuation of the renal papillae and the possibility of developing SD (R=0.87). Age showed a poor correlation with the presence of a higher attenuation or a higher risk of developing SD (R=0.37). On multivariate analysis, renal papillae attenuation was the only predictor for the development of SD.
A cut point of 43HU showed the optimal combination of sensitivity (81%) and specificity (97.7%) in the ROC with an area under the curve of 0.91 (Fig. 3). A total of 53% of the patients with papillae density higher than 43HU developed calcium SD after 7 years. Up to 81% of the CSF patients had a papillae density higher than 43HU, whereas only 19% had attenuation lower than 43HU.

The receiver operator curve (ROC) distribution.
High papillae attenuation values (>43HU) were associated with a higher risk of developing an SD episode (an odds ratio of 91.05).
A total of 155 patients had 1 mm slices available for analysis. The papillae attenuation measurements performed on these slices were compared with those performed in the same patients using the 5 mm slices. We identified no significant slice thickness dependent differences (36.2HU in 5 mm slices versus 36.4HU in 1 mm slices, p=0.52).
The mean dispersion of papillae tip attenuation was 1,2HU for the papillae of the same kidney. The difference between the left and right kidney was not significant from a statistical point of view (47.1 versus 47.3 HU, p=0.92).
Discussion
The Randall plaque theory postulates that small calcifications appear beneath the urothelium, grow and break through it, and finally evolve to develop CS. 1,8 The presence of these small calcifications changes the CT attenuation of the papillae tip. Various studies showed that uCT can be used to identify the presence of these small calcium deposits. 4 –7 The incidence and the normal evolution of these small calcifications were unknown.
The incidence of CS was always closely related to the presence of the Randall plaques. The 7-year cumulated incidence of lithiasis in our population was 3.9% and 3.5% for CS, whereas the prevalence in the Spanish general population is 5% to 14% 9 and in the European population 5% to 10%. 10 The slightly higher incidence in our study is probably due to the fact that we chose the population group with the highest incidence for SD (30–60 years).
Our study comes to strengthen the relationship between the calcifications of the tip of the renal papillae and the development of CS, as the incidence of CS in our population was closely related to the presence of higher quantities of calcium in the tip of the renal papillae. The cut point of 43 HU can be used in two ways. Patients with papillae tip attenuation >43HU can be identified as a high-risk group with a possibility of 53% developing SD over 7 years. On the other hand, patients with papillae tip attenuation <32HU had an SD incidence of 0%. In addition, we encountered a continuous distribution of attenuation values with good correlation between the papillae tip attenuation and the possibility of developing SD, higher attenuations being related to a higher risk. All this leads to the idea that the attenuation interval comprised between 32 and 43HU acts as a growth stage or level of development key point, marking the moment of sufficient accumulation of calcium when the calcification breaks through the urothelium and evolves to a real active stone nucleus that begins to catalyze the deposit of crystals initiating stone growth.
The lack of differences between papillae attenuation of the two kidneys and the stretch dispersion of papillae tip attenuation values in the same kidney suggests a diffuse change in papillae tip attenuation, involving all papillae. Previous studies have determined that papillae tip attenuation was similar between stone forming and stone free kidney of patients with unilateral stones. The results of our study further support the idea that this modification might be present in all the papillae of the same patient.
The population analyzed in our study is not a sample of a general population, but represents the population undergoing abdominal uCTs in a general hospital. As the abdominal CT is more and more accessible and used for diagnosis, this population is growing. This is the target population for clinical applicability of this concept, as in this population, the early diagnosis of calcifications in the tip of the renal papillae and the identification of a high-risk group could be possible.
The initial diagnosis, which established that all patients were stone free, was performed with an abdominal CT. One of the limitations of our study is the fact that for the follow-up, we used not only abdominal CT images but also ultrasound and KUB/IVU images. The abdominal CT has a high sensitivity and specificity of 98% and 100%, respectively. 11 Abdominal ultrasound has a sensitivity, described in prospective studies, of 44%–81% and specificity of 82%–100%. 11,12 KUB also has a sensitivity of 44%–77% and specificity of 80%–87% with IVU having better detection rates especially for ureteral stones up to 96%. 11 The use of ultrasound and KUB alongside the abdominal CT for the follow-up might have, due to a lower sensitivity, failed to diagnose some asymptomatic patients with active SD. On the other hand, ultrasound and, to a lesser extent, KUB are widely used today for follow-up and screening for SD and for that, our results are similar to real daily practice results.
One of the limitations of our study could be the fact that we included patients who were scanned using two different CT scanners. This can be criticized from the point of view of measured attenuation because there might be differences in the contrast and noise of the imaging data. Nonetheless, an inclusion criterion was the requirement that all uCTs were performed in our center. Our scanners are fine-tuned by the manufacturer (the same for both machines) to produce similar/identical results and thus, attenuation measured on a CT scan acquired by any of our scanners should generate the same result.
In addition, the use of 5 mm slice thickness could be criticized. When reconstructing the CT slices, the computer uses volume averaging to calculate the mean density of the tissues in a slice. When bigger slice thickness is used, more tissue is condensed into the same image on CT, changing the final measured attenuation. Therefore, small calcifications could get diluted. The attenuation results could be lower when measured in 5 mm slice thickness than when using 1 mm slides. However, subanalyses of the patients who had 1 mm slides available demonstrated that there were no significant slide thickness dependent differences.
Another limitation is the fact that not all the stones were obtained and analyzed. We used surrogate criteria like visibility on plain KUB or uCT attenuation value. Stone radioopacity is widely accepted as a good criterion for the diagnosis of CS. 13 The abdominal CT also has a high sensitivity and specificity of 92% and 61% for the differential diagnosis of uric acid and CS. 14 The lowest attenuation for a CS measured on uCT was 619HU, and all patients had negative urine cultures. Previous studies showed that a cut point of 600HU has a high sensitivity and specificity for separating uric acid and CS. 14 All stones identified by KUB/IVU were radioopaque, and the patients had negative urine cultures, all this being highly suggestive of CS.
The design of our study did not allow for a direct analysis of stones in most cases. That generates the possibility of having included patients with struvite stones, as the HU density of struvite stones is similar to that of CS. Clearly, a negative urine culture cannot exclude the possibility of a struvite stone. Nonetheless, patients with struvite stones are known to have to a greater degree positive urine cultures. Results from different studies are variable ranging up to 88% versus 26% for calcium stone formers. 15,16 The fact that all urine cultures came out negative does not exclude struvite stone, but at least lowers the possibility of having included patients with struvite stones.
The Randall theory explained the formation of stones, but had no translation to clinical practice. Nonetheless, the possibility of measuring in a quantitative manner, the presence of calcium deposits in the tip of the renal papillae opened a possibility for this theory to be brought to day-to-day clinical practice. A cut point of 43 HU identifies a population that has a 53% chance of developing SD over 7 years. Furthermore, higher attenuation values are indicators of higher risk of developing SD. This gives us the possibility of identifying people at risk among those who undergo abdominal CT for whatever reason and to offer them personalized counsel and, if needed, prophylactic therapy.
Conclusion
Patients with high papillae density have a higher risk of developing SD. These findings reinforce the Randall's plaque theory of stone formation. A cut point of 43HU could accurately be used to identify a high-risk population.
Footnotes
Disclosure Statement
No competing financial interests exist.