




Abstract
Objective:
To identify kidney stone characteristics that will determine either success or failure of a percutaneous nephrolithotomy (PCNL) and design a classification system to predict results according to these characteristics.
Materials and Methods:
One hundred thirty-eight patients were assessed with multislice abdominal and pelvic CT before and after PCNL. With regard to pyelocaliceal stone distribution, we classified our patients in two groups that we called “no extra stone in middle calix” (NESMC) and “extra stone in middle calix” (ESMC), according to the difficulty in reaching the stones. We did a univariate and a multivariate analysis, as well as a receiving operating curve (ROC) of the proposed classification, based on the foreseen probabilities, to determine the diagnostic yield.
Results:
Global residual lithiasis (RL) was 26.08%. The proportion of patients with RL according to classification was NESMC 11.5% and ESMC 59.5%. In the univariate logistic regression analysis of the distribution, number, total volumetry, side, type, radio-opacity of stones, and the presence or not of preoperatory urinary tract infection, the variables related to RL were the distribution (11.3; 95% confidence interval [95% CI] 4.7, 27.4), volumetry (odds ratio [OR] 1.01; 95% CI 1.004, 1.014), and the presence of staghorn stones (OR 6.64; 95% CI 2.463, 17.905). In the multivariate analysis, distribution was statistically significant (OR 8.687; 95% CI 2.69, 28.06), whereas total volumetry and the presence of staghorn stones were not (OR 1; 95% CI 1.000, 1.000 and OR 2.7; 95% CI 0.35, 20.57, respectively). The ROC showed an area under the curve of 0.77.
Conclusion:
In our experience, the distribution of kidney stones is the most important predictor of RL after PCNL. The results also suggest that the presence of stones in the middle calix has a direct impact on the stone-free rate. We put forward a simple and reproducible classification, easy to apply, and useful to estimate the chances of success of the procedure using preoperatory CT scans.
Introduction
U
A recent publication from the Clinical Research Office of the Endourological Society (CROES) reported a SFR of 75.5%. 5 Clinical results vary widely due to the stones' characteristics, where bigger and more complex stones show lesser SFRs and higher complication rates. 4 –7
Before PCNL, it is mandatory to do X-rays to identify the number, size, and stone location; plan the surgical approach; and assess success and complications after the procedure. 7 –9
Several prediction PCNL result models have been proposed according to the preoperatory characteristics of the patients and the stones, 10 –15 but we found great diversity in the measurement of the preoperatory stone burden as well as in the definition of SFR among the different publications, thus giving us diverse results.
Our objective was to identify the characteristics of the stones, which would determine either the success or the failure of the PCNL. For that purpose, we designed a classification system, which would allow us to predict results, based on the above-mentioned characteristics.
Materials and Methods
We retrospectively studied 332 patients, between October 2009 and March 2013, who had undergone PCNL in our Urology Department of the Italian Hospital in Buenos Aires. The procedure was carried out by two urologists with expertise in this surgical technique. Only those patients with both preoperative and postoperative multislice abdominal and pelvic CT were included in this article. The sample was thus reduced to 138 patients.
From each patient, we collected data such as age, gender, and presence of preoperatory urinary tract infections (UTIs). As mentioned before, all patients were evaluated with preoperatory CT to assess the number, distribution, side (right or left), radio-opacity, previous treatment, and type (staghorn or nonstaghorn) of stone. A staghorn stone was defined as a stone that simultaneously occupies the renal pelvis, the superior, the middle, and the inferior calices.
We also measured the latero-lateral (LL), the anteroposterior (AP), and the cephalocaudal (CC) maximum diameters in transversal and coronal CT views. The stone volumetry was calculated as follows: LL×AP×CC×π (3.14)×0.167 (mm3). 16 In those cases with multiple stones, the total volumetry was calculated as the sum of the individual volumetries.
With regard to stone distribution in the pyelocaliceal system, the patients were classified according to stone distribution and the degree of difficulty in reaching them (estimated before the procedure), as well as being based on the expertise of the urologists and the data extrapolated from the preoperatory CT. We were then able to define two groups that we called “no extra stone in middle calix” (NESMC) and “extra stone in middle calix” (ESMC). NESMC includes those patients with stones in the renal pelvis and/or upper ureter and/or one calix or those patients with stones in both upper and lower calices. ESMC includes those patients with simultaneous stones in the lower and middle calices, patients with simultaneous stones in the upper and middle calices, or the patients with staghorn stone (Fig. 1).
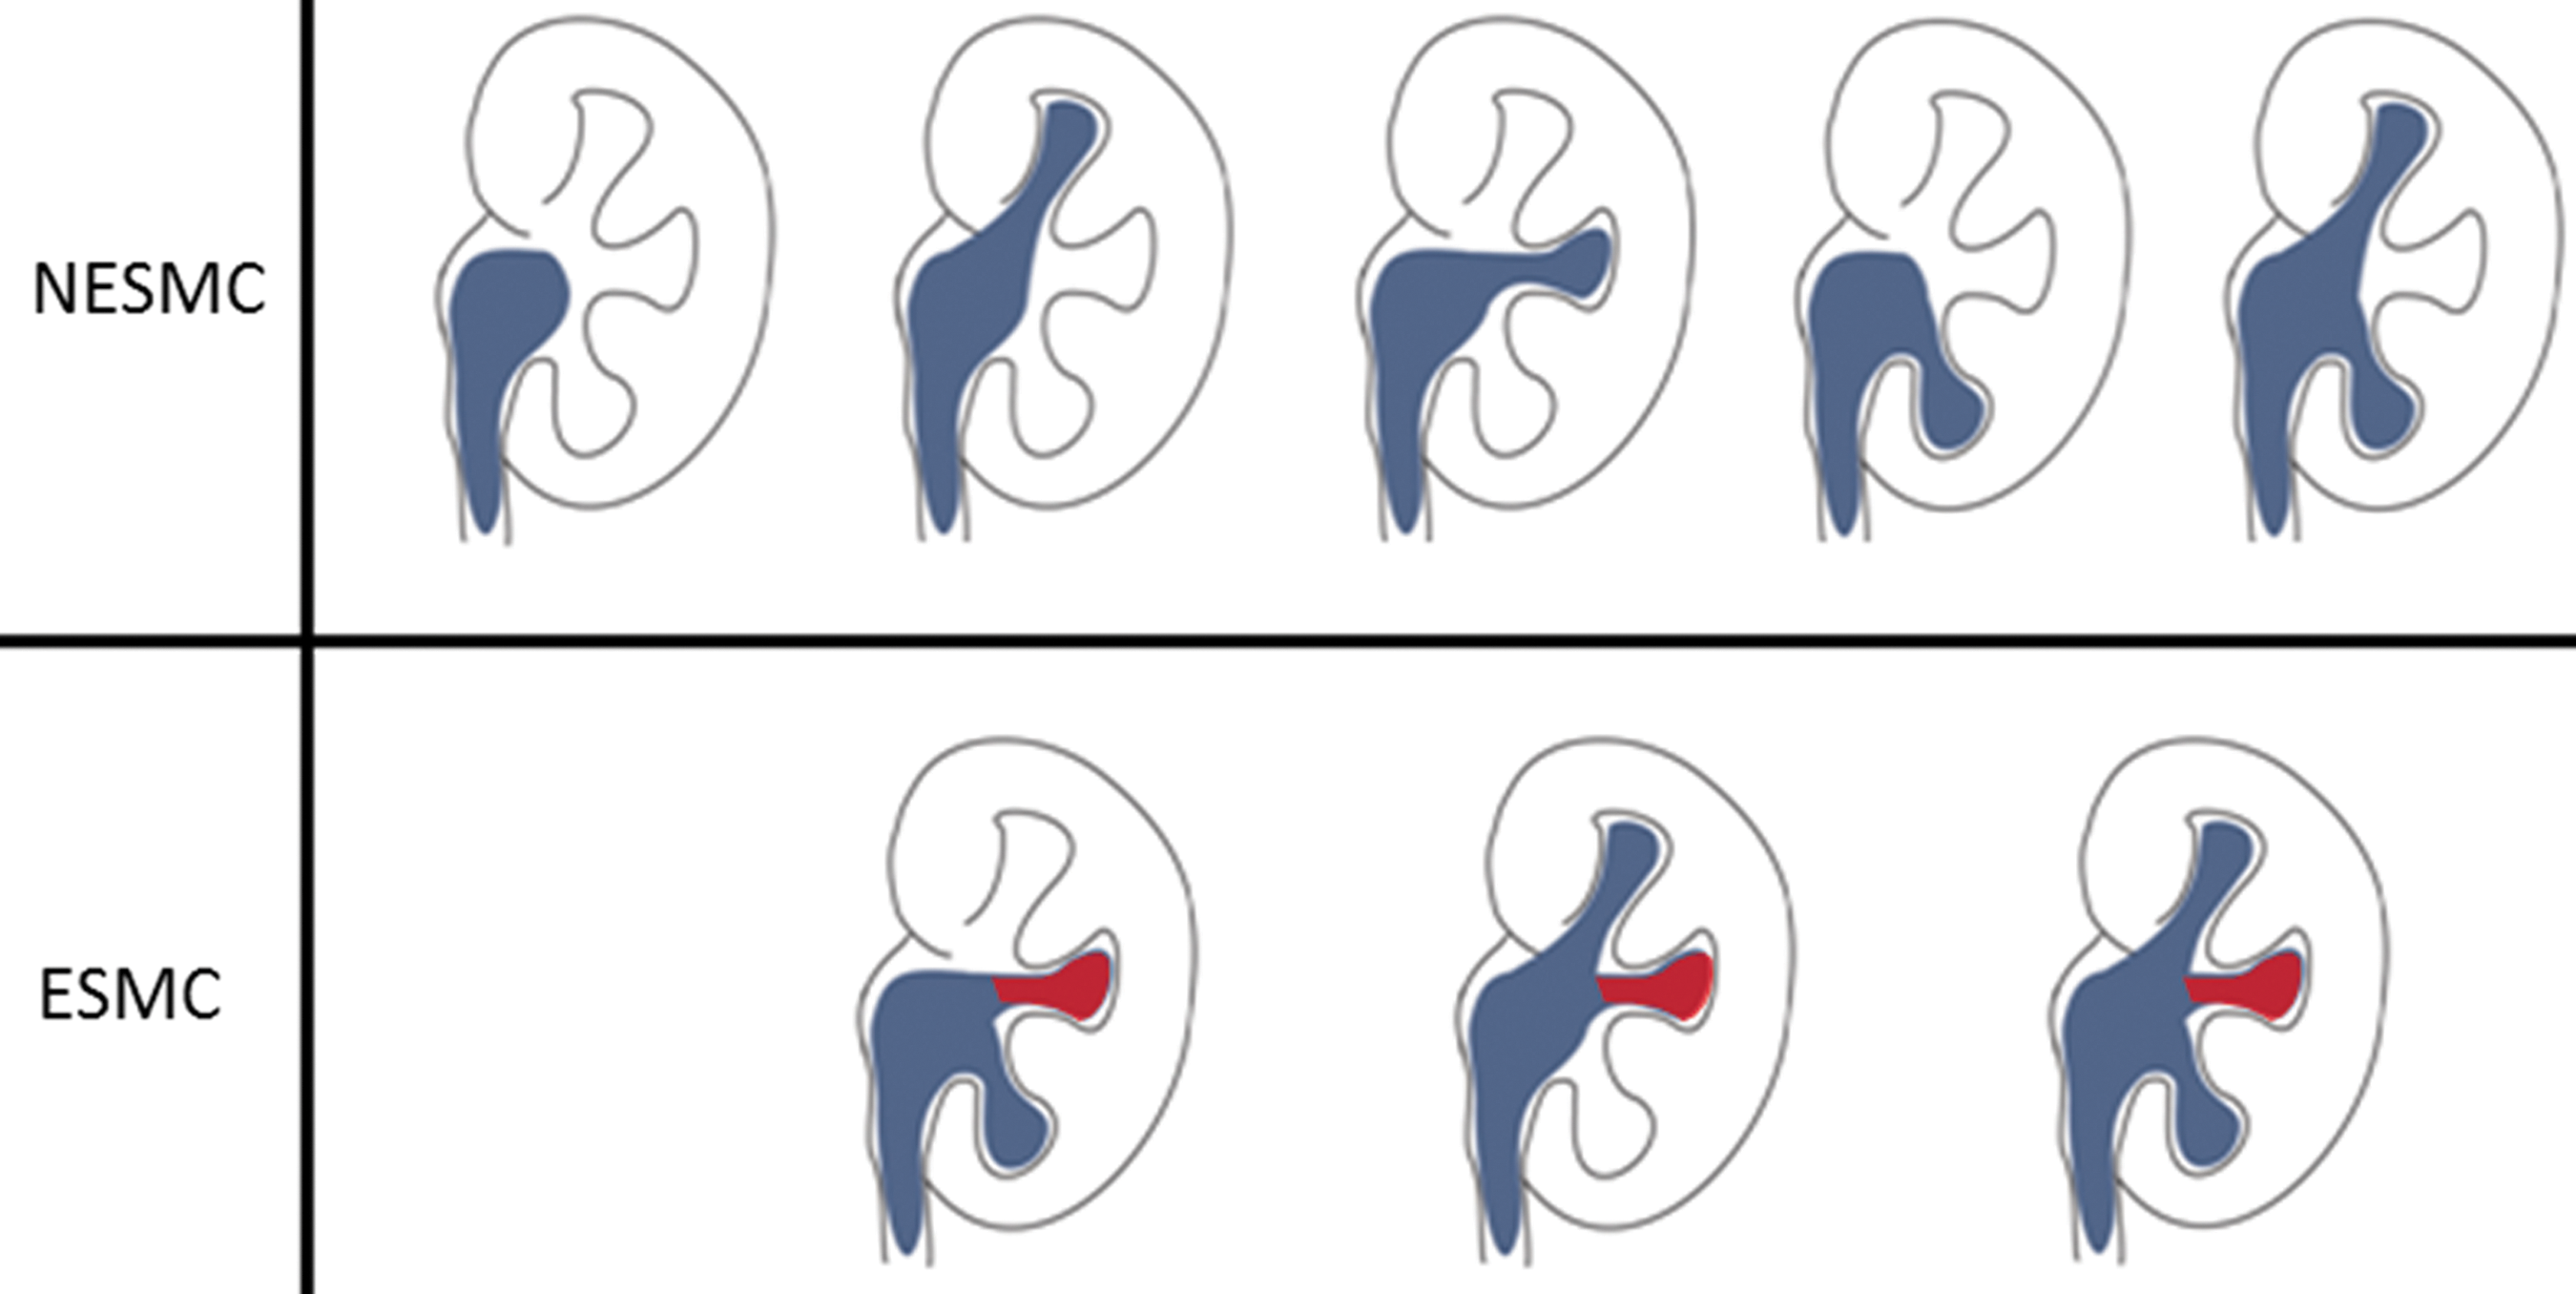
Stone distribution pattern according to classification. NESMC=no extra stone in middle calix; ESMC=extra stone in middle calix.
All patients were assessed with CT 24 hours after surgery, defining residual lithiasis (RL) as any stone observed in the postoperative CT. 17
All PCNL procedures were carried out with the patient placed in intermediate supine decubitus. The renal access was obtained due to a subcostal or 11th intercostal space, under radioscopic control, using an 18-gauge needle puncture. The tracts obtained were dilated with Alken dilators from 24F to 28F. Amplatz sheaths were placed. Pneumatic or laser energy was used to fragment the stones extracted with graspers. In all the cases, a 20F Foley catheter was left as nephrostomy drainage.
Statistical analysis
Continuous variables with normal distribution were expressed as mean and range. Categorical variables were expressed according to their absolute value and percentage.
We did a univariate and multivariate logistic regression analysis to asses all the preoperatory characteristics that determine the presence of RL. We included the number of stones (multiple vs single), total volumetry (mm3), side (left or right), type of stone (staghorn vs nonstaghorn), radio-opacity (radio-opaque vs radiolucent), preoperatory UTI (infection vs no infection), as well as the distribution of the stones. Apart from that, we also included relevant data from the patients. For the multivariate analysis, we took into account all the relevant variables from the univariate analysis or those variables that were biologically significant. Finally, we did the receiving operating curve (ROC) of the proposed classification based on the foreseen probabilities to determine the diagnostic yield. Both in the univariate and the multivariate analysis, we used odds ratio (OR) as the risk measure and its 95% confidence interval (95% CI).
A p<0.05 or an OR with 95% CI (excluded 1) was considered statistically significant, and the software used was SPSS 18.0®.
Results
We assessed 138 patients with an average age of 55.4 years. Most of the patients were males and for more than 50% of the patients, PCNL was their first treatment. The rest of the patients had undergone ESWL or needed a pigtail stent.
Stones were evenly distributed on both sides, most of them were radio-opaque and single. Staghorn calculi represented 15.2% of the cases and mean total volumetry was 5815 mm3.
Stones were distributed according to the classification among the two proposed groups as follows: NESMC 69.5% and ESMC 30.5%. The proportion of patients with RL between groups was NESMC 11.5% and ESMC 59.5%.
Average surgical time was 85 minutes and the patients' average time in hospital was 50 hours.
Out of the 138 patients assessed, 26.08% had RL (Table 1).
ESWL=extracorporeal shock wave lithotripsy; UTI=urinary tract infection.
In the univariate logistic regression analysis of the distribution, number, total volumetry, side, type, radio-opacity of stones, and the presence or not of preoperatory UTI, the variables related to RL were distribution (11.3; 95% CI 4.7, 27.4), volumetry (OR 1.01; 95% CI 1.004, 1.014), and the presence of staghorn stones (OR 6.64; 95% CI 2.463, 17.905).
In the multivariate analysis, the distribution was statistically significant (ESMC: OR 8.6; 95% CI 2.6, 28.06), whereas total volumetry and presence of staghorn stones were not (OR 1; 95% CI 1.000, 1.000 and OR 1.03; 95% CI 0.13, 7.8) (Table 2).
Bold type indicates statistically significant values.
95% CI=95% confidence interval; ESMC=extra stone in middle calix; NESMC=no extra stone in middle calix.
We did a ROC based on the design's foreseen probabilities and we calculated the area under the curve (AUC) in 0.77 (95% CI 0.67, 0.86), and we considered this value as an adequate adjustment for the design.
Discussion
To plan an effective surgical approach, the key is to study, before surgery, with X-rays images, the complexity of the pyelocaliceal system.
As stated before, several prediction PCNL result models have been proposed according to the preoperatory characteristics of the patients and the stones. 10 –15 Thomas and colleagues developed the Guy Stone score to grade the complexity of each case based on X-ray findings. 13 Smith and colleagues 14 proposed a nomogram that might predict the PCNL result in accordance with clinical and radiological data that support the idea that lithiasis burden is the most accurate factor to predict the SFR. Jeong and colleagues, 15 on the other hand, asserted that the intrarenal stone distribution has a greater influence on the SFR than the number and size of the stones. They proposed the Seoul National University Renal Stone Complexity (S-ReSC) scoring system to predict the SFR after PCNL. This system gives a predetermined value according to the stone location in the pyelocaliceal system, and according to this scoring system, the patients are divided into low-, medium-, and high-risk groups for the development of residual stones after PCNL.
However, we found great diversity in the measurement of the preoperatory stone burden as well as in the definition of SFR among the different publications, thus rendering diverse results. 17 Some authors define stone burden as the maximum diameter in the kidney, ureter, and bladder radiograph (KUB), 10 while others define stone burden as the maximum diameter in the CT. 11 Others measure the stone area (mm2) in the KUB, 14 whereas Jeong and colleagues 15 measure the stone volume (mm3) in the CT.
Smith and colleagues 14 define SFR as the absence of visible fragments in the KUB or the presence of fragments smaller than 4 mm; Zhu and colleagues 10 define it as the absence of lithiasis in the KUB 1 week after the procedure, whereas Shahrour and colleagues 11 and Jeong and colleagues 15 define it as the absence of lithiasis in the postoperative CT. For this reason, results can vary between 51% and 80% (Table 3).
KUB=kidney, ureter, and bladder radiograph; SFR=stone-free rate.
Some authors have proposed different models to identify predicting factors for the SFR after PCNL, 11,18 the size of the stones, number, location, and pyelocaliceal system anatomy being the most relevant ones. Other authors 10 suggest that the most important predicting factors are the number, size, stone location, presence of staghorn calculi, and moderate to severe hydronephrosis.
Several models have been designed to predict the SFR based on these aforementioned data, for example, the Guy's Stone Score 13 that classifies lithiasis into four categories according to the number, location, simple versus complex anatomy, and the presence of staghorn stones. The SFR results vary from category 1 to 4 as follows: 81%, 72.4%, 35%, and 29%. Nevertheless, this score does not mention the predictive accuracy of the method nor a validation system.
Mishra and colleagues 19 propose the Staghorn Morphometry based on stone burden and pyelocaliceal anatomy using software that measures volume in CT. They classify staghorn stones into three groups: the first group with lithiasic volume<5000 mm3 and less than 5% of unfavorable calices; the second group comprising all those patients between the first and the third group; and the third group with lithiasic volume>20,000 mm3 and more than 10% of unfavorable calices. They define as unfavorable those calices displaying a sharp angle (without specifying a cutoff point) and an infundibulum smaller than 8 mm. This classification uses specific measurements and requires special software, making it a difficult method to use in daily clinical practice.
Based on our experience, we think that the intrarenal stone distribution is more important than total volume and stone number, because if we can effectively reach the calices, it should be feasible to remove all stones. We therefore propose a classification that groups the patients according to stone distribution and the degree of difficulty to reach the stones. It is worth mentioning that in those patients with stones in two calices, the rate of success might be lower whenever the middle calix is involved. Sampaio and colleagues 20 describe the pyelocaliceal system morphology after evaluating 140 resin molds from 70 cadavers and proposed 2 groups. The first group encompasses the patients with an upper and lower calix and the middle calix draining into either of them, whereas the second group puts together all patients where the middle calix has an independent drainage. For that reason, simultaneous upper calix+middle calix or lower calix+middle calix shows greater difficulty than upper calix+lower calix.
Jeong and colleagues 15 advocate for the S-ReSC, which takes into account the number of sites involved in nine predetermined locations within the pyelocaliceal system, grouping their patients into three categories according to their low, medium, and high risk of having RL (4%, 31%, and 71.1%, respectively) and obtaining a statistically significant difference among the groups. In our classification, the proportion of patients with RL increased significantly between groups.
In the univariate analysis, the distribution, volumetry, and presence of staghorn calculi were significant, whereas in the multivariate analysis, only the distribution was statistically significant. Likewise, in Jeong and colleagues experience, only the S-ReSC was significant in the multivariate analysis.
An ideal predictor model in medicine should be exact, adequately calibrated, simple, reproducible, and clinically significant. 21 –23 We choose to use as a diagnostic test the ROC curves, as it is a global and independent measure of the cutoff point. The adjustment to the model is estimated with the AUC, and this area ranges between 0.5 and 1, where 1 means the perfect diagnostic value and 0.5 means a test without discriminatory diagnostic ability. Our classification had an AUC of 0.77; meaning there is a 77% probability that the model is more correct for the chosen case than for a healthy random patient. Consistent with the established intervals, this value would match a good test. 24
The limitations of our present article include the small sample of patients and the fact that many of them had to be excluded because they had not had a preoperatory CT done, and there could be a selection bias too in either underestimating or overestimating our values. We also believe that our classification should be validated both internally and externally.
Conclusion
As a conclusion we can state that, at least in our experience, the distribution of kidney stones in the pyelocaliceal system is the most important predictor factor of RL after PCNL. The results also suggest that the presence of stones in the middle calix has a direct impact on the SFR. We put forward a simple and reproducible classification that is also easy to apply in daily clinical practice and useful to estimate the chances of success or failure of the procedure using data from preoperatory CT.
Footnotes
Disclosure Statement
No competing financial interests exist.