
Abstract
Introduction and Objectives:
The mineral composition of a urinary stone may influence its surgical and medical treatment. Previous attempts at identifying stone composition based on mean Hounsfield Units (HUm) have had varied success. We aimed to evaluate the additional use of standard deviation of HU (HUsd) to more accurately predict stone composition.
Methods:
We identified patients from two centers who had undergone urinary stone treatment between 2006 and 2013 and had mineral stone analysis and a computed tomography (CT) available. HUm and HUsd of the stones were compared with ANOVA. Receiver operative characteristic analysis with area under the curve (AUC), Youden index, and likelihood ratio calculations were performed.
Results:
Data were available for 466 patients. The major components were calcium oxalate monohydrate (COM), uric acid, hydroxyapatite, struvite, brushite, cystine, and CO dihydrate (COD) in 41.4%, 19.3%, 12.4%, 7.5%, 5.8%, 5.4%, and 4.7% of patients, respectively. The HUm of UA and Br was significantly lower and higher than the HUm of any other stone type, respectively. HUm and HUsd were most accurate in predicting uric acid with an AUC of 0.969 and 0.851, respectively. The combined use of HUm and HUsd resulted in increased positive predictive value and higher likelihood ratios for identifying a stone's mineral composition for all stone types but COM.
Conclusions:
To the best of our knowledge, this is the first report of CT data aiding in the prediction of brushite stone composition. Both HUm and HUsd can help predict stone composition and their combined use results in higher likelihood ratios influencing probability.
Introduction
T
We aimed to identify whether or not the added value of standard deviation of HU (HUsd) could be used for more accurate prediction of stone composition.
Materials and Methods
Both centers involved in the study, the University of Western Ontario in London, Ontario, and Lenox Hill Hospital in New York, New York, obtained institutional review board approval. A retrospective chart review was performed to identify patients who had undergone a surgical procedure for urinary tract lithiasis between 2006 and 2013. Patients were eligible for analysis if the mineral composition of a stone fragment retrieved during the procedure was available and if the patient had undergone an abdominopelvic noncontrast CT no more than 6 months before the procedure. CT images were obtained with a GE Discovery HD 750 with a tube voltage of 120 kV and automated mA, in London and a Philips Brilliance with a tube voltage of 140 kV and 400 mA in New York. All images were obtained with a 5 mm slice thickness.
The images were reviewed by a blinded urologist or radiologist in each center with standardized measurement guidelines. The size of the stones was measured in the coronal plane. The size was calculated using the formula of an ellipse with longest diameter x perpendicular diameter x π/4. The stone density was measured by drawing a region of interest (ROI) within the stone limits using the bone window on the axial CT slice depicting the largest surface area. In the case of multiple stones, the density of the largest stone was measured. The mean Hounsfield Units (HUm) and standard deviation of Hounsfield Units (HUsd) were automatically reported by the CT software as measurements within this ROI and were collected for analysis. As the density of stones smaller than 5 mm measured on NCCT images with 5 mm slice thickness is likely to be underestimated, 24 stones smaller than 5 mm in any dimension were excluded.
Mineral stone composition was analyzed with Fourier transform infrared spectroscopy by a single lab at each center. Both pure and mixed stones were included in this database. The stones were grouped per major contributing component (>50%) in 1 of 7 groups: calcium oxalate monohydrate (COM), calcium oxalate dihydrate (COD), cystine (Cy), struvite (Str), uric acid (UA), hydroxyapatite (HA) and brushite (Br). Stones that did not fit in any of those groups due to not having a mineral component contributing >50% of the total, were excluded from the data and not separately analyzed. In an effort to report AUCs, accuracies and likelihood ratios as accurate as possible, these stones were not left out of those analyses, as this would artificially improve our outcomes.
The HUm and HUsd were compared for each of the groups with Welch's ANOVA. Post hoc analysis was performed using Games–Howell's test. 25 Spearman correlation tests were performed to identify whether or not there is a relationship between the stone size and the stone's Hounsfield unit measurements. Predictive accuracy of the different HU measurements for each of the stone types was analyzed using receiver operative characteristic (ROC) curve analysis with area under the curve (AUC) calculation. AUC values between 0.7–0.8, 0.8–0.9, and >0.9 were considered to correspond to fair, good, and excellent predictive accuracy, respectively. 26 Cutoff values were calculated from the ROC curves using the Youden index. Likelihood ratios (LRs) were computed and applied to the pretest probabilities to obtain posttest probabilities. Data were statistically analyzed with SPSS version 22 (IBM Corp. Armonk, NY).
Results
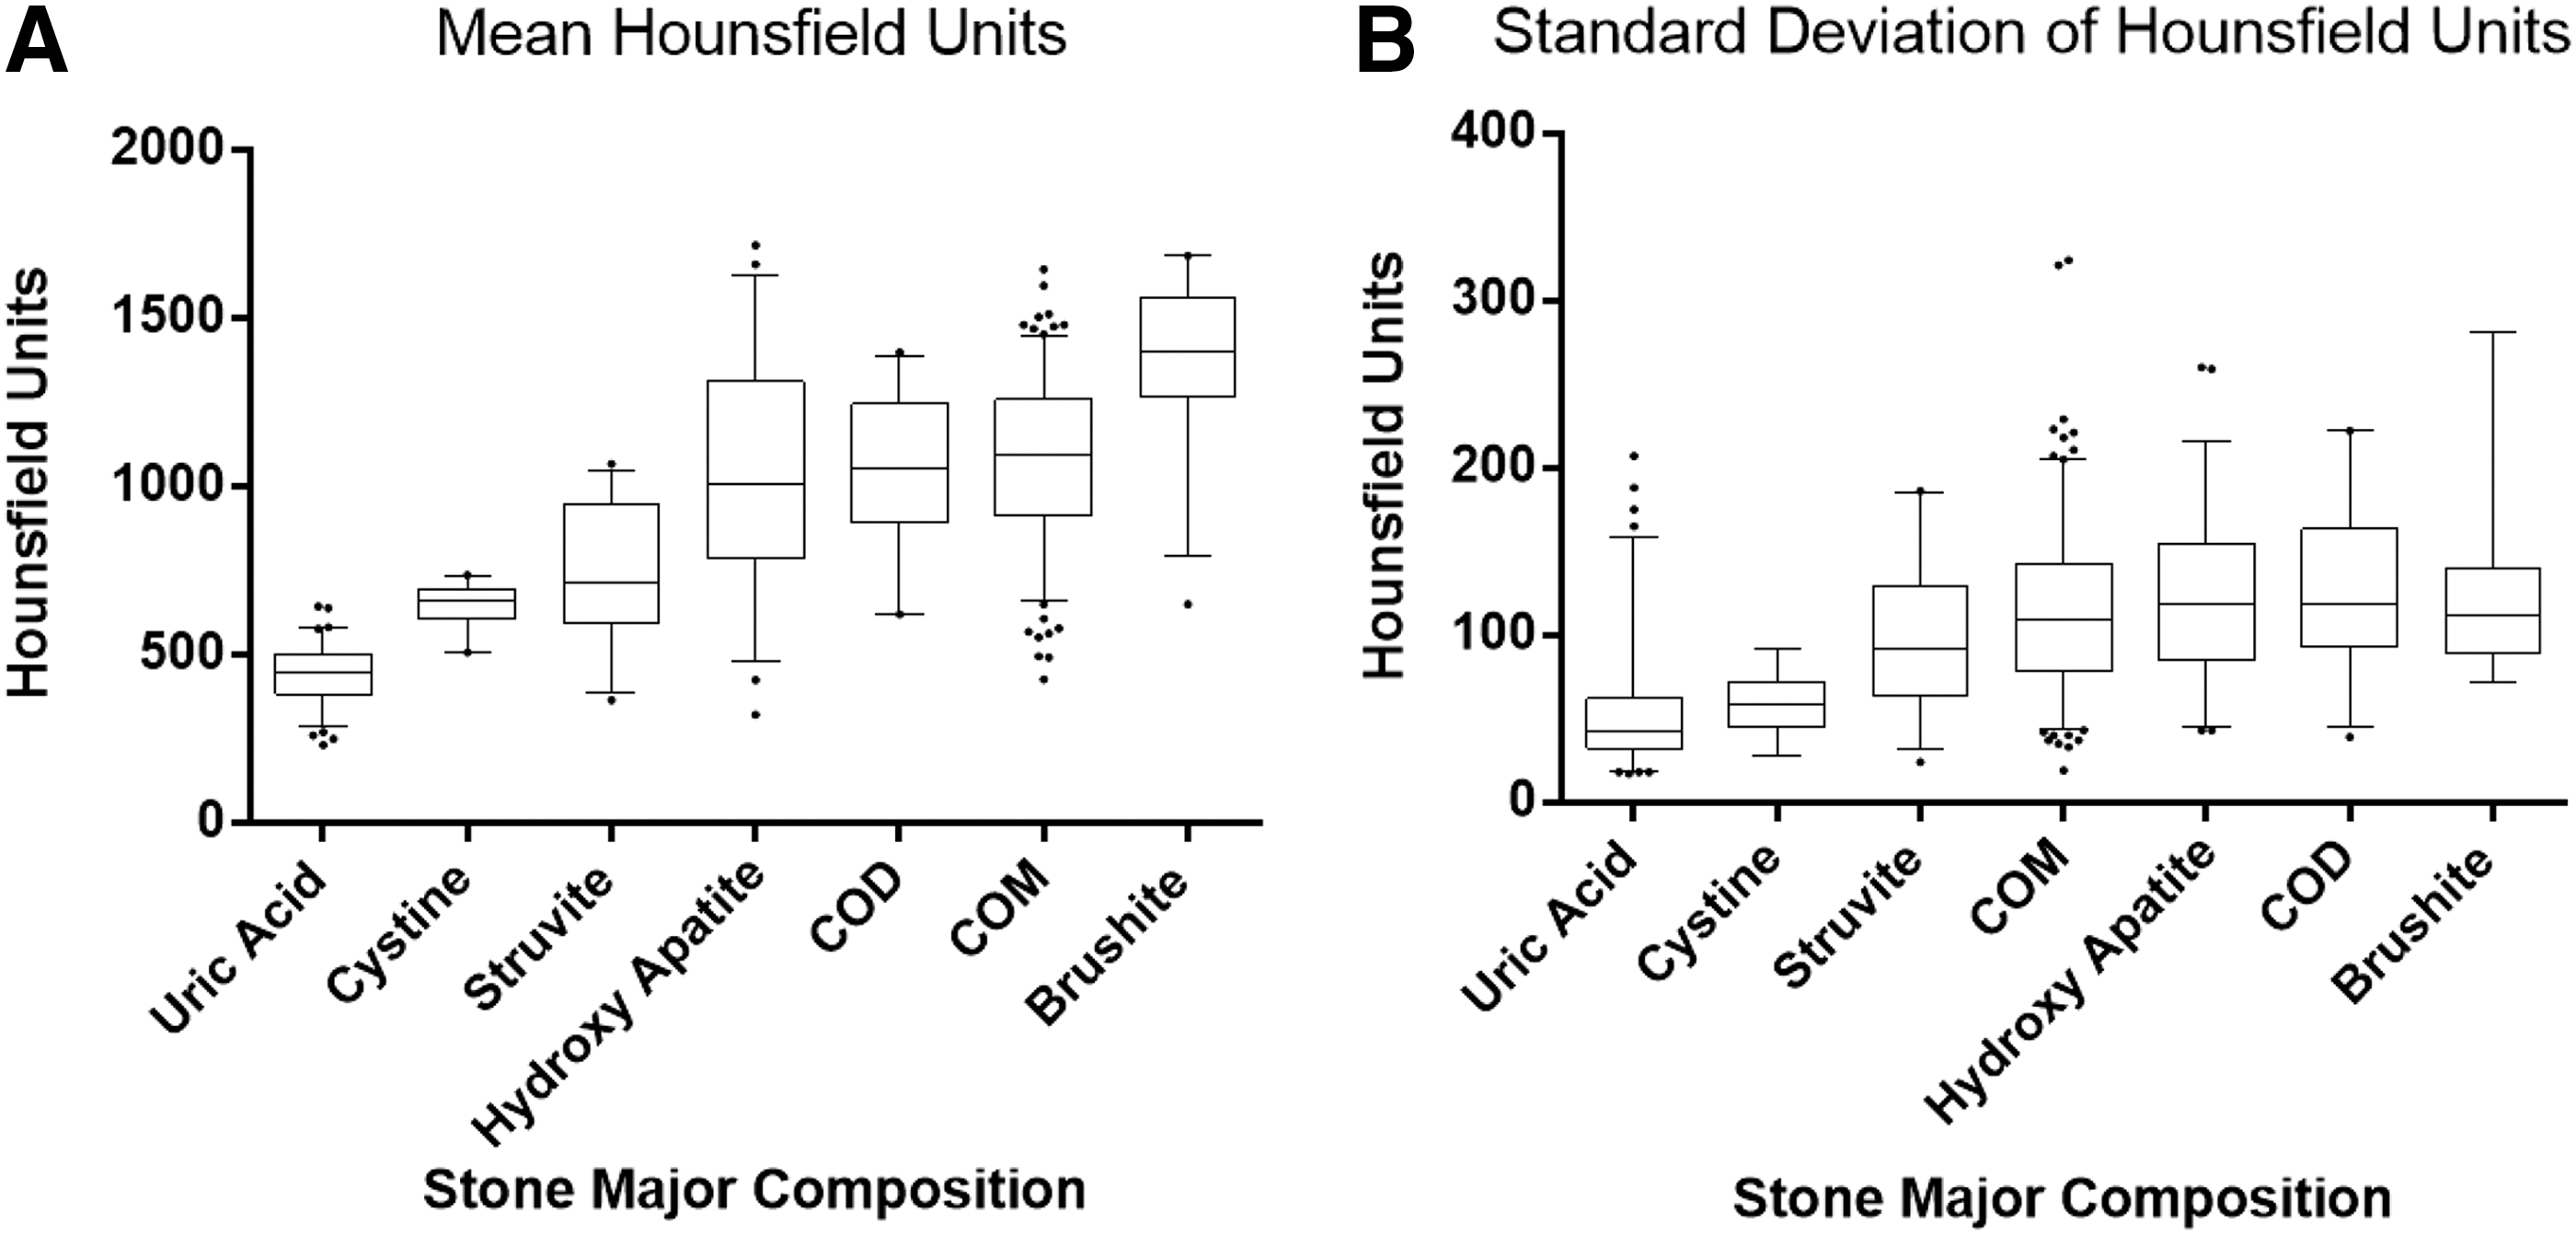
Of the 466 patients with stones included in the study, 193 had stones that were mainly composed of COM, 22 of COD, 90 of UA, 58 of HA, 35 of Str, 27 of Br, and 25 of Cy. Seven patients had a 50/50 distribution of UA and COM. There was no component contributing >50% for nine stones with three contributing chemical substances. The mean and standard deviations of HUm, HUsd, and surface area for each of the stone types are presented in Table 1.
HUm = mean Hounsfield Units; HUsd = standard deviation of Hounsfield Units; COD = calcium oxalate dehydrate; COM = calcium oxalate monohydrate; UA = uric acid; Str = struvite; Br = brushite; Cy = cystine.
On post hoc analysis, the HUm of UA (441 ± 86) and Br (1370 ± 240) stones were significantly lower and significantly higher than every other stone type (P < 0.001), respectively. Although the HUm of Str (732 ± 200) and Cy (643 ± 65) stones are significantly different from that of all other stone types (P = < 0.001), they could not be distinguished from each other (P = 0.206). COM, COD, and HA could not be differentiated from each other (Table 2 and Fig. 1).
The bold values indicate statistically significant p-values.
HA = hydroxy apatite.
The HUsd of UA (53 ± 37) and Cy (59 ± 19) stones are significantly lower than the HUsd of any other stone type (P = < 0.001), but do not differ significantly from each other (Table 3 and Fig. 2). Spearman correlation showed only a moderate positive correlation of HUm with stone size for Str stones and a weak positive correlation for COM stones (Rho: 0.488 with P-value: 0.004 and Rho: 0.306 with P-value < 0.001 respectively).
The bold values indicate statistically significant p-values.
According to the AUC calculations, the HUm is a fair to excellent predictor for UA, Br, COM, and Cy stones (AUC = 0.975, 0.882, 0.743, 0.724, respectively) and the HUsd is a fair to good predictor for UA and Cy stones (AUC = 0.866 and 0.763). The cutoff values that where calculated for HUm and HUsd for each stone type with their accompanying sensitivity, specificity, calculated positive predictive value (PPV), negative predictive value (NPV), and test accuracy are shown in Tables 4 and 5. When combining these cutoff values, we identified an increased PPV for all stone types except COM (Table 6).
AUC = area under the curve; NPV = negative predictive value; PPV = positive predictive value.
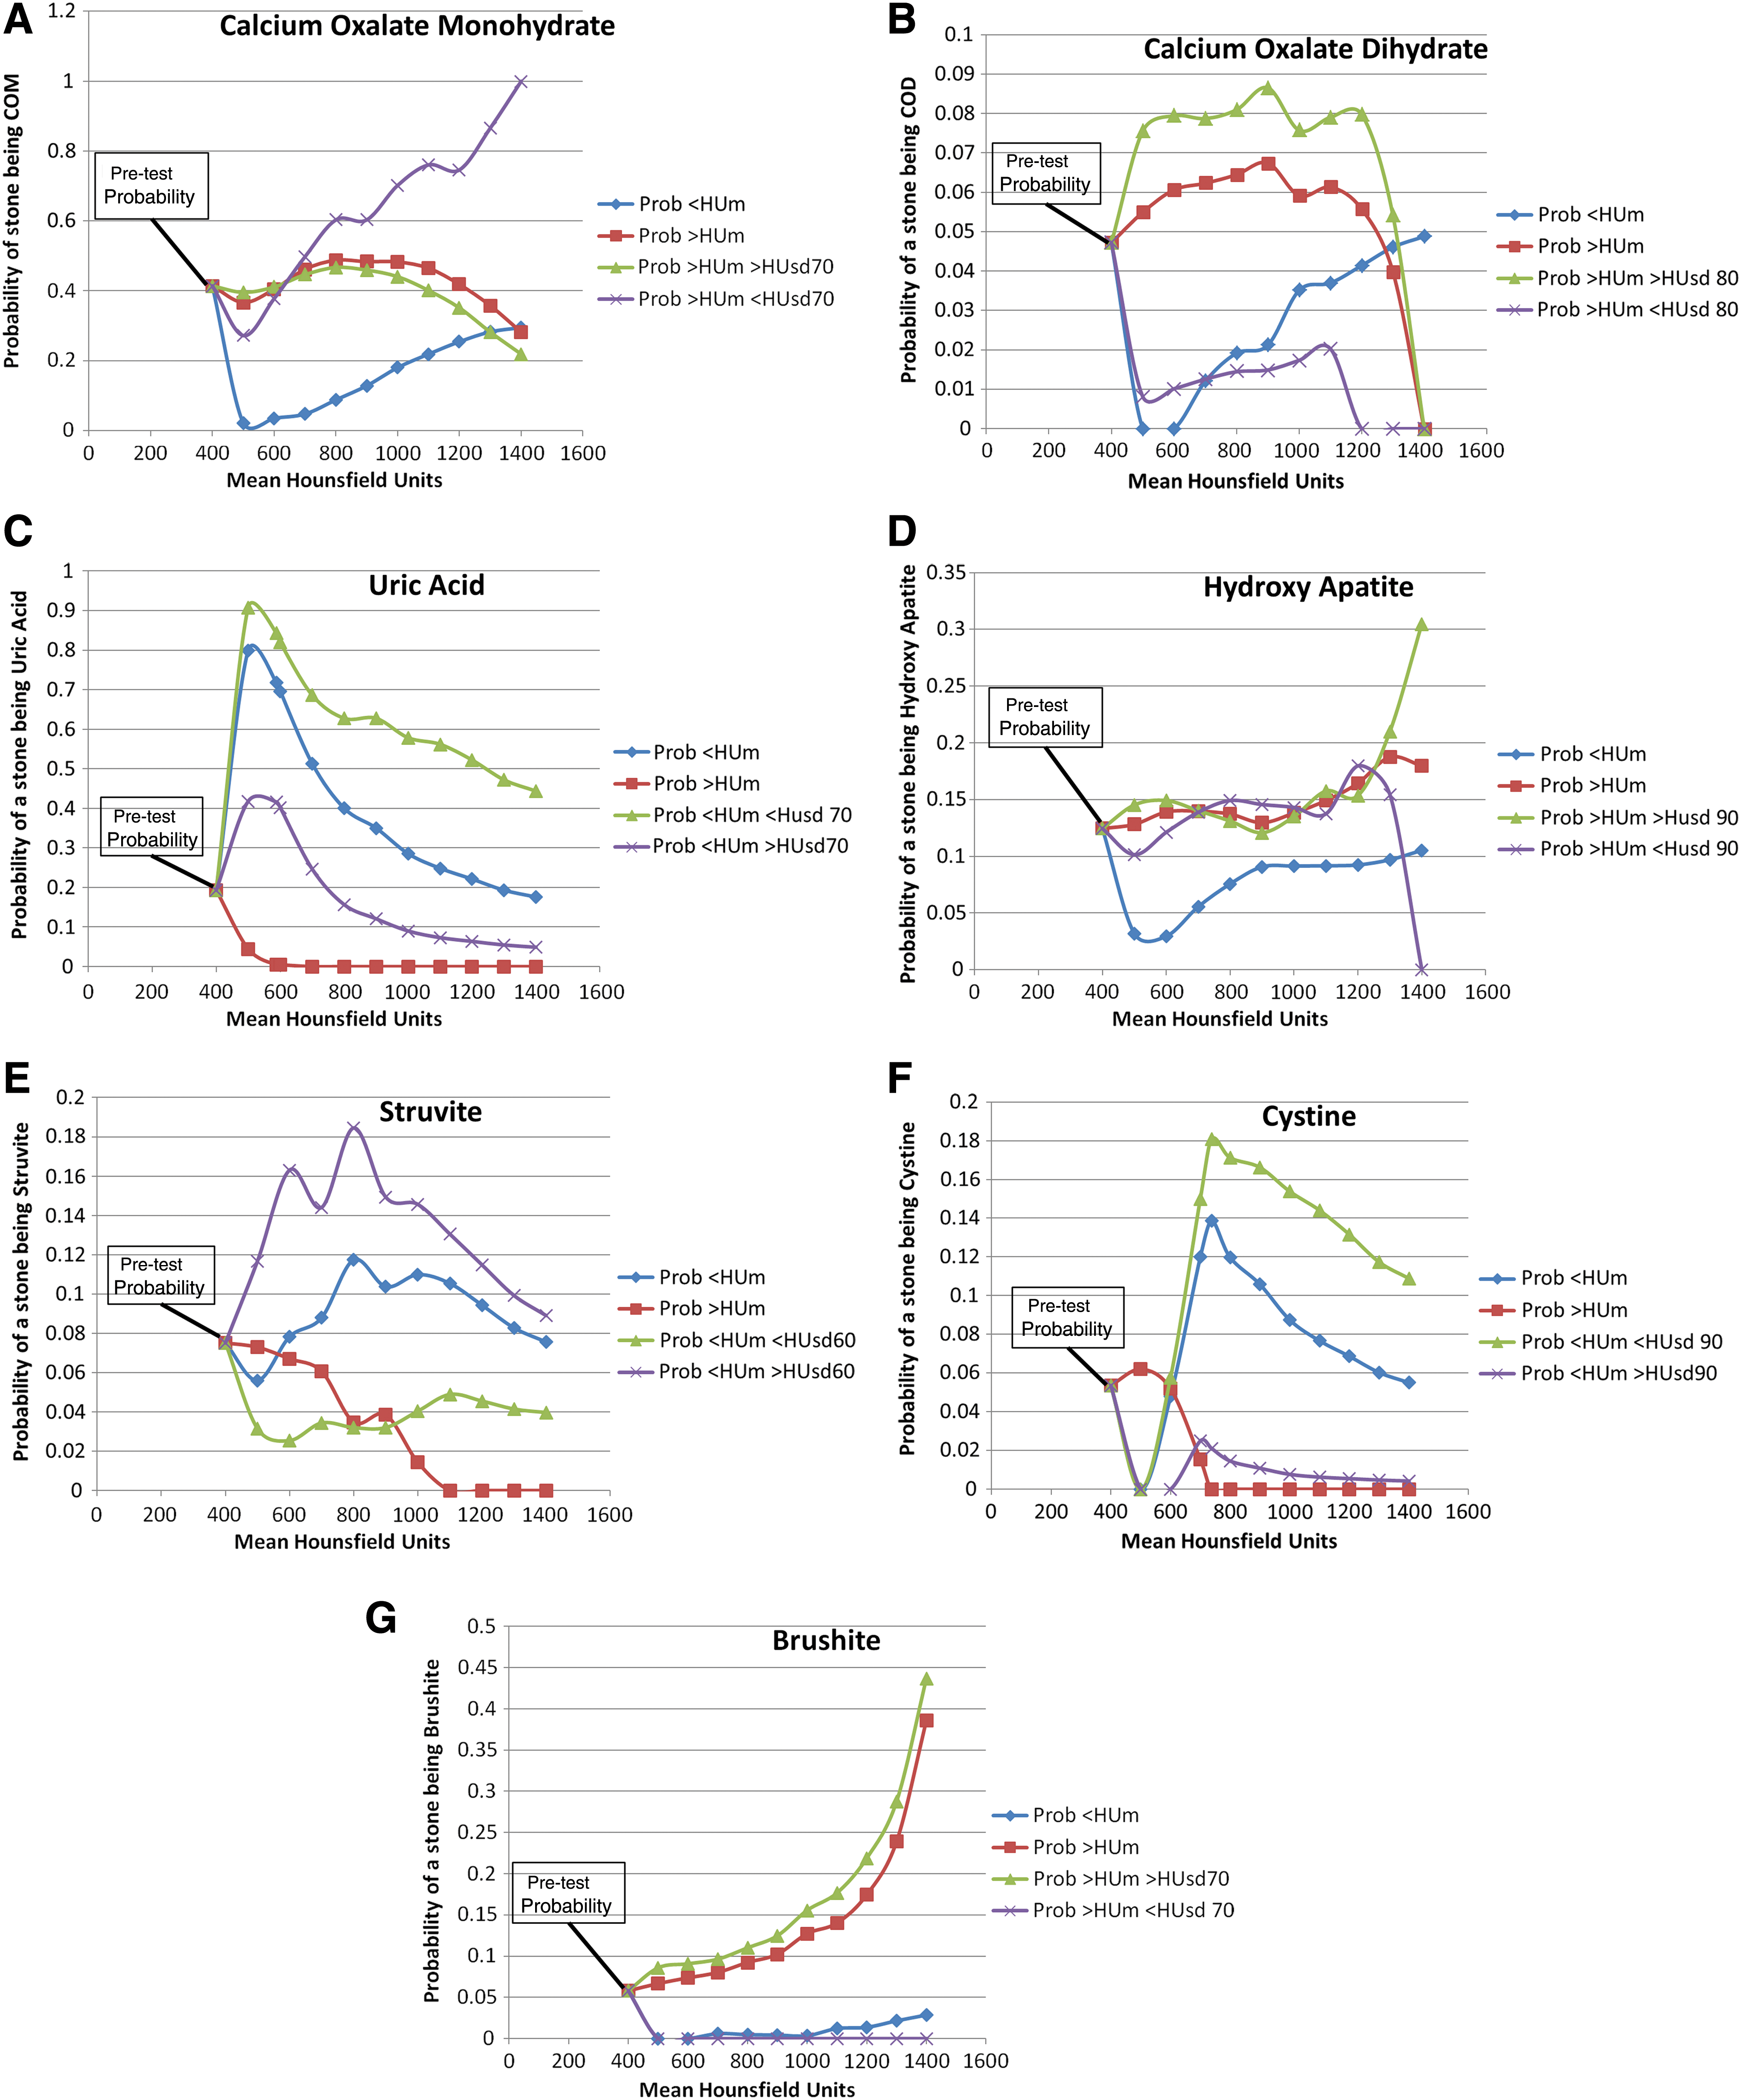
As PPV and NPV are dependent on prevalence and the current calculated values are based on the prevalence in our cohort, these values may not be applicable to each patient population. We therefore calculated LRs based on incremental cutoff values per 100 HUm, which allowed us to project posttest probabilities for all the stone types based on the cutoffs. Figure 2A–G clearly demonstrates the influence of adding a rounded cutoff value for HUsd on the posttest probabilities for each of the stone types. This effect is most apparent for UA and Cy stones, with stones that have a HUm below 500 and a HUsd below 70 having a probability of 91% of being a UA stone, whereas stones with a HUm below 500 and a HUsd above 70 have only a 42% probability of being a UA stone. Similarly, a stone with HUm below 800 and HUsd below 90 has a 17% probability of being a Cy stone, whereas that stone would have only a 1.5% probability of being a Cy stone if the HUsd was above 90. Adding HUsd as a parameter has the least influence on the probabilities of HA and Br stones.
Discussion
Many in vivo and in vitro studies have been performed to uncover the ability of preoperative imaging to predict the mineral composition of urinary stones. 14 –23,27 –36 Similar to previous reports, the average HUm of UA was significantly lower than the average HUm of all other stone types. 14 –16,18,23,36 Mostafavi et al. had likewise reported that Cy and Str could be differentiated from UA, COM, and Br, but not from each other after an in vitro evaluation of 102 pure stones. 17 To the best of our knowledge, this is the first report of Br stones having a significantly higher HUm than any other stone type in an in vivo cohort. Although brushite is a distinct stone type, it has often been grouped with HA 18,21 or COM 30 or not included in the database at all, 15,16,19,20,23,29,33 probably due to low numbers.
There are multiple reports indicating that shockwave lithotripsy (SWL) is less effective for stones with HUm more than 900–1000. 7,37 –39 Although the average HUm of cystine stones in this report is far below that threshold, we also know that cystine stones do not fragment well with SWL. 40,41 Correctly identifying a cystine stone before treatment could therefore help prevent unnecessary SWL.
In the current analysis, adding HUsd as a predictive variable increased the PPV and the probability of correctly identifying a stone's mineral composition for most stone types. Interestingly, Hillman et al. in 1984 described that including the standard deviation as a parameter increased the accuracy of correctly categorizing uric acid, struvite, and calcium oxalate stones in a small in vitro study. 19 In an in vivo analysis of 100 patients, Patel et al., however, found no significant differences in HUsd. 36 To date, the influence of this parameter on probability ratio has not been previously reported.
The use of multiple parameters to aid in identifying a certain stone type has been attempted before. Nakada et al. have reported that the stone size may aid in identifying a certain stone type. 14 They developed a formula for HU density (HUd) by dividing the HUm by the stone size in mm. A value below 80 would be indicative of a stone being UA. When applying this formula to our data, we see that not only UA but also Cy and Str stones have a HUd below 80. Interestingly enough, 75% of the Br stones also have a HUd <80. Williams et al. pointed out that this HUd is not linear and that the HUm plateaus with increasing stone size. 42 This HUd as proposed by Nakada et al. may therefore adjust for lower HUm in small stones, but will be artificially low for larger stones, limiting its utility in a data set including large stones. Adding HA-supersaturation as a parameter did not improve predictive accuracy in distinguishing HA stones from COM/COD stones with dual-energy CT in a study by Liu et al. 43 Spettel et al., however, demonstrated that adding the patient's urinary pH with a cutoff of <5.5 to the HUm increased the PPV for UA stones. Similarly, it has been shown that a more alkaline urine predisposes for HA, Str, and Br stones. 44,45 Although these data were not available for analysis, we believe that incorporating these and other patient variables in an algorithm together with HUm and HUsd may help to increase the predictive accuracy of a stone's mineral composition.
There is a possibility that the stone composition reported for each stone is not fully representative of the entire stone's mineral composition as only fragments of the stone are sent for analysis. As the density measurements are only performed on one CT slice, it is equally possible that the HU measurements are not fully representative of the entire stone's CT density and thus the mineral composition. Despite this possible bias, this methodology reflects that clinical practice and significant differences were nonetheless identified between the different stone types. More elaborate measurements at different sections of the stone and analysis of the complete stone sample would be required for more rigorous data analysis.
Grosjean et al. have demonstrated that different CT scanners may procure different HU values for the same stone in an in vitro model. 28 Although these in vitro results cannot be extrapolated to in vivo due to differences in scanning methods and surrounding medium, 27,31 the use of two different scanners may be a possible limitation in our multicenter study. As our results show significant differences between the different stone types despite this possible limitation, we argue that this strengthens generalizability of our data. Additionally, it has been previously demonstrated that HU measurements would yield similar results on a low-dose and conventional non-contrast CT. 46,47
Conclusion
The combined use of HUm and HUsd with the proposed cutoff values increases the accuracy of predicting a urinary stone's composition. The likelihood ratios calculated in this study need to be prospectively validated and perhaps refined with a larger data set to empower these observations.
Footnotes
Author Disclosure Statement
No competing financial interests exist.