
Abstract
Objectives:
To evaluate the variation of interpretation of the same bladder urothelium image in different Storz Professional Image Enhancement System (SPIES) modalities. SPIES contains a White light (WL), Spectra A (SA), Spectra B (SB), and Clara and Chroma combined (CC) modality.
Materials and Methods:
An App for the iPAD retina was developed to study evaluation of images. A total of 80 images from 20 bladder areas acquired in four modalities were included. Seventy-three participants completed the study. Images were analyzed on differences in delineated tumor margin variation, perceived quality of the image, and delineation time.
Results:
A separation between high agreement (n = 14) and low agreement (n = 6) images was found. In high agreement images, no difference in root mean square (RMS) was found between modalities. In low agreement images, WL (26.5 pixels) and SA (33.4 pixels) had a higher RMS than CC (18 pixels) and SB (21.4 pixels). The quality of SPIES modalities images was rated significantly higher. Delineation time was similar.
Conclusion:
In low agreement cases, images in CC and SB have less variation in interpretation than WL and SA. The image quality in SPIES modalities is graded significantly higher than WL. There is no difference in delineation time between modalities.
Introduction
N
Therefore, novel endoscopic imaging techniques are needed to improve the detection of bladder cancer. This reduces the number of interventions and, in turn, reduces costs. 3 New developments in addition to the development of traditional White light (WL) cystoscopy have been introduced, including photodynamic diagnosis and Narrow Band Imaging. 3 –5
Karl Storz has developed an imaging platform for endoscopy called the Storz Professional Image Enhancement System (SPIES). Besides conventional WL, it utilizes four different modalities. Spectra A (SA) and Spectra B (SB), which use specific color renderings to pronounce the spectral separation of the recorded broad visible spectrum. A third modality enhances local brightness (Clara) and the fourth enhances sharpness of the image (Chroma) (Kamphuis et al., submitted).
New technologies in surgical techniques should be studied to evaluate its merit and added value before adaption in general clinical use. 6 The diagnosis and treatment of bladder cancer starts with the detection of a suspect lesion by endoscopy. With the introduction of this new technology we want to test how images in the SPIES modalities are evaluated compared with regular WL cystoscopy. To evaluate the differences in interpretation of images of bladder mucosa in different SPIES modalities between urologists in a preclinical setting, an iPAD application called íSPIES was developed. The tablet interface was chosen as a medium because of intuitive and precise drawing options using a stylus. Delineation of specific regions of interest is commonly used in radiation oncology, where radiation oncologists tested differences in delineation of radiation fields of tumors on CT scans. 7
The objective of this research is to evaluate the differences in interpretation of images of bladder urothelium in different SPIES modalities between urologists in a preclinical setting. We hypothesize that each SPIES modality has a different (1) perception of suspected lesion margin, (2) lesion recognition time, and (3) perception of image quality. In follow-up, these findings will guide us to position and implement the SPIES platform in the clinical evaluation of urinary bladder tumors.
Materials and Methods
íSPIES app development
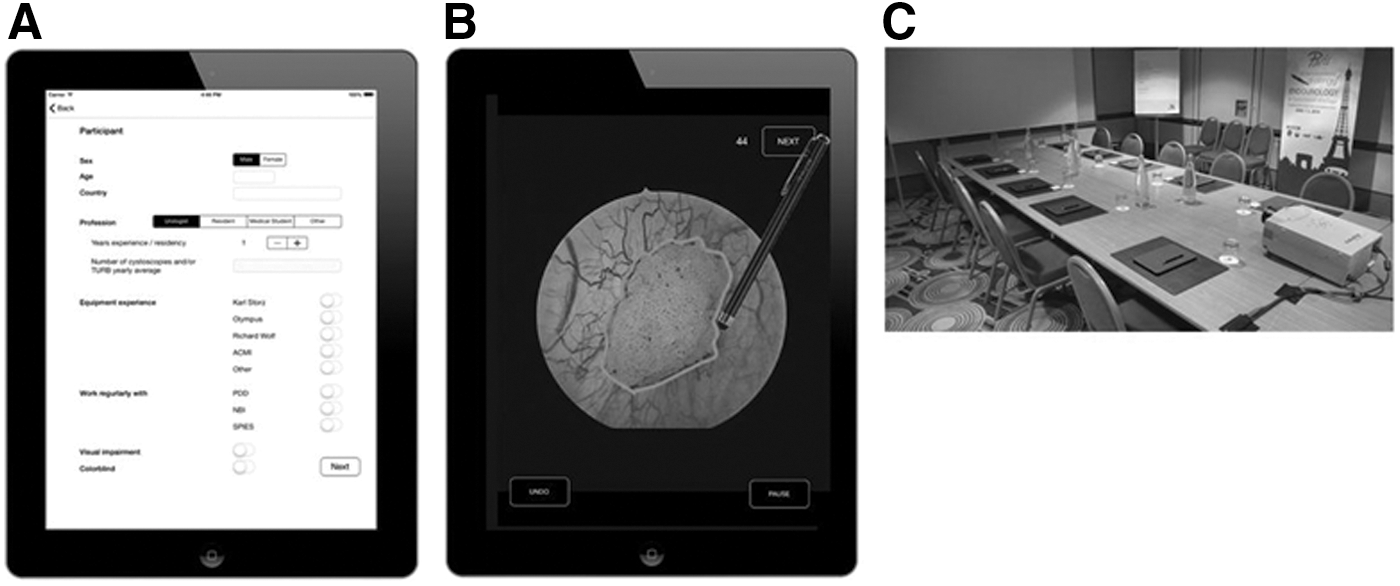
Apple Xcode environment was used to program an App that allows precise delineation of a suspected lesion within SPIES images, all stored on an iPAD. Ten Apple retina iPADs, together with a soft tip stylus (size 5 mm), were used for delineation (Fig. 1A, B). All data were stored online in a raw comma separated format on an external server for further analysis. The study was executed in a room that allowed 10 participants simultaneously (Fig. 1C).
Example of
SPIES image data acquisition
Images of bladder urothelium in four settings were captured in four European medical centers equipped with the new Karl Storz release (IMAGE 1 CONNECT [TC200] and IMAGE 1 H3-Link [TC300]; Karl Storz, Tuttlingen, Germany). All data providers were asked to capture the images of bladder mucosa in WL, Clara and Chroma combined (CC), SA, and SB under the same conditions as good as possible (position, distance, focus, angle of camera to bladder mucosa area). From all collected images, a total of 80 images from 20 bladder mucosa areas acquired in four modalities were included in the study. The 20 bladder mucosa areas were divided between agreement and disagreement cases beforehand by a panel of urologists working at the AMC and can be read as easy cases to delineate (agreement) and difficult cases to delineate (disagreement).
íSPIES study execution
During the “Challenges in Endourology congress” June 1–3, 2014, in Paris-France, all participants were invited to join the study. In a study room, under the same conditions, participants were asked to take place and complete the whole app without disturbances.
The application started with a fill out form for general information and acquisition of data on the participant characteristics (age, sex, nationality, profession, and experience).
Hereafter, a brief tutorial was shown on how to indicate an area on the shown image as abnormal using a stylus. The instruction was to “delineate any abnormality as precise as possible.” This was illustrated with the image of a bladder tumor with imprecise delineation (“not intended”) and the same image with a precise delineation (“intended”).
After delineation of each image, the participant was asked to rate the quality of the previous image on a 0–10 Likert scale (0 = very bad quality, 10 = superb quality).
The participants were given as much as 45 seconds per image to evaluate and delineate any abnormal areas. If finished earlier, one could indicate by touching the “next” button to proceed. Then, a grading of image quality was done on a 10-point scale. The app recorded the drawn lines, drawing times, quality grading, and “undo” actions in a local database.
One image from each area was duplicated to test for intraobserver variability. Each participant evaluated so together a total of 100 images. The sequence of all 100 images was at random. In total, a number of 7300 images were evaluated with a delineation of suspicious areas and grading of the image quality.
iSPIES data analysis protocol
Data were analyzed following six specific steps as illustrated in Figure 2A and 2B: 1. All delineations were plotted in the displayed image. 2. From the total of delineations of each modality of each image, a median line was calculated per image. This was done by first closing and filling of the delineation lines, if necessary, to extract delineated areas. 3. Subsequently, a dilate erode technique was used to merge areas that were close to each other. From this the median area was captured. 4. Each individual delineation was compared with this median line, and a root mean square (RMS), used to express the deviation from the mean, was calculated. 5. Heat maps with a threshold of three participants' lines were calculated indicating differences in overlap of delineated areas. 6. From the heat maps, iso lines were composed, showing the region that was indicated as abnormal by 20%, 50%, and 80% of the participants. 7. Next to the iso lines, the RMS of each modality of each image was plotted as a band around the calculated mean.
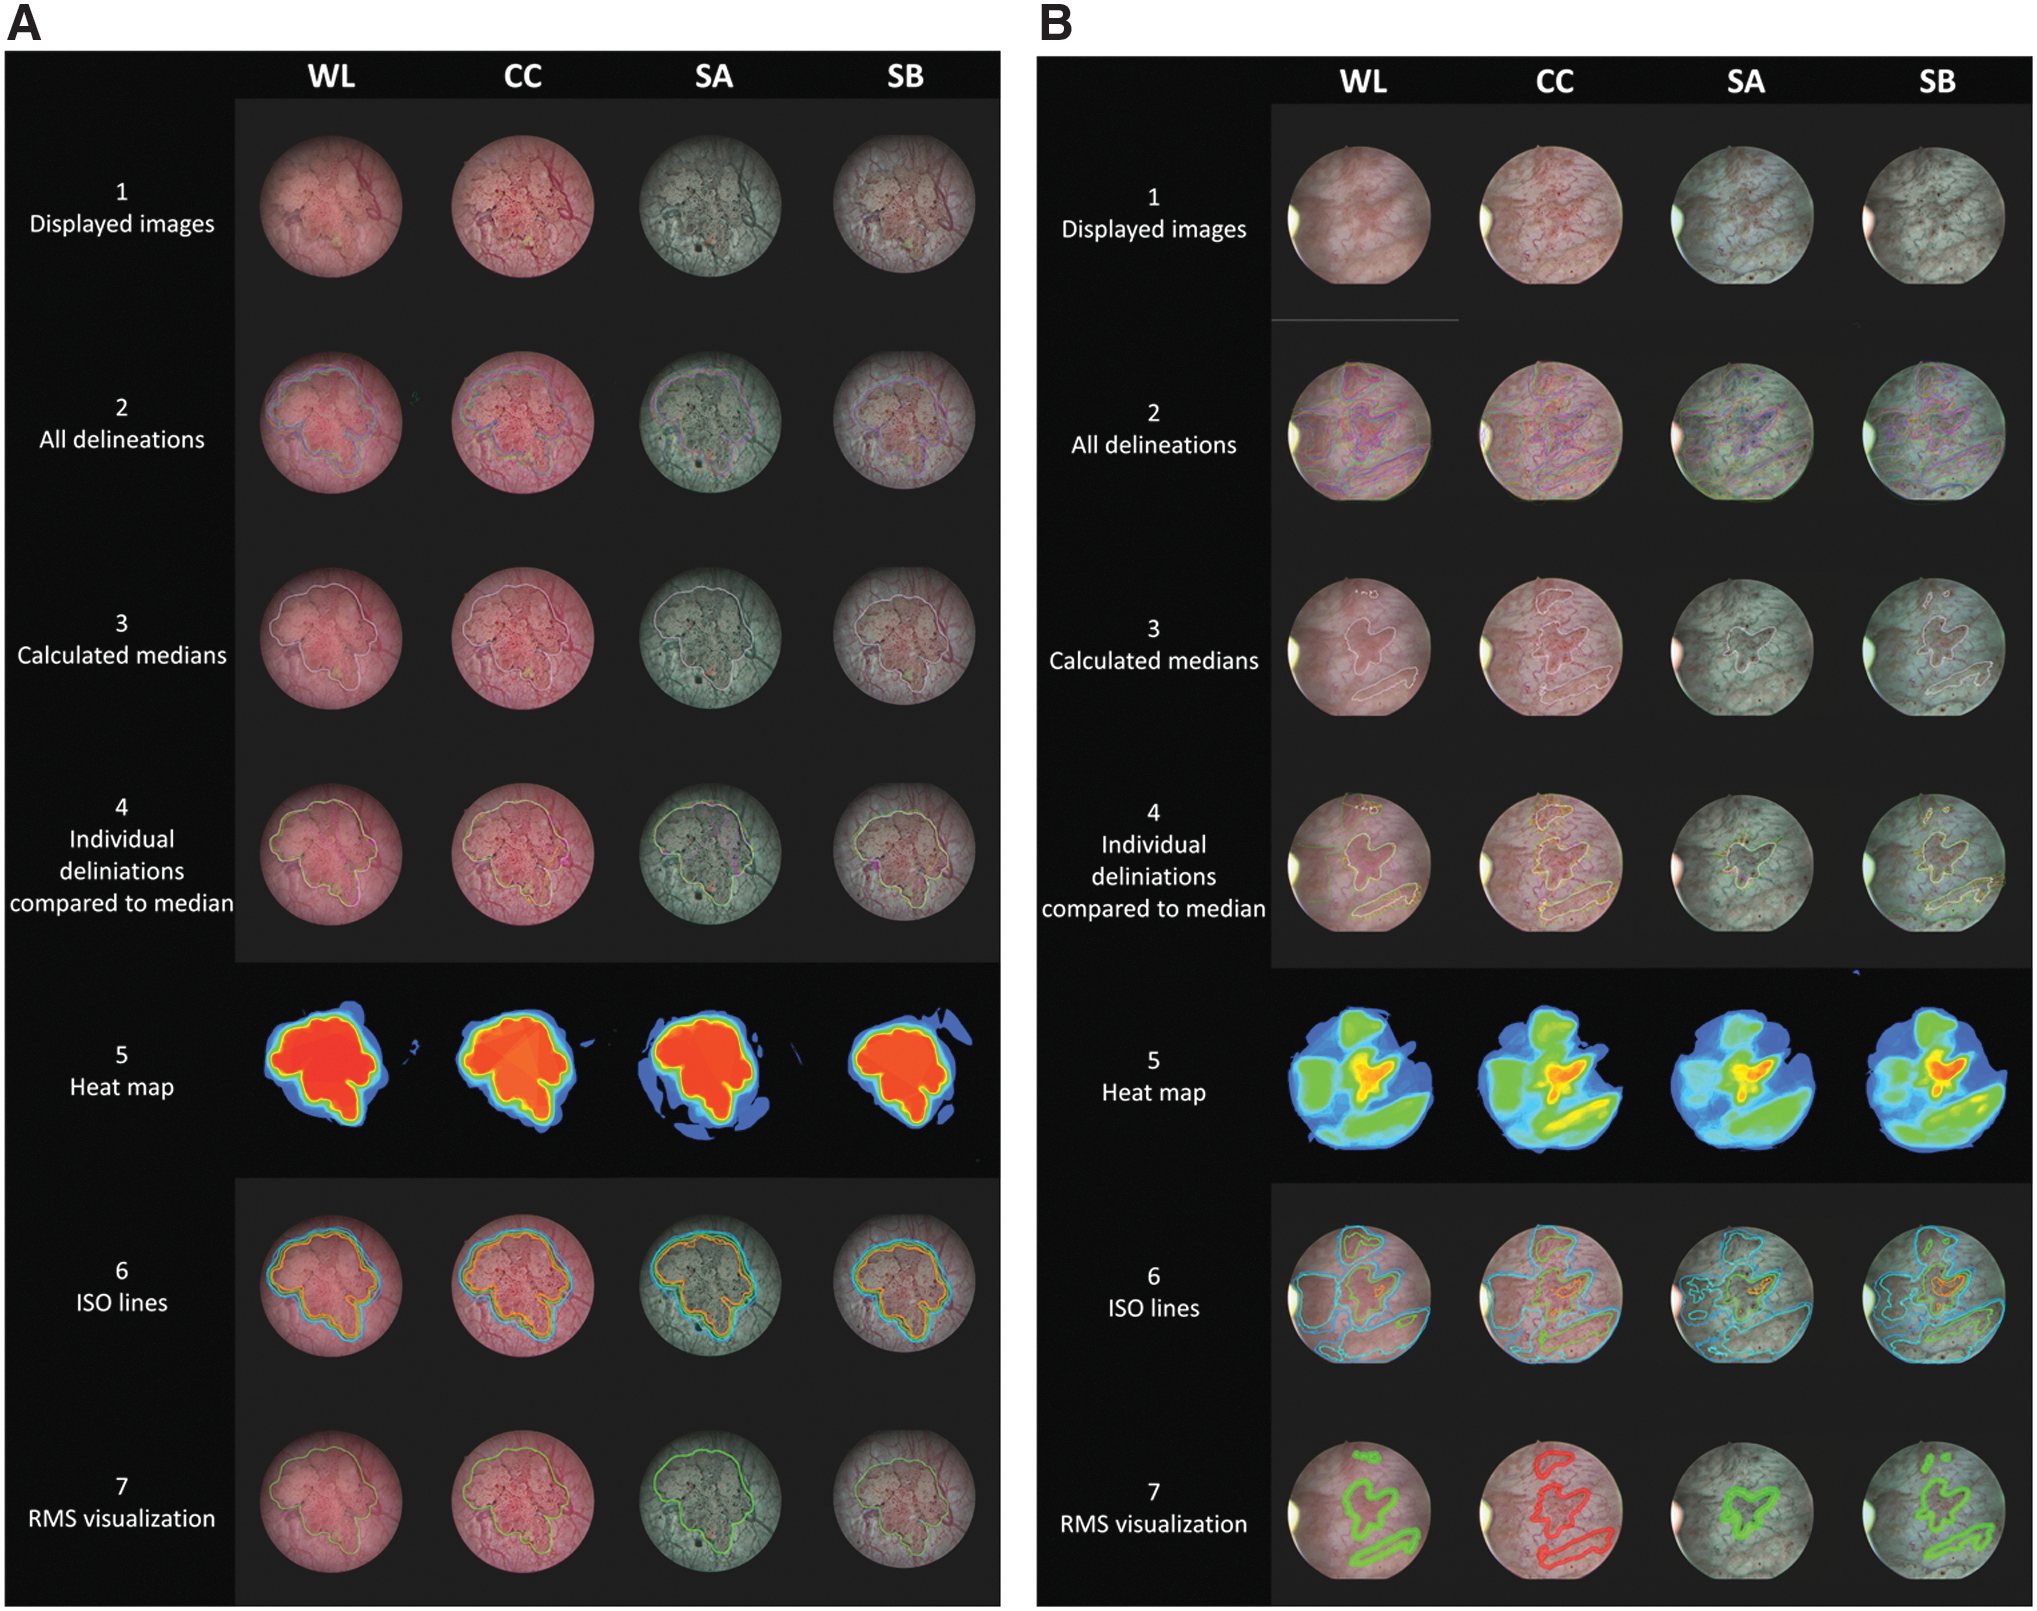
Example and explanation of used delineation analysis in an
All images from one bladder mucosa area were put next to each other (as illustrated in Figs. 2A and 3B) underneath the same images that were put in lines with all delineations, with heat maps, with iso lines, and with RMS as a band around the median. By visual evaluation of these figures, we found a difference between 14 images where there were no gross differences between the 4 modalities and 6 images where there were clear differences between the 4 modalities in agreement between participants on abnormal areas. The 14 images without gross differences we call the agreement cases. The six other cases we call the disagreement cases.
All data grouped together in all cases or grouped in agreement vs disagreement were analyzed on differences in (1) delineated tumor margin variation represented as the RMS in pixels from the median delineation, (2) quality of the image by a 0–10 score, and (3) time in seconds of delineation per modality.
In addition, the required delineation time for each image was captured, making it possible to compare evaluation and delineation time differences between different modalities. Finally, the average grade of the image quality of different modalities was calculated. Differences in time and quality were tested with a nonparametric Wilcoxon signed rank test.
Intraobserver variation in delineation was investigated by incorporating one extra image from each 20 image set. All contributors delineated these 20 extra images twice during the test. All 100 images together were displayed at random. The second delineations were compared with the exact same images from the first delineation (Fig. 3).
Results
Data and delineations of 91 participants were captured. Of them, 13 were expelled because they were neither urologist nor resident in urology. Of the group of 78 urologists and residents, 5 participants were expelled from further analyses because of incomplete execution of the study. Ultimately, the delineations of 69 urologists and 4 residents were used for final analysis. General information on participants on sex, age, and experience in years can be found in Table 1.
As described in the Materials and Methods section, we identified a group of images with high agreement and a group of images with disagreement between the participants.
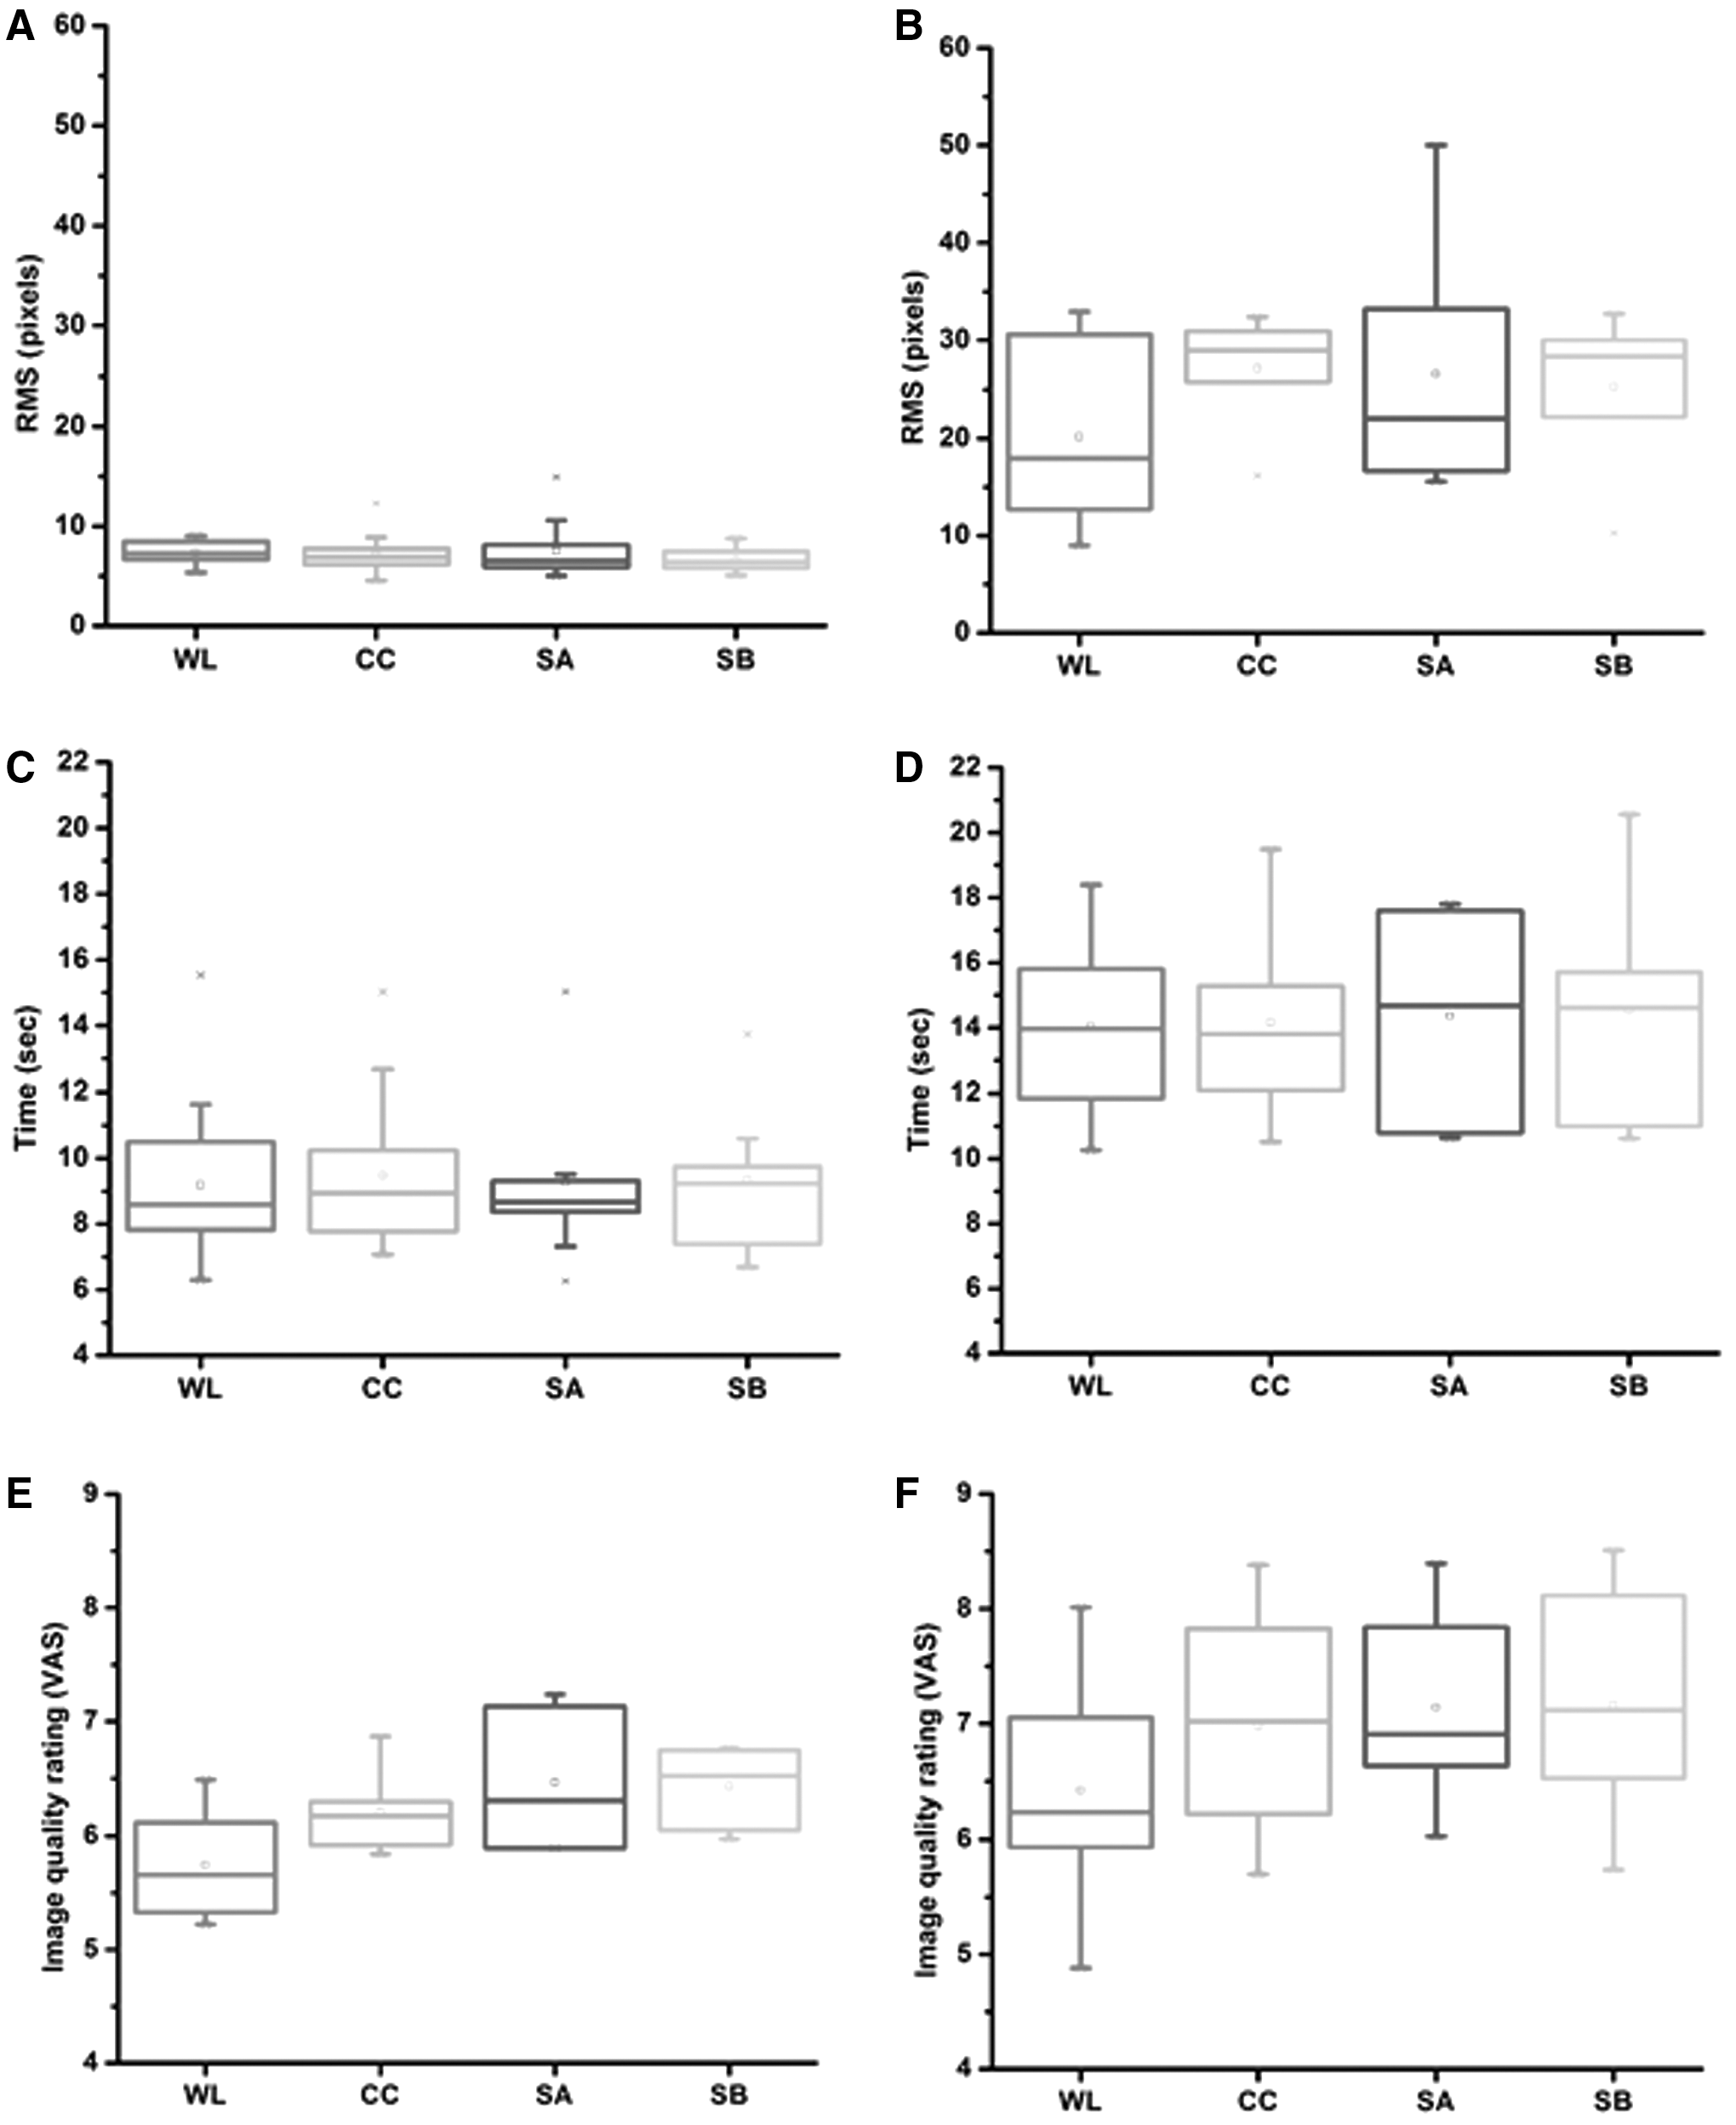
(A) In all 20 images as a group, there were no differences between the four modalities in absolute RMS in pixels of the distance deviation to the median line (WL 12.9 ± 10.4 pixels, CC 15.4 ± 13.0 pixels, SA 15.0 ± 13.7 pixels, and SB 14.3 ± 12.2 pixels). However, there was a clear visual separation between agreement cases (n = 14) and disagreement cases (n = 6). In the agreement cases, no differences in RMS were found (WL 7.9 ± 1.3 pixels, CC 7.8 ± 2.4 pixels, SA 8.4 ± 3.5 pixels, and SB 7.4 ± 1.4 pixels) between the four modalities (see boxplots Fig. 3A). As in disagreement cases, WL (24.4 ± 13.5 pixels) and SA (30.3 ± 16.8 pixels) had a wider range compared with CC (33.3 ± 9.0 pixels) and SB (30.4 ± 10.7 pixels) (Fig. 3B). Comparing the boxplots of agreement cases with disagreement cases, you see the difference between the modalities.
(B) Image quality scores were compared in the Wilcoxon signed rank tests and showed that images in CC, SA, and SB were significantly higher valued than WL in all groups, both in the total group (p < 0.001 for all tests) and for the agreement cases (p = 0.046, p = 0.028, p = 0.028) and the disagreement cases (p = 0.001 for all tests, Fig. 3E, F and Table 2).
(C) In all 20 images as a group, there were no differences between the four modalities in delineation time in seconds per modality (WL 10.6 ± 3.3 seconds, CC 10.9 ± 3.3 seconds, SA 10.8 ± 3.5 seconds, and SB 10.9 ± 3.5 seconds). However, there was a clear separation between agreement cases (n = 14) and disagreement cases (n = 6). In the agreement cases, a mean delineation time of 9.3 seconds was found, without any differences between the modalities (WL 9.2 ± 2.3 seconds, CC 9.5 ± 2.3 seconds, SA 9.3 ± 2.3 seconds, and SB 9.4 ± 2.2 seconds). In disagreement cases, longer delineation time in general was found of around 14 seconds. Also here, there were no differences in delineation duration time between modalities (WL 14.0 ± 2.9 seconds, CC 14.2 ± 3.1 seconds, SA 14.4 ± 3.4 seconds, and SB 14.5 ± 3.6 seconds) (Fig. 3C, D) (see also Table 3).
CC = Clara and Chroma combined; SA = Spectra A; SB = Spectra B; WL = White light.
RMS = root mean square; SPIES = Storz Professional Image Enhancement System.
Intraobserver variation analyzed in 20 randomly chosen images from the 80 images data set showed no variation in RMS between all participants (Fig. 4).
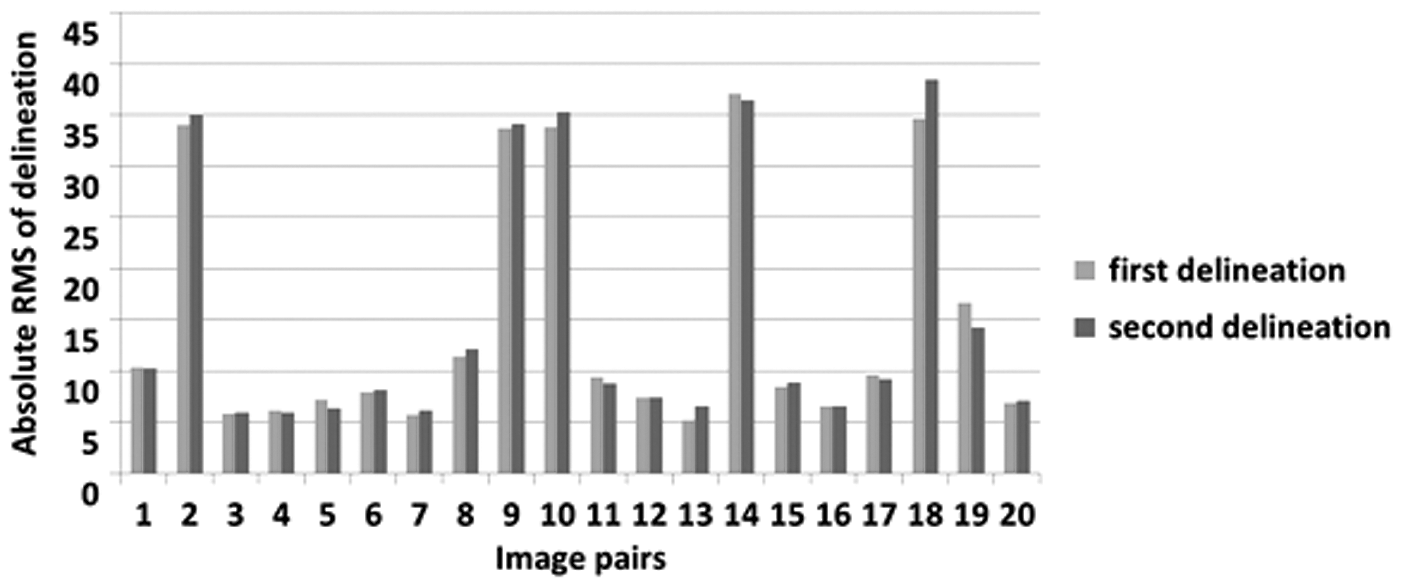
Diagram representing the first and second delineation. Twenty images, randomly chosen from the 80 images in the study, were delineated for a second time by all contributors. The second delineations are compared with the exact same images from the first delineation showing no difference in RMS. This indicates that the there is a low intraobserver variation.
Discussion
This study is unique in the sense that it provides for the first time insight in the diagnostic potentials of a new endoscopic technology before its clinical application. It was concluded that the quality of images in SPIES modalities was graded significantly higher compared with WL.
In images with unmistakably a (papillary) tumor in sight (agreement cases), we found no difference in RMS from the indicated area or in delineation time between the four tested modalities. The agreement between participants is strong, as shown in the heat maps and in the RMS boxplots. However, in images with less agreement between participants about the areas that are suspect for bladder cancer, there are clear differences between the four tested modalities when evaluating the heat maps and iso line images and evaluating the RMS boxplots. The images in CC and the images in SB have a higher concordance between participants. Time used for delineation was longer in these complicated images (±14 seconds) compared with the agreement cases (±9 seconds), but there was no difference between the four modalities within both groups.
Overall, it was not possible to conclude that a specific modality performs superior over the others. However, the agreement between participants about the area suspected for cancer differs between modalities. Especially in complicated images, specific modes provide additional benefit. This is an important finding, as it is the foundation of bladder tumor diagnosis and treatment.
Surprisingly, no differences in time needed to evaluate the images were found in the four modalities. We hypothesized to find a shorter time in the SPIES modalities, as they would have a stronger contrast or clearer and sharper image. The time participants needed to work with a new technique or learn to interpret a new image modality might compensate for this effect and this could be an explanation for our finding.
Obviously, there are many differences between the interpretation of a frozen image of a bladder area on an iPAD compared with the interpretation of a dynamic display during a cystoscopy where the urologist can change several parameters like the distance and angle to the mucosa, fill the bladder, and can use the effect of the water flow to evaluate the mucosa. In real life, these parameters are constantly changing and thus may also change the perception of lesion margins.
The sample size of 100 images was based on two factors. For practical implementation of the study to execute a full round of delineation of images of 20 bladder areas in four modalities plus one extra for the evaluation of intraobserver variability within 45 minutes. Second, in similar studies in other medical fields a similar number of images are used. For example, in a recent radiotherapy study, CT images of 22 patients were interpreted by 11 radio-oncologists for delineation. 7
We cannot relate the results of this study directly to the dynamic cystoscopy. In addition, we do not know for each pixel in the image if that exact part of the urothelium was malignant or benign. Therefore, we have to be careful with extrapolation of our finding in terms of “better or worse tumor detection” between the four tested modalities. However, we can evaluate the difference in interpretation of images of one fixed bladder area in several modalities among experienced colleagues. In addition, it is intriguing to find in difficult to interpret images (disagreement cases) a higher concordance among participants in two of the tested modalities.
Despite the challenges we have encountered in this research and the drawbacks that we can think of, we believe we have been able to test the differences in interpretation of bladder mucosa abnormalities between the available SPIES modalities. Based on these findings, we recommend using the CC or SB during cystoscopy. Translation of the clinical usability of these findings calls for more research. The Clinical Research Office of the Endourological Society is conducting a Randomized Controlled Trial, including the insights obtained from the present study. 8 This study will confirm within a clinical setting the position of SPIES in the diagnosis and treatment of NMIBC.
Footnotes
Acknowledgments
The íSPIES study was supported by an unrestricted educational grant from Karl Storz Company. The authors thank Dr. A.S. Spriensma for assistance with statistical analyses and all participants for their time and making this study possible.
Author Disclosure Statement
No competing financial interests exist.