
Abstract
Introduction:
Understanding the factors affecting success of extracorporeal shockwave lithotripsy (SWL) would improve informed decision-making on the most appropriate treatment modality for an individual patient. Although stone size and skin-to-stone distance do correlate with fragmentation efficacy, it has been shown that stone composition and architecture, as reflected by structural heterogeneity on CT, are also important factors. This study aims to determine if CT texture analysis (CTTA), a novel, nondestructive, and objective tool that generates statistical metrics reflecting stone heterogeneity, could have utility in predicting likelihood of SWL success.
Materials and Methods:
Seven spontaneously passed, intact renal tract stones, were scanned ex vivo using standard CT KUB and micro-CT. The stones were then fragmented in vitro using a clinical lithotripter, after which, chemical composition analysis was performed. CTTA was used to generate a number of metrics that were correlated to the number of shocks needed to fragment the stone.
Results:
CTTA metrics reflected stone characteristics and composition, and predicted ease of SWL fragmentation. The strongest correlation with number of shocks required to fragment the stone was mean Hounsfield unit (HU) density (r = 0.806, p = 0.028) and a CTTA metric measuring the entropy of the pixel distribution of the stone image (r = 0.804, p = 0.039). Using multiple linear regression analysis, the best model showed that CTTA metrics of entropy and kurtosis could predict 92% of the outcome of number of shocks needed to fragment the stone. This was superior to using stone volume or density.
Conclusions:
CTTA metrics entropy and kurtosis have been shown in this experimental ex vivo setting to strongly predict fragmentation by SWL. This warrants further investigation in a larger clinical study for the contribution of CT textural metrics as a measure of stone heterogeneity, along with other known clinical factors, to predict likelihood of SWL success.
Introduction
E
CT texture analysis (CTTA) allows processing of existing CT images for assessing internal structural heterogeneity. In the field of oncology, CTTA has been validated as a risk stratification tool and prognostic indicator in the evaluation of a number of tumor applications, for example, solid tumors of the lung and colon. 15,16 The main advantage of CTTA is the generation of quantitative measures of heterogeneity within a region of interest (ROI) (e.g., a suspicious lesion) through detailed statistical analysis of voxel distribution, as well as the use of different sized filters to enhance structures of interest (e.g., increased vascularization).
This study aimed to translate CTTA methods that have been successfully applied in tumor analysis to a novel use in renal tract stone analysis. CTTA metrics, determined from conventional CT images, quantifies the degree of heterogeneity within a stone and these metrics were then correlated with ex vivo stone fragmentation during SWL. Furthermore, this study utilizes micro-CT of the stone to aid visualization of the variability in stone architecture. Our hypothesis is that CTTA metrics will improve the prediction of SWL outcomes over traditional clinical factors. This could be used to help decide if a stone is a good candidate for SWL or whether alternative treatments should be considered.
Materials and Methods
Imaging of stones
Seven spontaneously passed kidney stones varying in size from 3 to 6 mm were provided voluntarily by five different patients. These seven stones were placed into a piece of polystyrene, which held them in a fixed orientation and has minimal X-ray contrast, and scanned using a conventional CT scanner (Lightspeed VCT, GE medical systems) on standard noncontrast CT KUB settings (0.625 mm slice thickness and pixel size of 0.5 mm by 0.5 mm) and the data were exported as HU into Digital Imaging and Communications in Medicine (DICOM) files. Imaging was done in three orthogonal orientations by rotating the stone holders. This was to check assumptions regarding use of the largest slice in one plane to represent the heterogeneity characteristics of the stone as a whole.
The seven stones were also scanned in a micro-CT system (Skyscan 1174, Bruker MicroCT) in one orientation to generate an isotropic volumetric data set at 6.95 μm resolution. The volumetric data were then exported as a sequence of bit-map image files, which were then imported into MATLAB (The MathWorks, Inc., Natick, Massachusetts) using the “imread” command and analyzed using the image processing tools. Selected slices were then exported from MATLAB as a DICOM file so that it could be imported into the CTTA package.
CT textural analysis
Macro-CT data were analyzed using TexRad, a proprietary, commercially available CTTA software package (TexRAD research software, TexRAD Ltd.
Estimation of stone volume and density
The volume of each stone was determined from the micro-CT data set. The total voxel count of each stone was multiplied by the voxel size of 6.5 μm. The mean HU density of the stone was calculated by summing the HU value of all voxels in the stone and then dividing by the total number of voxels.
Shockwave lithotripsy
After CT imaging, the stones underwent in vitro SWL using a clinical electromagnetic lithotripter (SLX-F2, Storz Medical). Each stone was placed in a plastic tube with a conical bottom onto which was bonded a mesh with grid size of 2 mm. The conical tube was placed in a Perspex tank containing degassed water that was mounted on the lithotripter. The tank was fitted with a thin low-density polyethylene plastic film on the bottom to allow shock wave transmission from the therapy head into the tank. 18 The lithotripter was operated at energy level 6, with a precise focus, and fired at 1.5 Hz, which is the standard clinical treatment protocol used at our center. As the stones were ex vivo, relatively few shocks were needed to fragment each stone at the energy level usually used for patient treatment. The stone was observed manually during SWL treatment. Fragmented stone pieces less than 2 mm would fall through the mesh into a finger cot that was placed around the tube to collect the fragments. The treatment was stopped when all fragments had passed through the mesh, at which point, the number of shocks was recorded. After SWL was performed, all stone fragments were collected and sent for stone composition analysis using Fourier transform infrared spectroscopy.
Statistical analysis
Statistical analysis was performed using SPSS version 22.0.0. The relationship between CTTA metrics and the number of shock waves required for fragmentation was analyzed by computing Pearson's correlation coefficient. The predictive ability of stone volume, mean HU density, and CTTA metrics was analyzed using multiple linear regression modeling (using the “Enter” method) with the outcome variable being the number of shocks required to fragment the stone. Regression diagnostics were used to check that assumptions of linearity, multicollinearity, independence of errors, homoscedasticity, and normally distributed errors were not violated.
Results
Stone composition and CT appearance
Figure 1 shows the stone characteristics, including stone composition, CTTA metrics, and representative two-dimensional slices from both macro-CT and micro-CT. Although the ex vivo stones look very comparable on macro-CT with each other, the micro-CT data revealed the detailed internal structure and individual differences across the seven stones.
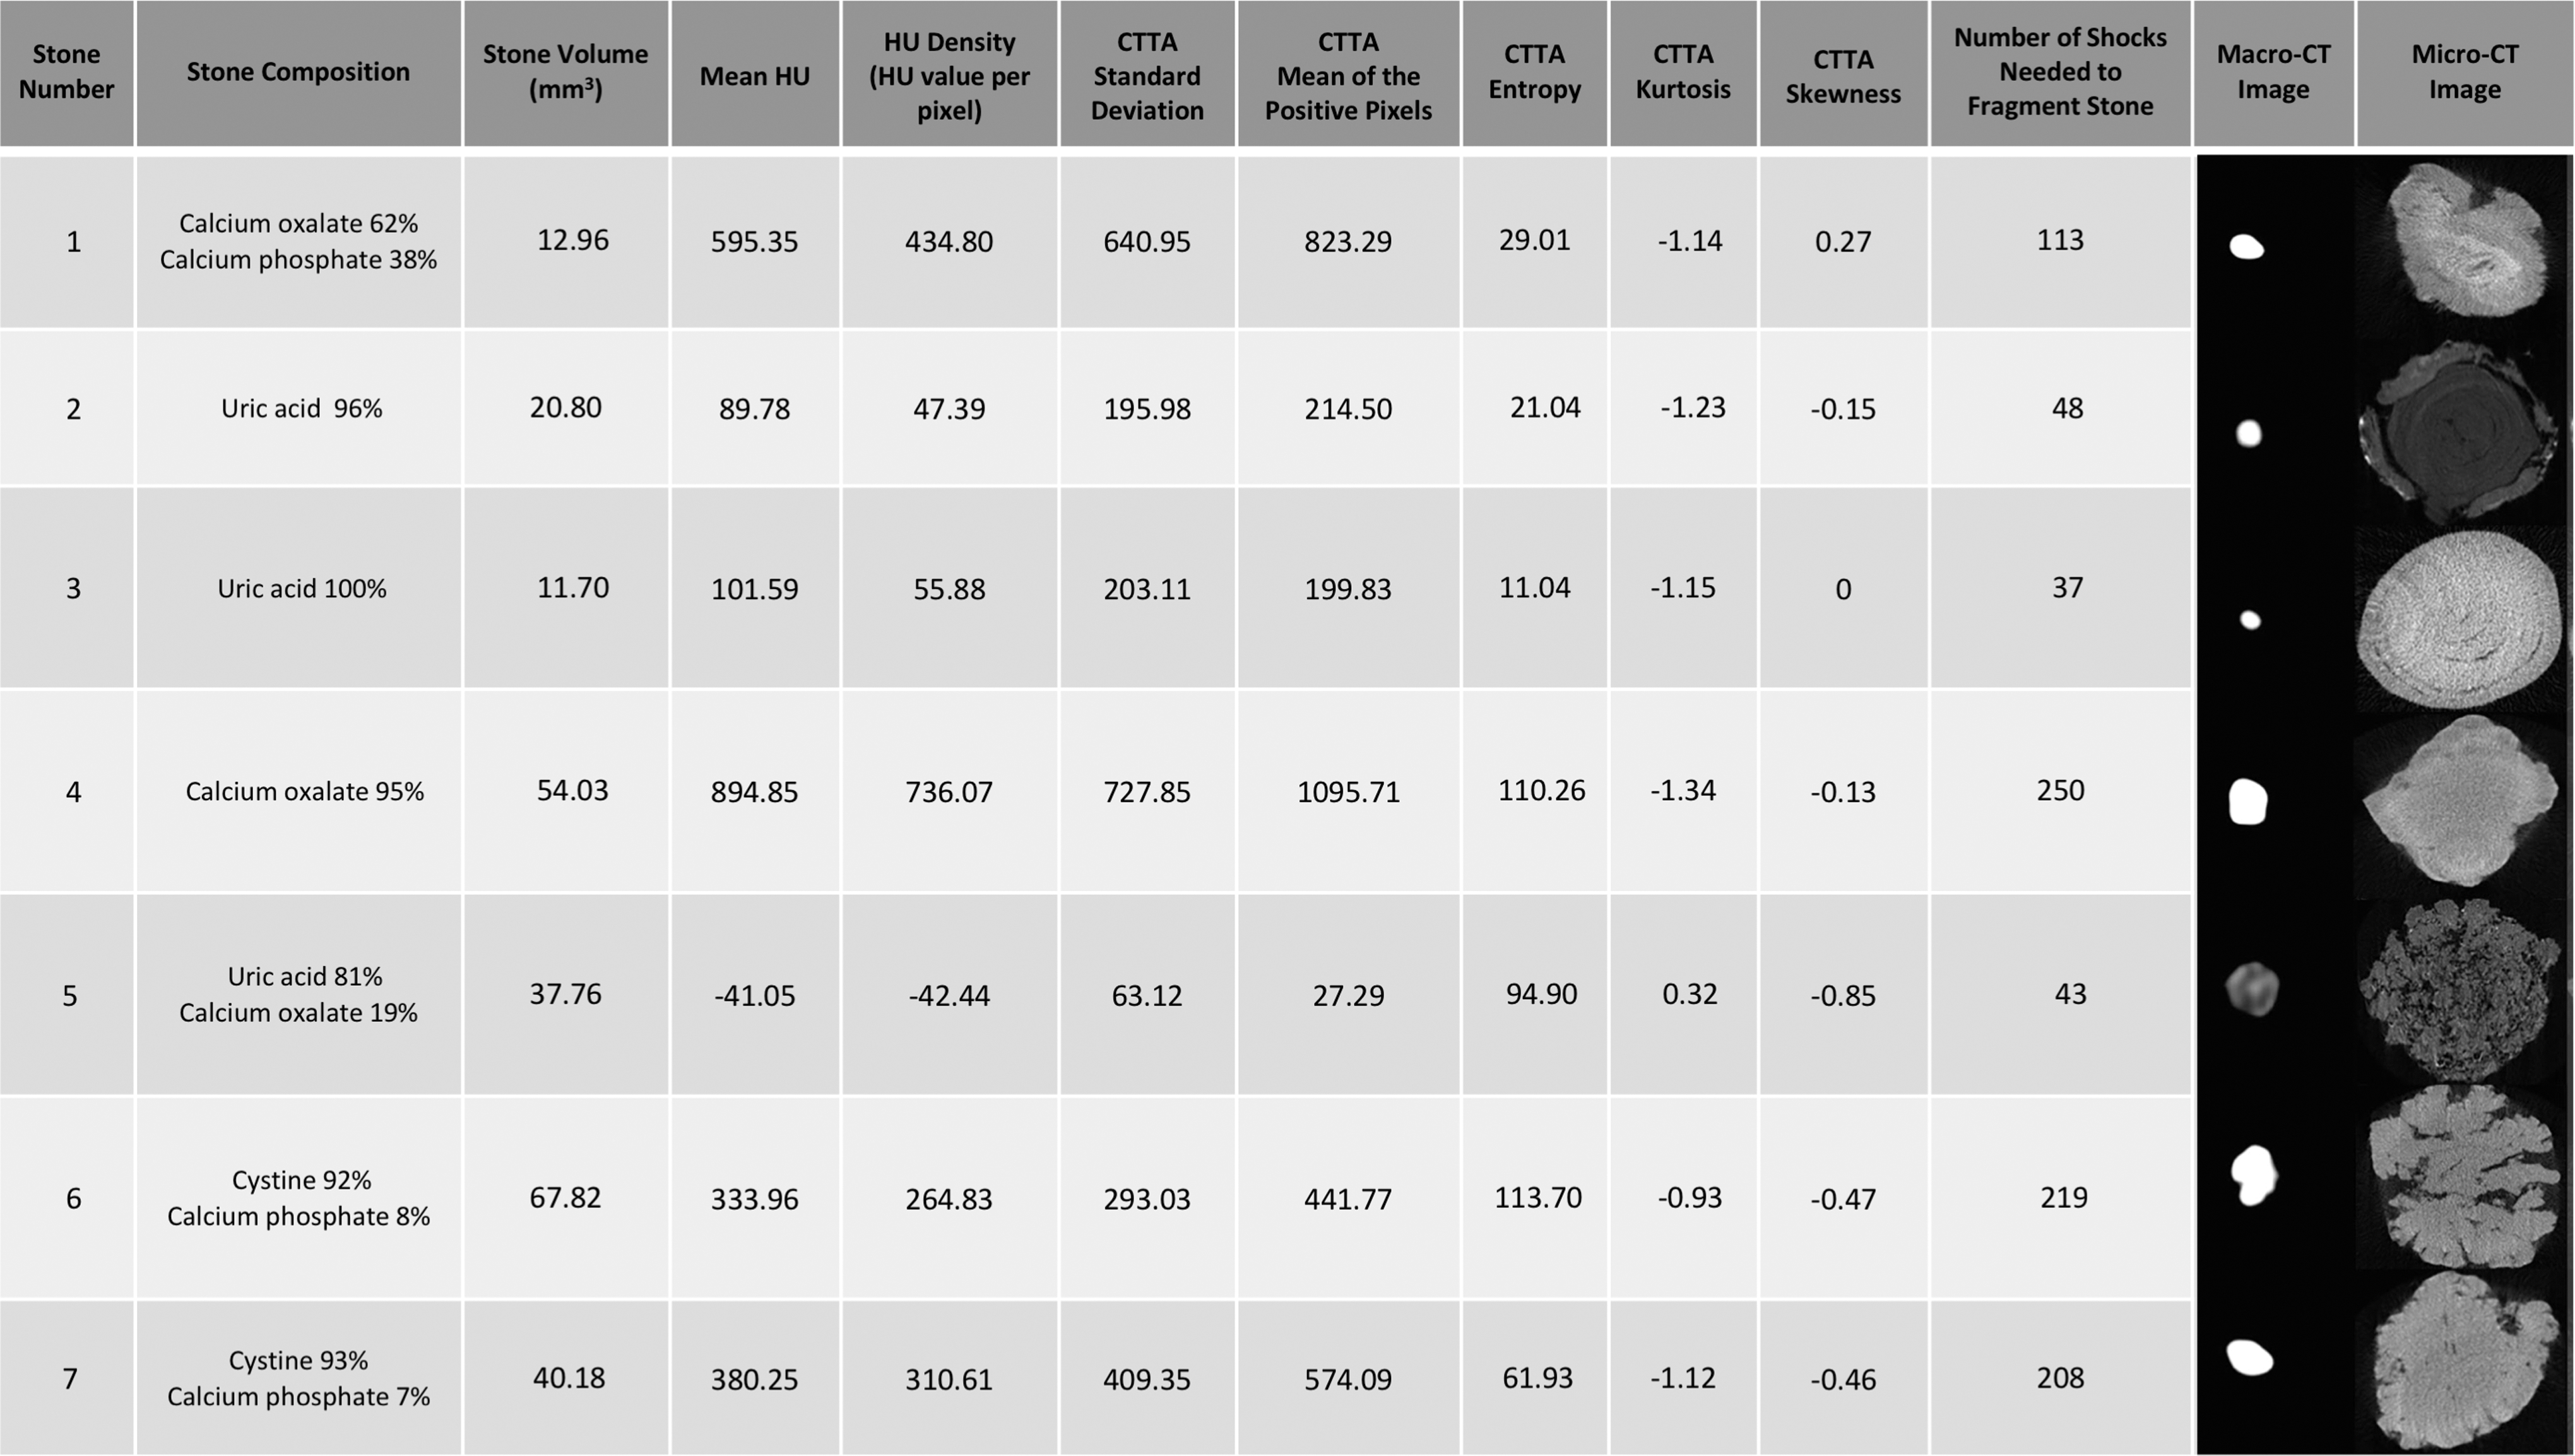
Table of stone characteristics showing stone chemical composition, stone volume, mean HU, mean HU density, CTTA metrics, and macro- and micro-CT images (not to scale and not calibrated for brightness) of the seven ex vivo stones used in this study. Stones 2 and 3 were passed from the same patient. Stones 6 and 7 were also passed from the same patient. CTTA = CT textural analysis; HU = Hounsfield unit.
Relationship between stone architecture and CTTA metrics
The CTTA metrics represented in Figure 1 were obtained from the ROI drawn on the largest image slice available for the stone in one orientation. Validity of use of the largest slice in one plane for CTTA was checked by comparing the largest slice in each plane to the other planes, as well as comparison of each slice above and below the large slice to the largest slice, to check that CTTA metrics did not differ significantly between these images. Of note, stone 5, although a uric acid stone, is markedly different in appearance compared to the other two uric acid stones (2 and 3) on both macro- and micro-CT. It appears more porous with pockets of air, which has an HU value of −1000. As all pixels within an ROI are included in the CTTA analysis, this could result in stone 5 having a negative mean HU value. The more porous architecture may explain why stone 5 required disproportionately fewer shocks to fragment than expected for its size. Stone 5 also had a positive kurtosis, in contrast to the negative kurtosis values of all of the other stones, which is likely due to the effect of negative HU pixels.
Correlation of stone characteristics with ease of fragmentation by SWL
Correlations were considered among all the CTTA metrics (Table 1). There was a strong positive correlation between the number of shocks required to fragment the stone and stone volume (r = 0.768, n = 7, p = 0.044) (Fig. 2), as well as mean HU (as measured by CTTA) (r = 0.775, p = 0.041) and mean of the positive pixels (r = 0.775, p = 0.05). The strongest correlation with the number of shocks required to fragment the stone was CTTA-measured entropy (r = 0.804, p = 0.039) (Fig. 2). Mean HU density was also significantly positively correlated to number of shocks required to fragment the stone (r = 0.806, p = 0.028).
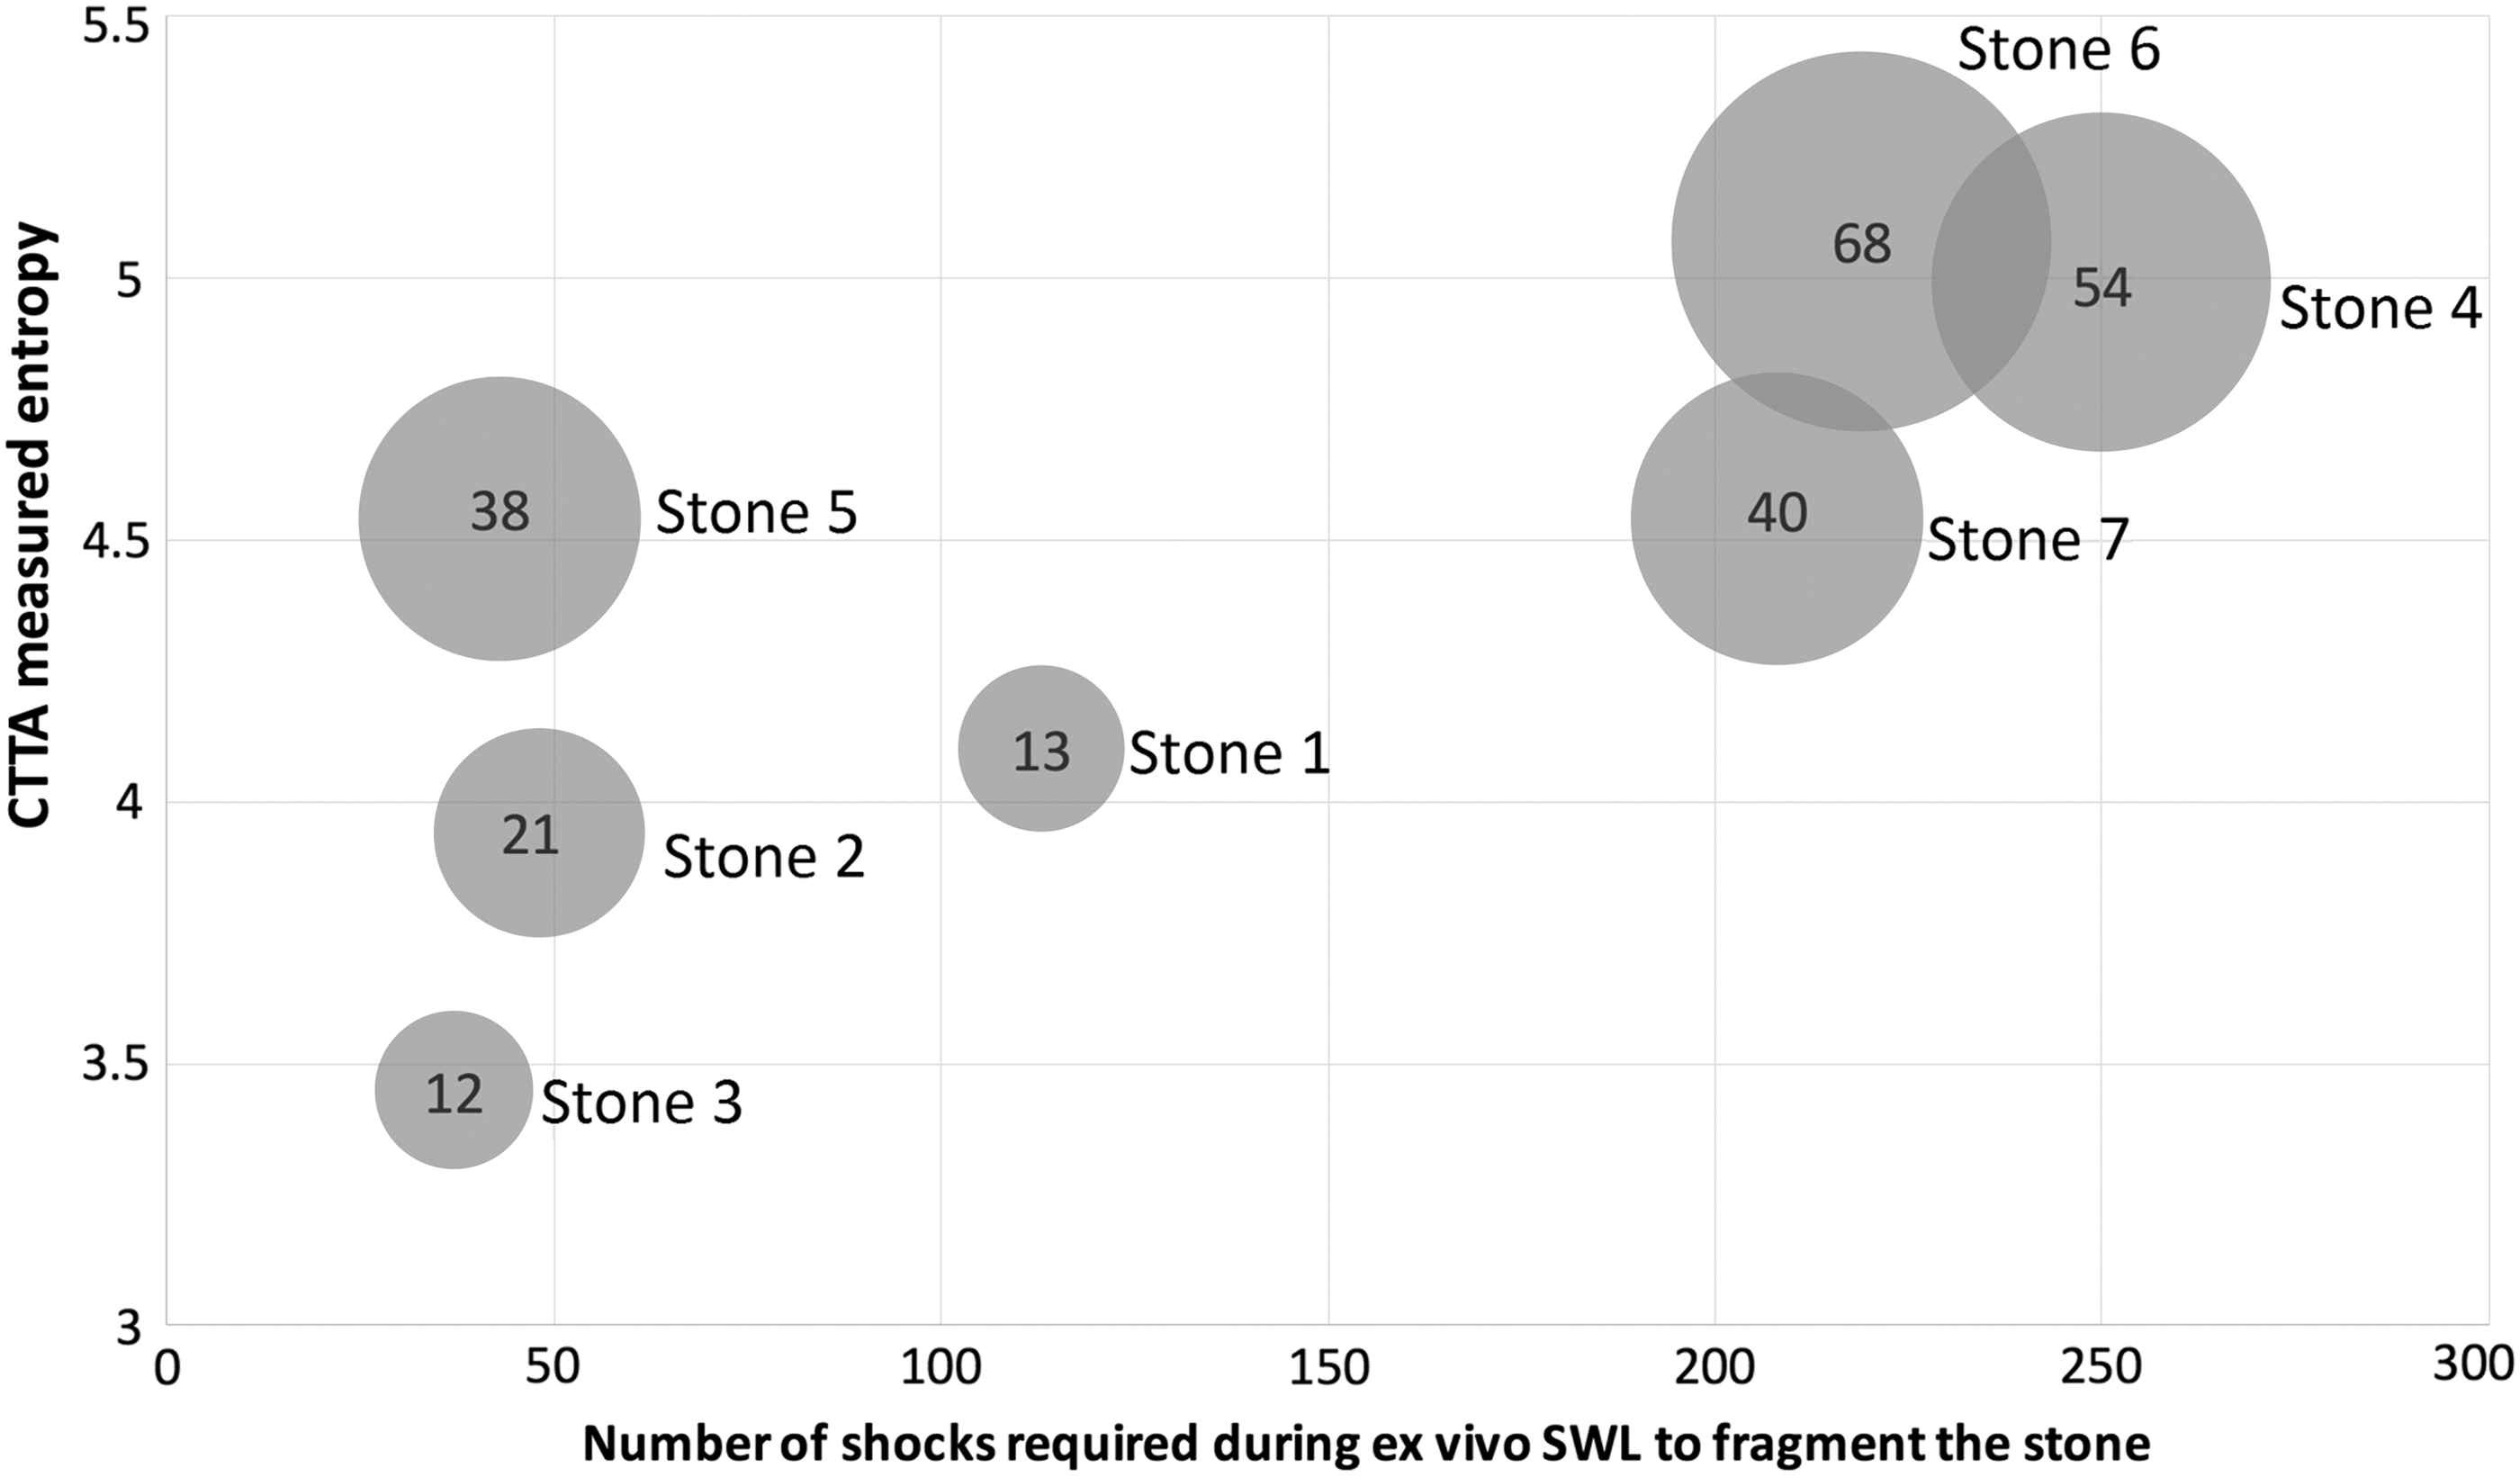
Bubble chart showing relationship between stone volume and CTTA-measured entropy (represented by size and label of bubble in mm3) and number of shock waves required for complete stone fragmentation.
Correlation significance at the 0.05 level (two tailed) is starred.
CTTA = CT textural analysis; HU = Hounsfield unit.
Predicting ease of SWL fragmentation using linear regression analysis
Stone volume, mean HU, HU density, and CTTA-measured metrics were used as predictors in multiple linear regression analysis for the outcome of number of shocks needed to fragment the stone. A multiple linear regression model using the “enter” method found that the CTTA metrics entropy and kurtosis explained a significant amount of variance (92%) in the number of shocks needed to fragment the stone (F(2,4) = 23.3, p = 0.006, R Square = 0.921, and adjusted R Square = 0.881) (Fig. 3). In this model, both entropy (β = 0.887, t[6] = 6.234, p = 0.003) and kurtosis (β = −0.531, t[6] = −3.732, p = 0.020) significantly predicted the number of shocks required. These two predictors can be summarized using the following equation: “Number of shocks needed to fragment the stone = 141 × entropy − 86.5 × kurtosis − 568.6.”

Graphical representation using three-dimensional scatterplot to show multiple linear regression model to predict ease of SWL fragmentation using CTTA metrics entropy and kurtosis.
This model explained a greater degree of variance in the number of shocks needed to fragment the stone than a linear regression model using entropy (F(1,5) = 9.113, p = 0.029, R Square = 0.646), stone volume (F(1,5) = 7.194, p = 0.044, R Square = 0.590), mean HU (F(1,5) = 7.498, p = 0.041, R Square = 0.600) of the stone, or mean HU density alone (F(1,5) = 9.298, p = 0.028, R Square = 0.650).
Discussion
In this experimental model of SWL using spontaneously passed, intact, ex vivo renal tract stones, we have identified CTTA metrics reflecting stone structure heterogeneity through differences in pixel distribution. These metrics show greater predictive ability for stone fragmentation by SWL than using standard measures of stone structure alone (i.e. stone volume, mean HU, and HU density).
Stone mean HU reflects stone composition in this study. The calcium oxalate and calcium phosphate stones were the most dense (mean HU >500), followed by cystine (mean HU >300) and then uric acid stones (mean HU <105). However, stones of similar composition can have visually different architecture as can be seen for stones 6 and 7. Although these are both cystine stones, stone 6 is more heterogeneous in structure, showing an irregular contour on micro-CT (Fig. 1). This is reflected in the lower mean HU and HU density for stone 6 than stone 7. One would expect stone 7 to require more shocks to fragment than stone 6 based on its higher HU density, but stone 7 actually required a lower number of shocks. This relative ease of fragmentation for stone 7 is reflected in its higher entropy value despite a lower HU density, suggesting entropy, as a CT texture metric, has an additional predictive value. It is well known that different stone compositions have different susceptibilities to SWL fragmentation. Stone composition can also, to a certain degree, be inferred from the mean HU range that can be expected of a certain stone type. However, for patients with a new presentation of symptomatic renal tract stones, being able to predict the susceptibility of a particular stone to SWL fragmentation without prior knowledge of expected stone composition or analysis of stones already passed, would be clinically useful. Stones from a range of compositions were chosen in this small study to demonstrate the proof of principle that CT texture analysis can provide additional information on stone architecture. This will form the basis for in vivo studies comprising large cohorts of patients undergoing SWL, to investigate whether textural analysis can help determine SWL success in the clinical setting when the stone composition is yet unknown and micro-CT imaging is not possible.
A multiple linear regression model with CTTA metrics of entropy and kurtosis can account for 92% of the outcome of how many shocks are needed to fragment the stones in this study. These metrics, derived from well-known statistical concepts to objectively measure stone heterogeneity, offer a rational predictor of successful fragmentation with SWL. Entropy is a measure of randomness of the pixel distribution within the stone, 19 and a large dataset of in vivo renal tract stones in a previous study from our group has shown it to be positively and nonlinearly correlated with stone volume. 20 From the regression analysis in this study, entropy shows greater predictive ability for the number of shock waves needed to fragment a stone than stone volume or HU density alone, suggesting entropy is contributing to additional information regarding stone heterogeneity.
Kurtosis is a measure of the combined weight of the tails of the distribution relative to the rest of the distribution. In this study, kurtosis is negatively correlated with the number of shocks required to fragment the stone. This relationship supports our previous work on a clinical dataset of 126 CT KUB images of in vivo renal tract stones, which showed that a more negative kurtosis value was associated with greater likelihood of stone clearance success by SWL. 20 The stones in this study that required a greater number of shocks had a more negative kurtosis (Table 1). This indicates a distribution of pixels with relatively lighter tails, which can be inferred as stone pixel distribution with fewer extreme deviations in HU value. This may suggest that these stones have more overall heterogeneity and are therefore more susceptible to SWL fragmentation.
Although the fragmentation tests were performed in vitro in this study and therefore did not reflect all the factors affecting clinical SWL, it has the advantage of isolating the effects of stone characteristics alone on ease of fragmentation. This would explain the high predictive value of stone texture metrics for the number of shocks needed to fragment the stone. The advantage of CTTA over previous studies investigating stone structure, is the use of both objective and automated measures of stone structure. These measures can be performed on standard CT KUB, on all of the available pixel data within a stone image, to reflect overall heterogeneity. Furthermore, this process of pixel analysis does not rely on subjective visual inspection or chemical analysis of stone composition. 9,12,21,22 In comparison to another study that has examined the relationship of stone texture to ease of fragmentation with SWL ex vivo, our study shows a stronger relationship and better predictive ability (adjusted R Squared of 0.881 compared to 0.58) using our CTTA metrics. 14 In combination with this study, the validity of using CTTA deserves further investigation using in vivo stone images and with consideration of other clinical factors affecting SWL success.
With regard to the reliability of CTTA across different CT scanners with different acquisition parameters, previous studies have demonstrated that the texture analysis technique used in this study has been technically validated in a number of previous oncological and phantom studies. Specifically, these metrics generated by CT texture analysis have shown to be less impacted by variation in image acquisitions 23 and shown to be reproducible from test-retest studies. 24,25
This study used ex vivo stones and therefore differences in image acquisition and resolution are to be expected between ex vivo and in vivo scanning of renal tract stones. However, in a retrospective clinical study, we have shown that the likelihood of achieving stone clearance after SWL of stone with mean size of 11.5 mm can be predicted using CTTA metrics with 72% overall accuracy. 20 Therefore, the relationship between CTTA metrics and ease of SWL fragmentation still holds when using in vivo stone images and this study adds evidence to the proof of concept of stone textural analysis. However, this study used ex vivo stones and the results will not be representative of in vivo stone imaging and SWL treatment. Further work should focus on in vivo stone images and SWL fragmentation in clinical practice to best inform future pragmatic use of CTTA.
Conclusions
This study has identified new quantifiable measures of stone structure, as measured by CTTA-generated metrics of entropy and kurtosis, which, in this experimental SWL setting, strongly predict the number of shocks required for stone fragmentation. It is not possible to draw firm conclusions on the utility of CTTA on the basis of this small ex vivo study, but the results support a proof of principle that CTTA metrics reflect stone architecture when analyzed alongside micro-CT images and stone composition analysis. A larger clinical study is currently underway at our center, for the contribution of CT textural metrics, along with other known clinical factors, to predict likelihood of SWL success. We hope to develop a composite scoring system, using statistical modeling of these variables in a large dataset, which clinicians can then use as part of a clinical decision-making tool when counseling patients. The aim of this would be to increase the success rate of SWL by reducing the number of SWL sessions needed if the stone is identified to be more susceptible to SWL, as well as to counsel patients to surgery if SWL is unlikely to be successful.
Footnotes
Author Disclosure Statement
One author (B.G.) is a director, part-time employee, and shareholder of Feedback Plc (Cambridge, England, United Kingdom), company that develops and markets the TexRAD texture analysis algorithm described in this article. All other authors declare that no competing financial interests exist.