




Abstract
Introduction:
To compare the accuracy and reliability of stone volume estimated by ellipsoid formula (EFv) and CT-based algorithm (CTv) to true volume (TV) by water displacement in an in vitro model.
Materials and Methods:
Ninety stone phantoms were created using clay (0.5–40 cm3, 814 HU ±91) and scanned with CT. For each stone, TV was measured by water displacement, CTv was calculated by the region-growing algorithm in the CT-based software AGFA IMPAX Volume Viewer, and EFv was calculated by the standard formula π × L × W × H × 0.167. All measurements were repeated thrice, and concordance correlation coefficient (CCC) was calculated for the whole group, as well as subgroups based on volume (<1.5 cm3, 1.5–6 cm3, and >6 cm3).
Results:
Mean TV, CTv, and EFv were 6.42 cm3 ± 6.57 (range: 0.5–39.37 cm3), 6.24 cm3 ± 6.15 (0.48–36.1 cm3), and 8.98 cm3 ± 9.96 (0.49–47.05 cm3), respectively. When comparing TV to CTv, CCC was 0.99 (95% confidence interval [CI]: 0.99–0.995), indicating excellent agreement, although TV was slightly underestimated at larger volumes. When comparing TV to EFv, CCC was 0.82 (95% CI: 0.78–0.86), indicating poor agreement. EFv tended to overestimate the TV, especially as stone volume increased beyond 1.5 cm3, and there was a significant spread between trials.
Conclusions:
An automated CT-based algorithm more accurately and reliably estimates stone volume than does the ellipsoid formula. While further research is necessary to validate stone volume as a surrogate for stone burden, CT-based algorithmic volume measurement of urinary stones is a promising technology.
Introduction
A
Traditionally, the longest dimension (LD) on noncontrast CT (NCCT) is used as a surrogate for stone burden. Previously, LD was used to predict stone passage effectively in 88% of cases. 1 Kidney stones are three-dimensional (3D), often irregular in shape, and orientation may not correspond with LD being in the axial plane. As such, using LD is a suboptimal surrogate for stone volume and burden.
Stone volume may be an important predictor of outcome in treatment of stone disease. 2,3 To date, the scalene ellipsoid volume formula (simplified as L × W × H × π × 0.167) is most commonly used to estimate stone volume. This formula has limitations in accurately estimating the volume of an irregularly shaped calculus, for example, a staghorn calculus.
The gold-standard imaging modality in the urolithiasis patient is NCCT of the abdomen and pelvis. 4,5 Using NCCT provides information regarding size, shape, density, and location. Sixty-four channel spiral CT systems, introduced in 2004, have isotropic resolution, that is, equivalent spatial resolution of 0.4 mm in all three axes. 6 This effectively increases accuracy of any volume estimate.
The improvement in coronal and sagittal reconstruction of axial CT images and isotropic resolution has led to development of software-based methods to estimate stone volume. Two such approaches are automated attenuation threshold based calculations and manual tracing of stone circumference in sequential axial images. 3,7 In addition to promising more accurate volumetric assessment, software-based methods virtually eliminate interobserver variability, which can range from 16% to 20%. 7,8
This purpose of this study is to compare accuracy and reliability of stone volume estimated using ellipsoid formula (EFv) and CT-based software tool (CTv) to true volume (TV) measurement by water displacement using an in vitro model.
Materials and Methods
Ninety phantom stones of different volumes and shapes were molded by hand using Craft Smart Polymer clay and baked in an oven (Fig. 1). The material used approximated the density of calcium oxalate stones (based on HU measurement).

Sample of stone phantoms created using polymer clay.
A CT scan was performed with the phantoms placed on a numbered tray using the Philips Brilliance 64 slice CT scanner. The images were saved within the PACS system, AGFA IMPAX Clinapps version 6.6.1.3525. This provides a resolution of 1 mm in the axial, sagittal, and coronal planes consistent with our standard stone protocol CT.
Each stone phantom's volume was measured using three different techniques. First, water displacement was used to establish the TV similarly to previous studies. 7 Each phantom was placed into a measuring cylinder containing sterile water, and the mass change was recorded using the Mettler AC 100 scale. A total of three trials were done for each phantom. Second, the maximal dimensions of the stone in three axes were measured manually by a radiologist (L.K.) on the CT images. The EFv was then calculated using the most commonly used ellipsoid formula approximated as π × L × W × H × 0.167, and this was repeated thrice for each phantom. Third, the volume was estimated using the AGFA IMPAX Volume Viewing 3D software module version 3.1 (Fig. 2). This module allows for volumetric assessment of structures found in axial imaging using one of two methods: region growing algorithm or manual contouring. For this study, we chose to use the region growing algorithm as this method takes <1 minute to complete and is largely automated, thus more closely approximating a method likely to be used in clinical practice.
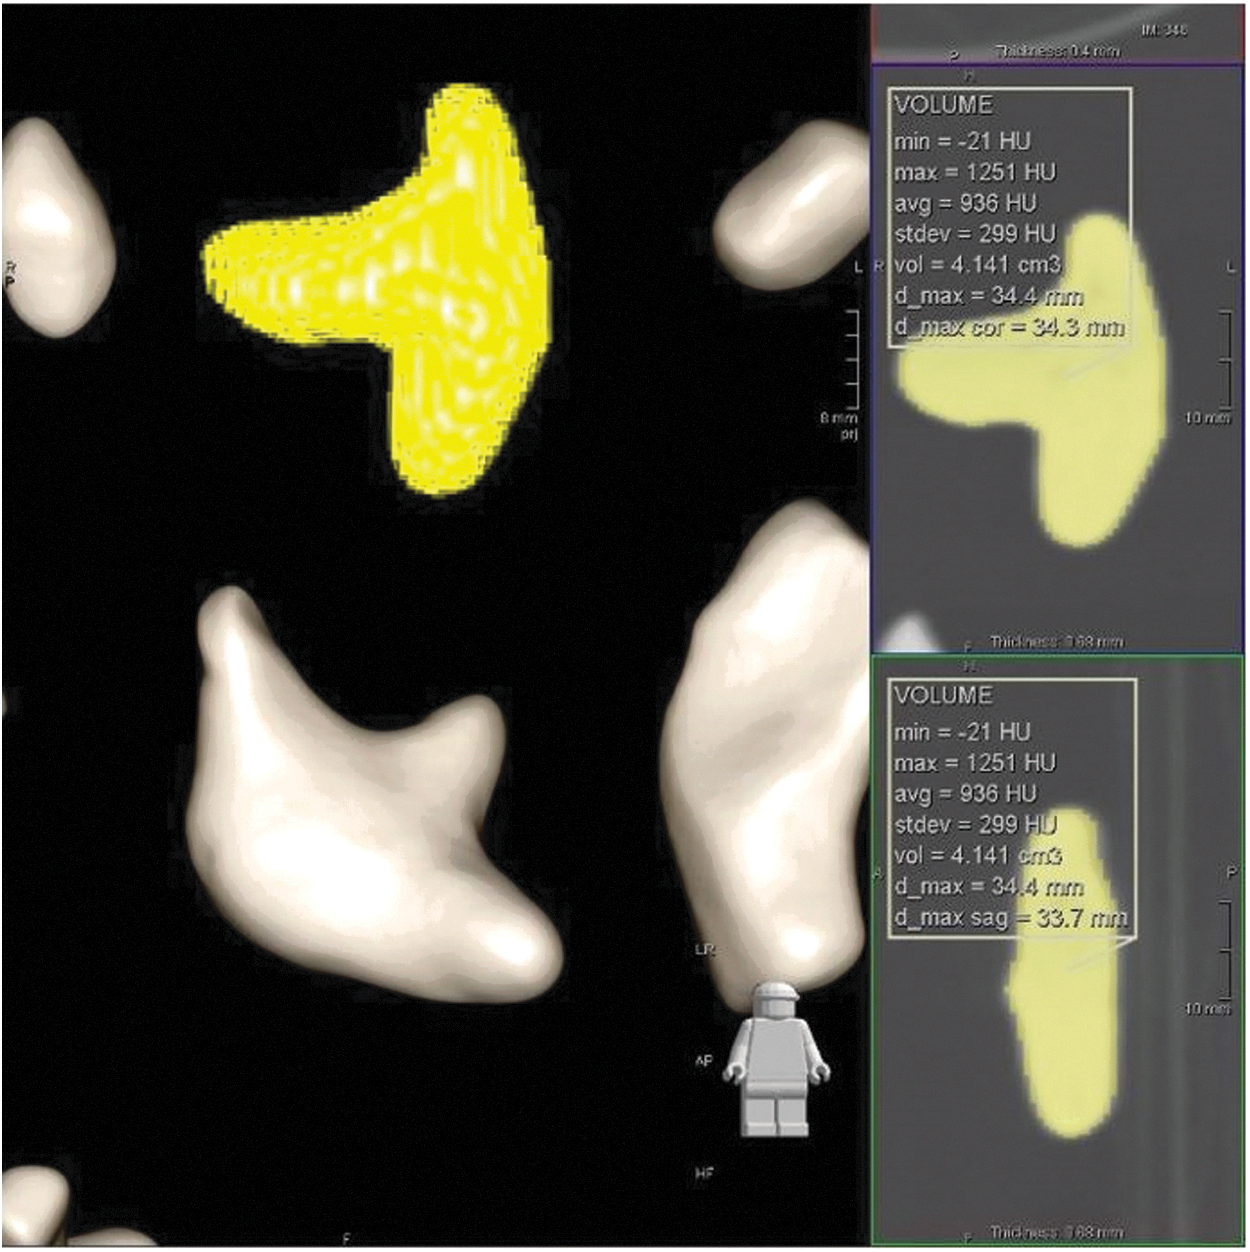
Representative image of volume (CTv) and density data generated by region growing algorithm. CTv = volume estimated by CT-based algorithm.
Using a bone window/level of 1300–110/500–300, a point within the stone (referred to as a seed point) is identified. The algorithm then “grows” a 3D region outward from the seed point until a large change in attenuation values, typically the edge of the stone.
Statistical analysis was performed using Lin's inter-rater concordance correlation coefficient (CCC) to test agreement between EFv or CTv and TV with 95% confidence intervals (CIs).
9
As a general rule, CCC >0.95 indicates excellent agreement or reliability, while CCC of 0.90–0.95 is considered moderate.
10
We then stratified the stones into groups by stone volume: <1.5 cm3, 1.5–6 cm3, and >6 cm3. The cutoffs corresponded approximately to LD measurements of 15 and 25 mm. These represent commonly used cutoffs in routine clinical decision-making in the treatment of stone disease. Finally, a Bland–Altman plot was created to visually display the deviation of the estimated volumes from the true stone volume. A one-way analysis of variance based on square-root transformed data was used to calculate limit of agreement (LoA) due to use of three trials for each stone in each method.
11
Statistical analysis was performed using the R statistical software version 3.3.1 (R foundation,
Results
Mean TV was 6.42 cm3 ± 6.57 (range: 0.5–39.37 cm3). Mean estimated EFv and CTv was 8.98 cm3 ± 9.96 (range: 0.49–47.05 cm3) and 6.24 cm3 ± 6.15 (range: 0.48–36.1 cm3), respectively. Mean volume for each size category was 0.9 cm3 ± 0.3, 3.5 cm3 ± 1.5, and 11.9 cm3 ± 6.85, respectively. The LD in the axial plane ranged from 11–69.1 mm, and the mean of the LD was 29.2 mm ±13.9. The average attenuation in HU for a sample of 10 of the phantom stones was 841 HU ±91.
When comparing TV to CTv, the CCC was 0.99 (95% CI: 0.99–0.995), indicating excellent agreement with the TV. However, when comparing TV to EFv, CCC was 0.82 (95% CI: 0.78–0.86), indicating poor agreement with the TV. CCC was also calculated for each subgroup to test consistency of the measurements for each method and found to agree well with the assessment of the entire data (Table 1).
CCC = concordance correlation coefficient; CI = confidence interval; CTv = volume estimated by CT-based algorithm; EFv = volume estimated by ellipsoid formula; TV = true volume.
The Bland–Altman plot (Fig. 3) shows that volumes obtained by water displacement have excellent reliability. The plot shows that EFv tended to overestimate the TV, especially as stone sizes increased beyond 1.5 cc, and there was a significant spread between trials. Conversely, CTv remained closer to the TV, within the 95% LoA, and was consistent between trials. Volume is slightly underestimated at larger sizes by CTv, but nonetheless showed excellent agreement with TV.

Bland–Altman plot. Blue triangles, individual EFv trials. Red circles, individual CTv trials. Blue/red horizontal lines, mean differences between EFv/CTv and TV. Blue/red curves, local regression analysis of changes of trial average of EFv/CTv. Dashed horizontal lines, upper and lower 95% limits of agreement. Dashed vertical lines, size limits of subgroups. EFv = volume estimated by ellipsoid formula; LoA = limit of agreement; TV = true volume.
Discussion
Current guidelines suggest using LD as a surrogate for stone burden in clinical decision-making in patients presenting with urolithiasis. 5,12 However, LD is a relatively poor surrogate given the 3D nature of stones. Axial surface area has also been used with good clinical utility, but is cumbersome to use in practice. 13 Stone volume, another surrogate for stone burden, has been shown to be predictive of treatment outcome. 3 It can be assessed by ellipsoid formula or automated CT-based software. We created 90 stone phantoms to test the accuracy and reliability of the ellipsoid formula and CT-based algorithm in estimating stone volume compared to the TV as measured by the gold standard, water displacement.
Our analysis suggests that the region growing algorithm is accurate compared to TV and reliable between trials. This is especially apparent compared to the ellipsoid formula, which had worse agreement with the TV and was less reliable between trials. This most likely reflects the data presented by Patel and colleagues, 8 which showed a significant variability in manual linear measurements compared to automated measurements.
The Bland–Altman plot visually shows that the EFv diverged farther from the TV than the CTv, especially as stone volume increased (Fig. 3). Previous studies have shown that the formula does not approximate larger or irregularly shaped stones well. 14
It is possible that the small stones in this study were generally more ellipsoid in nature due to the hand-formed method used to manufacture them (Fig. 1). The large stones were able to be made into more varied shapes and as such were approximated poorly by EFv.
Demehri and colleagues 7 took 36 complete stones from stone procedures and compared various CT-based volume estimate protocols to true water displacement volume. They found that the most accurate and precise protocol used a variable attenuation threshold, similar to the one used in our study. They also found that volume estimates were more accurate for larger stones than for smaller stones, which, too, is reflective of our findings.
At this time, 3D software for volumetric analysis is usually purchased as an add-on to the PACS imaging viewing software. As such, it is typically available readily to radiology department staff. Once the 3D software module is purchased and users are trained, volume estimation by the region-growing method is automated and takes ∼1 minute. We anticipate that as technology improves and prices decrease, software such as the one used in this study will begin to be incorporated widely into PACS viewing clients for all medical staff to use, in the same way that analysis tools for calculating size, area, and density have become standard.
The stone phantoms were made by hand, and so there is an inherent bias and limitation in the shapes that were formed. These may not fully represent the shapes that stones form in situ. We did not use previously described stone phantom models, such as BegoStone Plus or Ultracal 30, as our aim was primarily volume assessment and not stone communition. 15 While our phantoms did have attenuation values consistent with calcium oxalate stones, future in vitro studies may incorporate the use of other stone models such as BegoStone or phantoms with a lower density similar to uric acid stones. It is clear that to validate the results of this in vitro study, we would have to test the algorithm and formula estimates on stones removed from patients in their entirety, as used in the Demehri and colleagues study. 7 The cohort of stone phantoms that we created was generally on the larger side compared to stones found in situ (range: 11–39 cm3).
Our scanning was done by placing the stones on a tray which in turn was placed on the scanning bed. Similar studies have described placing stones within biologic tissue (such as ground meat), which in turn is placed inside a human body phantom placed on the scanning bed. While tissue factors may impact in situ stone volume calculation by CT based methods, the goals of our present study were strictly to compare volume estimation methods and these were met with the model as described.
To our knowledge, direct comparison of the ellipsoid formula and algorithm based estimates of volume to TV has not been reported previously. This study represents a growing interest in harnessing the rapidly evolving technology available to us to make more informed clinical decisions. It is clear that studies such as ours are stepping stones in truly encompassing these techniques into everyday clinical practice. Further in situ and better powered studies are required to validate these findings.
There is significant heterogeneity in reporting of stone burden characteristics. 16 This hinders our ability to compare patient populations and outcomes across the literature. Stone burden measurements used to date certainly have clinical value, but clearly have limitations as well. This study represents an ongoing effort to test and validate measurements that are accurate, reliable, and efficiently implemented in clinical practice.
Conclusions
As high-quality CT technology has become more readily available, more sophisticated means of assessing stone burden have evolved. Stone volume may be a better assessment of stone burden and more predictive of outcomes than LD. Our data suggest that an automated CT algorithm more accurately and reliably estimates stone volume than does the ellipsoid formula. While further research is necessary to validate stone volume as a surrogate for stone burden and its impact on clinical decision-making and outcomes, CT-based algorithmic volumetric assessment of urinary stones is a promising technology.
Footnotes
Author Disclosure Statement
No competing financial interests exist.