
Abstract
Introduction:
Radical cystectomy represents the standard of care for muscle-invasive bladder cancer (MIBC). Due to its novelty the use of robotic radical cystectomy (RARC) is still under debate. We examined intraoperative and postoperative morbidity and mortality in addition to impact on length of stay (LOS) and total hospital charges (THCGs) of RARC compared with open radical cystectomy (ORC).
Materials and Methods:
Within National Inpatient Sample (2008–2013), we identified patients with nonmetastatic bladder cancer treated with either ORC or RARC. We relied on inverse probability of treatment weighting to reduce the effect of inherent differences between ORC vs RARC. Multivariable logistic regression (MLR) and multivariable Poisson regression (MPR) models were used.
Results:
Of all 10,027 patients, 12.6% underwent RARC. Between 2008 and 2013, RARC rates increased from 0.8% to 20.4% [estimated annual percentage change (EAPC): +26.5%, 95% confidence interval (CI): +11.1 to +48.3; p = 0.035] and RARC THCGs decreased from 45,981 to 31,749 United States dollars (EAPC: −6.8%, 95% CI: −9.6 to −3.9; p = 0.01). In MLR models RARC resulted in lower rates of overall complications [odds ratio (OR): 0.6; p < 0.001] and transfusions (OR: 0.44; p < 0.001). In MPR models, RARC was associated with shorter LOS (relative risk 0.91; p < 0.001). Finally, higher THCGs (OR: 1.09; p < 0.001) were recorded for RARC. Data are retrospective and no tumor characteristics were available.
Conclusion:
RARC is related to lower rates of overall complications and transfusions rates. In consequence, RARC is a safe and feasible technique in select MIBC patients. Moreover, RARC is associated with shorter LOS, although higher THCGs.
Introduction
R
Materials and Methods
Data source
To assess complications and in-hospital mortality rates of RARC vs ORC we relied on the National Inpatient Sample (NIS) database (2008–2013). The NIS is a set of longitudinal hospital inpatient databases included in the Healthcare Cost and Utilization Project family, created by the Agency for Healthcare Research and Quality through a Federal-state partnership. 8 The database includes 20% of United States inpatient hospitalizations, with discharge abstracts from 8 million hospital stays. It incorporates patient and hospital information, including Medicare, Medicaid, private insurance, and other insurance type patients.
Study population
Within the NIS database (2008–2013), we focused on patients with a primary diagnosis of bladder cancer (ICD-9-CM code 188; 233.7) aged ≥18 years. Patients with a secondary diagnosis of metastatic disease were excluded (ICD-9-CM code 197.x and 198.x). Primary procedure codes were used to identify radical cystectomy (ICD-9-CM code 57.7; 57.71; 57.79) patients. Secondary procedure codes were used to identify lymph node dissection (ICD-9-CM code 40.3; 40.5). Use of ileal conduit or continent (orthotopic neobladder or continent cutaneous reservoir) urinary diversion was identified using ICD-9 codes 56.51 or 57.87. Robotic procedures were identified according to the modifier codes 17.4 and 17.42. 7
Outcomes of interest
Complications rates were defined using secondary ICD-9 diagnostic codes, as previously described. 9 –11 Intraoperative complications consisted of accidental blood vessel and/or nerve and/or organ puncture or laceration during the procedure. Postoperative complications consisted of cardiac, respiratory, vascular, operative wound, genitourinary, transfusion, parenteral nutrition, miscellaneous medical, and miscellaneous surgical. 7 LOS, provided by the NIS, is calculated by subtracting the admission date from the discharge date. Inflation-adjusted THCGs were defined according to NIS information. 12 In-hospital mortality information is coded from the disposition of the patient.
Patient and hospital characteristics
Patient age, gender, race/ethnicity (Caucasian, African American, and others), Charlson comorbidity index (CCI), 13,14 and insurance status [private insurance, Medicare, Medicaid, and other (self-pay)] were defined according to NIS information. Additional risk variables consisted of hospital region (Northeast, Midwest, South, and West), 15 hospital size (small, medium, and large), and hospital teaching vs nonteaching tatus. Teaching institutions had an American Medical Association-approved residency program, were a member of the Council of Teaching Hospitals, or had a ratio of 0.25 or higher of full-time equivalent interns and residents to non-nursing home beds. 8 Lastly, annual hospital volume (low, medium, and high), representing the number of procedures performed at each participating institution during each study calendar year was calculated and stratified according to tertiles.
Statistical analysis
First, medians and interquartile ranges, in addition to frequencies and proportions were reported for continuous (age, LOS, and THCGs) and categorical variables (gender, race, insurance status, CCI, annual hospital volume, region, hospital size, teaching status, lymph node dissection, parenteral nutrition, and ileal conduit or continent urinary diversion and complications), respectively. The statistical significance of differences in medians and proportions was evaluated with the Kruskal–Wallis and chi-square tests.
Second, estimated annual percentage change (EAPC), was generated using the log-linear regression methodology. Third, nine separate sets of multivariable logistic regressions (MLRs) tested complications and in-hospital mortality rates after ORC and RARC. Fourth, multivariable Poisson regression (MPR) models compared LOS after ORC and RARC. Fifth, log-linear regression compared THCGs after ORC and RARC. Sixth, the analyses were repeated after inverse probability of treatment weighting (IPTW) adjustment and clustering. 16
All statistical tests were two-sided. The level of significance was set at p < 0.05. Analyses were performed using the R software environment for statistical computing and graphics (version 3.4.1;
Results
Descriptive characteristics, rates of cystectomy, and THCGs over time
Among 10,027 patients, 8768 (87.4%) underwent ORC and 1259 (12.6%) underwent RARC.
Most were ≥65 years old (66.4%), male (77.5%) and Caucasian (76.7%). Most (57%) harbored CCI 0 (Table 1).
CCI = Charlson comorbidity index; IPTW = inverse probability of treatment weighting; IQR = interquartile range; LOS = length of stay; THCGs = total hospital charges; USD = United States dollars.
Between 2008 and 2013, RARC rates increased from 0.8% to 20.4% (EAPC: +26.5%, 95% confidence interval (CI): +11.1 to +48.3; p = 0.035) (Fig. 1). Conversely, ORC rates decreased from 97.5% to 78.8% (EAPC: −3.7%, 95% CI: −2.2 to −5.5; p = 0.008).
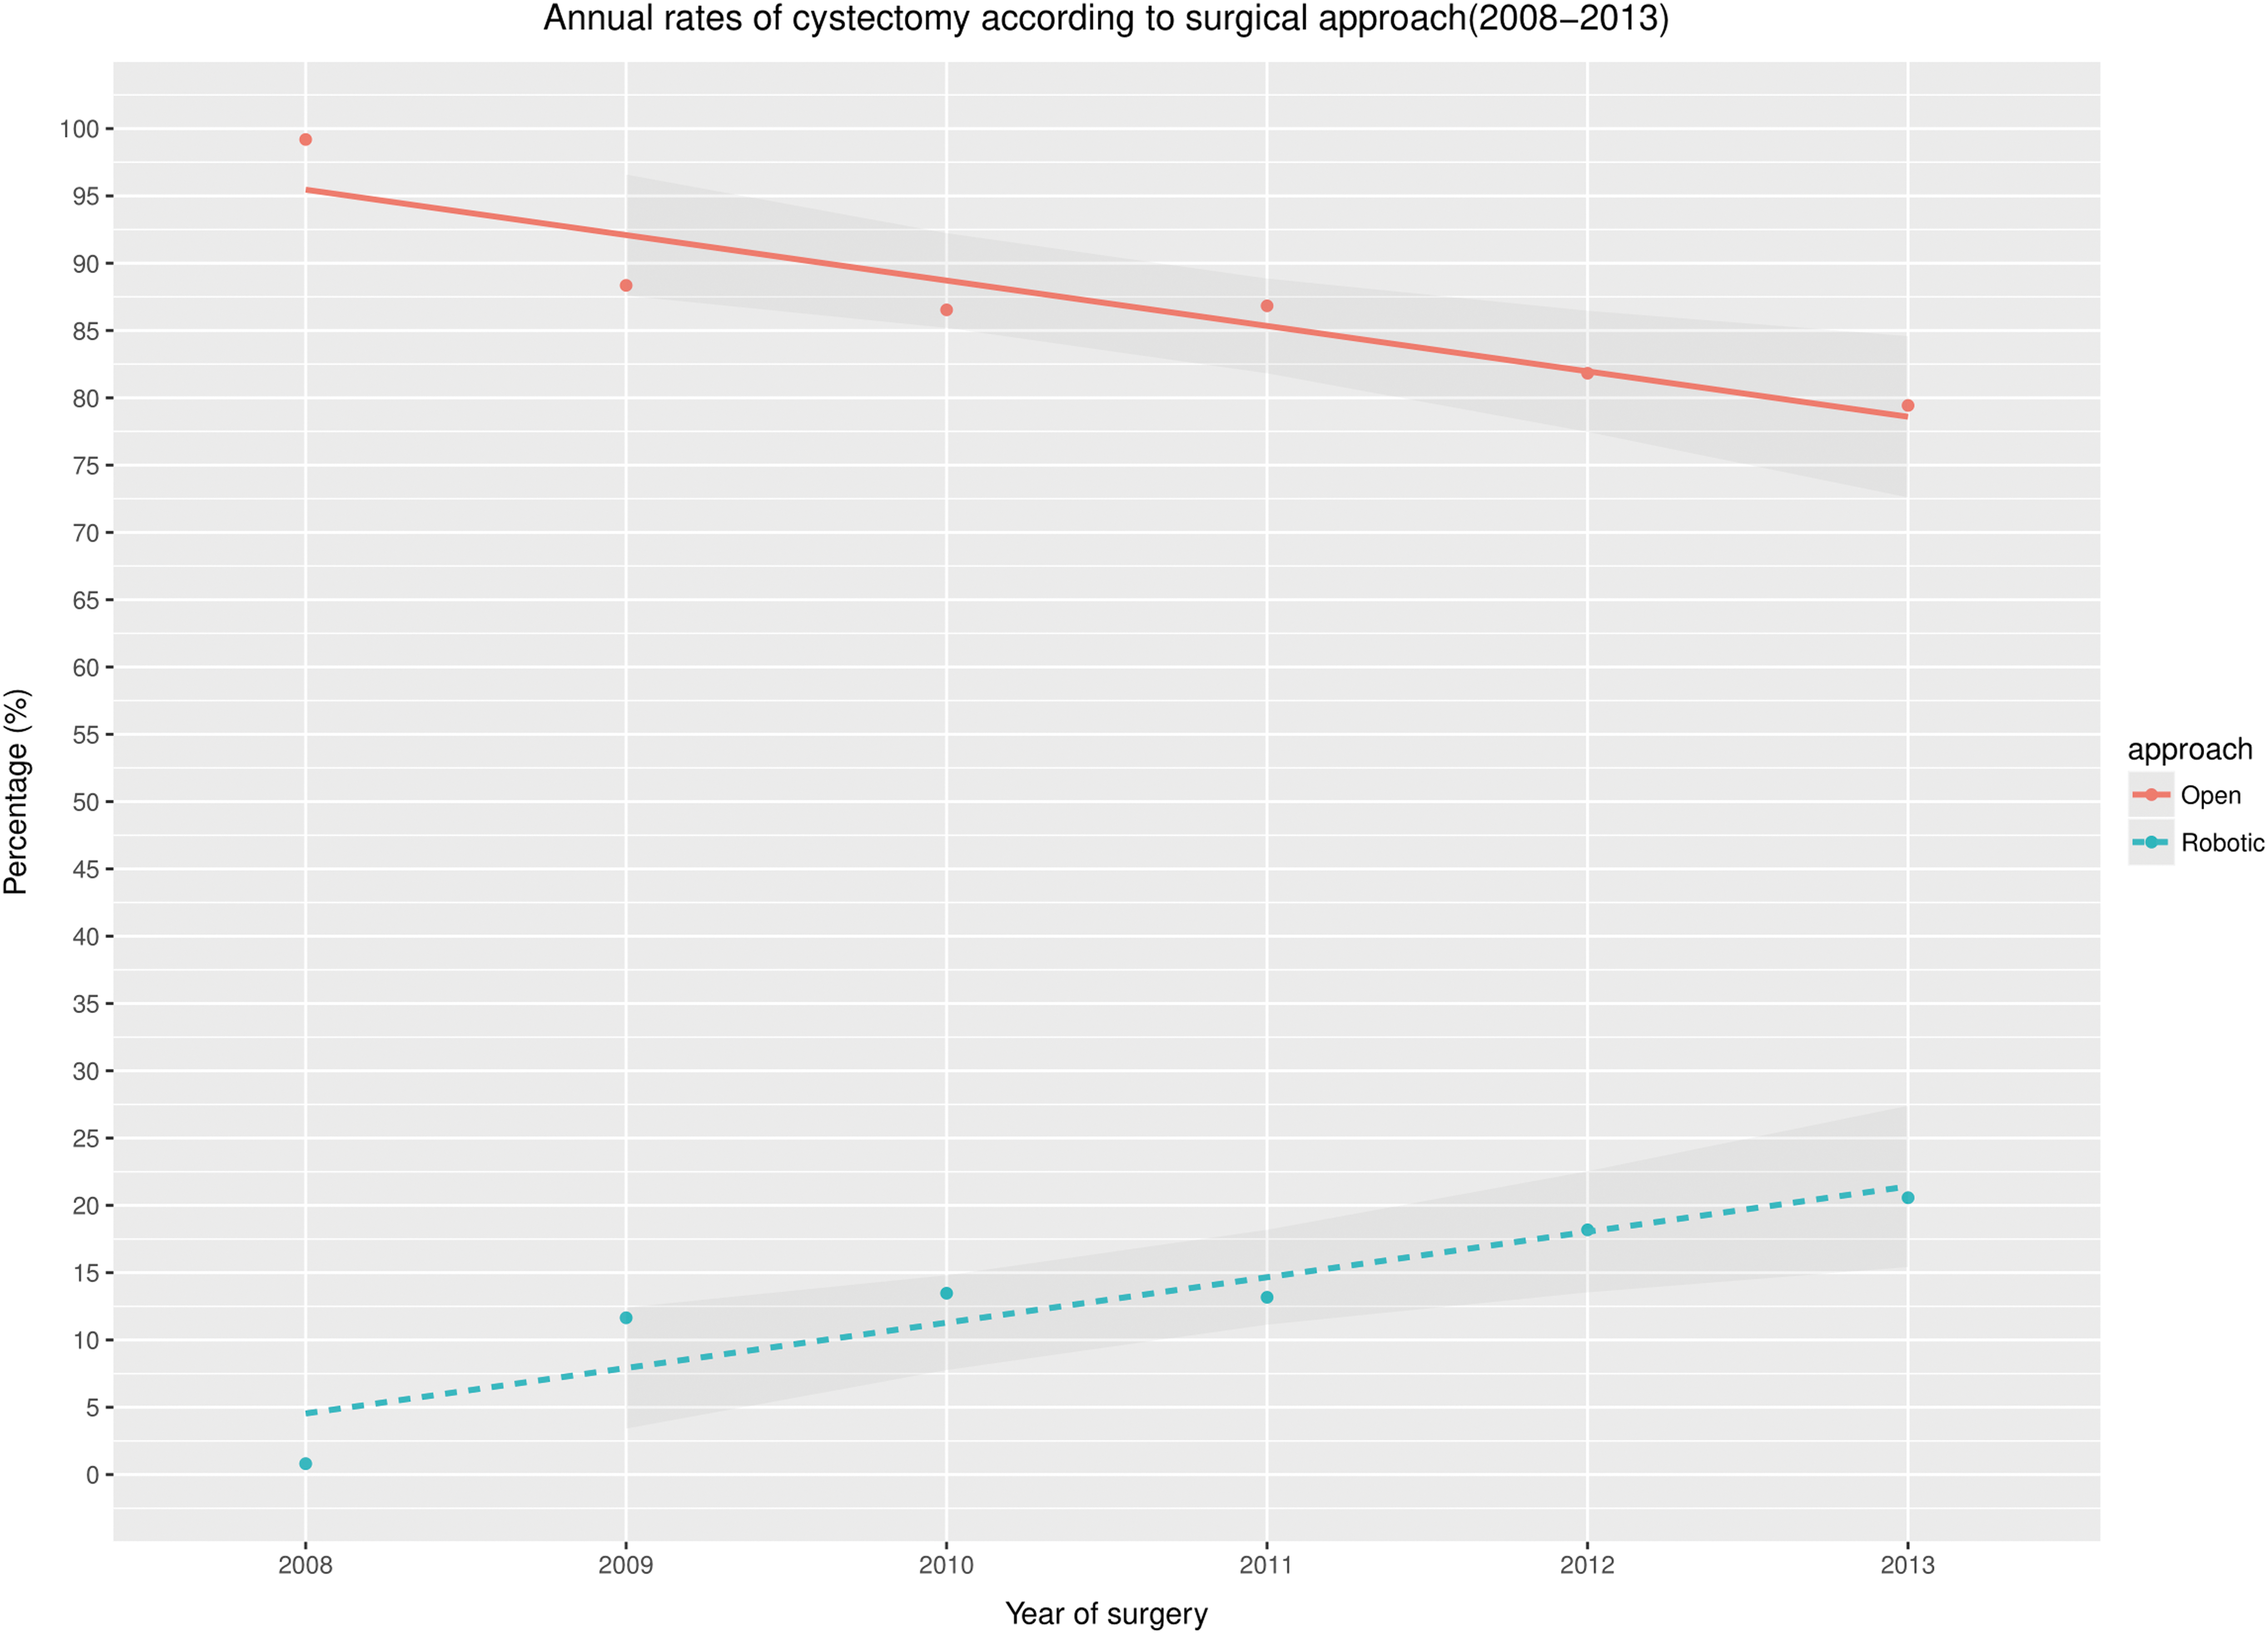
Cystectomy rates over time.
During the study span THCGs decreased in RARC. In 2008, RARC average THCGs were 45,981 United States dollars (USD) vs 31,749 USD in 2013 (EAPC: −6.8%, 95% CI: −9.6 to −3.9; p = 0.01). Conversely, THCGs did not decrease in ORC. In ORC 2008 average THCGs were 35,953 USD vs 30,858 USD in 2013 (EAPC: −2.8%, 95% CI: −5.1 to −0.5; p = 0.08) (Fig. 2). RARC patients, compared to their ORC counterpart, had higher income (third quartile 27.2% vs 24.5%, fourth quartile 25.7% vs 23.3%; p = 0.006) and were more likely to receive lymph node dissection (91.2% vs 82.2%; p < 0.001). No significant differences were observed in term of continent urinary diversion rates and CCI rates (Table 1).

Annual average cost trend according to open and robotic cystectomy. THCGs = total hospital charges; USD = United States dollars.
Overall complications rates were respectively 70.2% in ORC patients and 59.3% in RARC patients. Overall complications rates did not change over the study span for both RARC (EAPC: −1.4%, 95% CI: −3.8 to 1; p = 0.3) and ORC (EAPC: −0.9%, 95% CI: −3.8 to 2.10; p = 0.6). Most common complications for ORC and RARC were, respectively, miscellaneous medical (39.4% vs 37.3%; p = 0.2), transfusion (35% vs 19.4%; p < 0.001), and genitourinary complications (17.6% vs 15.1%; p = 0.01) (Table 2).
MLR models testing complications and in-hospital mortality rates after ORC and RARC
In MLR models adjusted for all covariates, overall complications [odds ratio (OR): 0.62, p < 0.001], intraoperative complications (OR: 0.61, p = 0.03), respiratory complications (OR: 0.76, p = 0.001), wound complications (OR: 0.51, p < 0.001), genitourinary complications (OR: 0.81, p = 0.02), and miscellaneous surgical complications (OR: 0.58, p < 0.0005) were lower after RARC. Moreover, RARC patients had lower parenteral nutrition rates (OR: 0.70, p = 0.002) and transfusion (OR: 0.45, p = 0.0001) rates. No statistically significant difference was recorded for in-hospital mortality rates (Table 3).
Analyses adjusted for year of diagnosis, age at diagnosis, gender, Charlson comorbidity index, insurance status, region, teaching status, urinary diversion, lymph node dissection, hospital volume, income, and bed-size.
CI = confidence interval; OR = odds ratio.
MLR models testing complications and in-hospital mortality rates after ORC and RARC after IPTW and clustering
After IPTW and adjustment for clustering, overall complications (OR: 0.6, p < 0.001), respiratory complications (OR: 0.77, p = 0.01), wound complications (OR: 0.48, p < 0.001), genitourinary complications (OR: 0.78, p < 0.001), and miscellaneous surgical (OR: 0.62, p = 0.002) complications rates were lower after RARC. Moreover, patients who underwent RARC had lower rates of parenteral nutrition (OR: 0.66, p = 0.001) and transfusions (OR: 0.44, p = 0.007) (Table 4).
Analyses adjusted for year of diagnosis, age at diagnosis, gender, Charlson comorbidity index, insurance status, region, teaching status, urinary diversion, lymph node dissection, hospital volume, income, and bed-size.
MPR models testing for impact of surgical technique on LOS adjusted for clustering and IPTW
In MPR models adjusted for all covariates, RARC [relative risk (RR): 0.91, p < 0.001] represented an independent predictor for shorter LOS. After either RARC or ORC, the strongest determinants of higher LOS were wound complications (RR: 1.85, p < 0.001), miscellaneous medical complications (RR: 1.4, p < 0.001), and respiratory complications (RR: 1.27, p < 0.001) (Table 5).
RR = relative risk.
Multivariable log-linear regression models testing for impact of surgical technique on THCGs adjusted for clustering and IPTW
In multivariable log-linear regression models adjusted for all covariates, RARC (OR: 1.09, p = 0.005) represented an independent predictor for higher THCGs. After either RARC or ORC the strongest determinants of higher THCGs were wound complications (OR: 1.48, p < 0.001), miscellaneous surgical complications (OR: 1.33, p < 0.001), and respiratory complications (OR: 1.26, p < 0.001) (Table 6).
Discussion
Robotic surgery is nowadays widely adopted in urological surgery. However, its role in radical cystectomy for MIBC is still under debate. Data from RCTs are in disagreement. 4 –6 Institutional series were published comparing ORC and RARC. However, the sample sizes were small and usually, originated from tertiary care referral centers. 17 –19
The most recent population-based study focused on NIS database was published by Yu and colleagues 7 considering 224 RARCs performed in 2009. The authors reported fewer complications and fewer in-hospital deaths in RARC compared with ORC, moreover, RARC patients had lower parenteral nutrition use compared with the counterpart, LOS was comparable. In addition, Hu and colleagues 20 reported on perioperative outcomes and costs relying on Surveillance, Epidemiology, and End Results Program-Medicare linked database and Hanna et al. 21 reported on perioperative outcomes relying on the National Cancer Database. Nonetheless, this is the most contemporary study based on NIS database and the first study to analyze trend of costs. Our analyses revealed several noteworthy findings.
First, RARC use rates increased over the study span (2008–2013) from 0.8% to 20.4% and ORC rates decreased from 97.5% to 78.8% (Fig. 1). This increase is higher than reported by Hu et al. 20 and can be explained by greater contemporary nature of our data that include patients operated in 2013. These findings also confirm the confidence in RARC based on an ongoing increase in annual RARC rates.
Second, average THCGs difference between RARC and ORC was 10,028 USD in 2008. However, a significant decrease of THCGs was recorded after RARC (EAPC: −6.8%, 95% CI: −9.6 to −3.9; p = 0.01). Conversely, decrease in THCGs in ORC was not statistically significant (EAPC: −2.8%, 95% CI: −5.1 to −0.5; p = 0.08). However, ORC represents the standard of care. In consequence, little changes in THCGs were expected during the span of the study, given that relative few modifications have been made to the surgical technique and perioperative care in ORC. It is noteworthy that overtime the decreasing average THCGs for RARC reduced the difference between RARC and ORC from an initial gap of 10,028–891 USD. To the best of our knowledge we are the first to provide a detailed charge analysis that is based on annual figures (Fig. 2) in additional to annual trends. Other investigators reported THCGs comparison that relied on analyses on figures recorded for one single year of observation 7 or cumulative figures over several years, 22 neither allowed to arrive at the observation reported in this study where a decreasing gap was observed between RARC and ORC. This finding is particular important in the context of cost containment for health expenditures. This said, when the entire patient cohort is considered over the entire study span RARC remains more expensive relative to ORC (OR: 1.09, p < 0.001) (Table 6).
Third, in MLR models predicting complications, RARC resulted in lower overall, respiratory, wound, genitourinary and miscellaneous surgical complications. Moreover, patients underwent RARC had lower transfusions and parenteral nutrition rates. The results were confirmed after IPTW and adjustment for clustering (Table 4). Our results showed several differences from the previous report of Yu and colleagues, 7 who found no difference between ORC and RARC in transfusion, respiratory, wound, genitourinary, and miscellaneous surgical complications rates. Conversely, the authors reported lower in-hospital mortality in RARC patients, this finding was not confirmed in our analyses. Taken together, our findings are equally encouraging to those reported for THCGs with an advantage shown for RARC over ORC.
Fourth, in MPR models predicting LOS after RARC and ORC, RARC resulted as a predictor of shorter LOS (OR: 0.91, p < 0.001) (Table 5). Our results are in disagreement with Yu and colleagues 7 who reported no difference between RARC and ORC after propensity score matching. However, our results are consistent with Leow et al., 22 Hu et al., 20 and Hanna et al. 21 Taken together, these observations show an advantage on LOS for RARC in more contemporary patients.
In summary, we examined several different endpoints and RARC demonstrated better outcomes for postoperative complications and LOS. However, RARC still showed a THCGs disadvantage. Moreover, analyses overtime showed improvement in RARC characteristic. For example, THCGs decreased overtime. Based on this observation RARC represent a valid alternative to ORC in properly select patients in whom RARC can be delivered at tertiary care institutions by experienced surgeons.
Our study is not devoid of limitations. First, only inpatients information was available in the database we analyzed and no data were available regarding readmissions and late complications. 7 Second, our study was unable to adjust for tumor characteristics. Third, we were not able to control for some risk factors, such as laboratory values, opioid use, and anesthesia-specific considerations.
Fourth, in our analyses it was not possible to distinguish between intracorporeal and extracorporeal urinary diversion in RARC patients because of the lack of a specific modifier code. Finally, we were also not able to assess whether chemotherapy or radiation therapy was given before surgery.
Conclusion
RARC is related to lower in-hospital rates of overall complications and transfusions. In consequence, RARC is a safe and feasible technique in select MIBC patients. Moreover, RARC is associated with shorter LOS although, higher THCGs.
Footnotes
Acknowledgments
The data acquisition was entirely covered by the investigators without any external source of funding. This research did not receive any specific grant from funding agencies in the public, commercial, or not-for-profit sectors.
Authors' Contributions
S.N. and Z.T. had full access to all the data in the study and take responsibility for the integrity of the data and the accuracy of the data analysis.
Author Disclosure Statement
S.N. certifies that all conflicts of interest, including specific financial interests and relationships and affiliations relevant to the subject matter or materials discussed in the article (e.g., employment/affiliation, grants or funding, consultancies, honoraria, stock ownership or options, expert testimony, royalties, or patents filed, received, or pending), are the following: None.