
Abstract
Introduction:
CT is the gold standard for visualizing renal and ureteral calculi. CT three-dimensional reformatting allows for automatic, accurate, and reliable measurement of stone size, volume, density, and location. In this study, we aimed to develop and test a software platform capable of calculating a battery of clinically important urinary stone parameters at the point-of-care (POC).
Methods:
The syngo Calcium Scoring (Siemens Corporation) algorithm was modified to identify calcium-based stones using an attenuation threshold (250 HU) within a region of interest. Information automatically obtained after reconstruction included voxel sum and calculated volume, maximum diameter, largest diameter in the x, y, and z planes, cumulative diameter, distribution of attenuation in HU, and position relative to the skin for calculation of the skin-to-stone distance (SSD). This algorithm was packaged into a stand-alone application (MATLAB 9.1). From April 2017 to May 2017, all patients undergoing a noncontrast CT of the abdomen or the abdomen and pelvis at the Johns Hopkins Hospital were eligible for inclusion in this validation cohort.
Results:
A total of 55 index renal stones were included. The mean volume calculated by voxel sum was 216.53 mm3 (standard deviation [SD] ±616.19, range 1.50–4060.13). The mean volume calculated using the Ackermann's formula and for a sphere was 232.96 mm3 (SD ± 702.65, range 1.24–4074.04) and 1214.63 mm3 (SD ± 4233.41, range 1.77–25,246.40), respectively. The mean largest diameter in any one direction was 6.95 mm (SD ± 7.31, range 1.50–36.40). The maximum density of the stones ranged from 164 to 1725 HU. The mean SSD at the shortest possible point was 14.19 cm (SD ± 6.13, range 6.67–31.28).
Conclusions:
We developed a stand-alone platform with a simple easy-to-use interface, which will allow any user the ability to calculate a battery of clinically important urinary stone parameters from CT imaging at the POC. This program is now freely available online.
Introduction
R
Although CT is incredibly accurate, calculating stone characteristics such as size, volume, density, and location remains cumbersome to perform and inconsistently applied across both clinical care and the reporting of research outcomes. 6 Despite this difficulty, the importance of these parameters for appropriate patient counseling and treatment selection cannot be understated. 7 –9
Traditionally, only stone size is calculated, often in only a single dimension using computer-aided manual calipers performed either by the radiologist or by the urologist. 6,10 The volume of the stone can then be derived from these dimensions by inputting them into a formula. The disadvantage of this approach is that no formula (sphere, ellipsoid, etc.) perfectly matches that of an irregular renal or ureteral stone. 11 Furthermore, the measurements performed are not always exact or reproducible. 12 However, with the introduction of CT three-dimensional (3D) reformatting, computer-aided tools, and algorithms, it is now possible to measure the size, volume, density, and the relative location of the stone directly from the image metadata.
Acquiring clinically important information directly from imaging metadata is not a new concept, but one, which was pioneered in cardiology for coronary artery calcium scoring. 13 Since that original application, it has been extended, at least in a limited capacity to calculate renal stone volume. 11,12,14 –17 Despite the promise of this automation to provide accurate clinically relevant stone parameters, it has yet to gain popularity. We believe that this is in large part due to the lack of a freely available, user-friendly software package capable of analyzing CT imaging data. To fill this void, we developed a stand-alone platform with a simple easy-to-use interface, which would allow any user the ability to calculate a battery of clinically important urinary stone parameters at the point-of-care (POC).
Methods
CT imaging
All CT imaging were performed on the SOMATOM Definition Flash CT Scanner (Siemens Corporation, Washington, DC). The CT protocol was set at 120 kVp with a reconstructed 0.5 mm slice thickness. All scans of the abdomen and pelvis without contrast were performed.
Segmentation algorithm
The syngo Calcium Scoring (Siemens Corporation) algorithm was modified to identify calcium-based stones using an attenuation threshold within a region of interest (ROI). Each unique stone does require a separate ROI. An initial attenuation threshold of 250 HU was selected to ensure as much as possible that the stone remains as a single object during region growing, while eliminating adjacent soft tissue. Body habitus has no influence on the segmentation of the stone as long as the correct ROI is defined. However, slice thickness of the scan will have an impact on segmentation accuracy, as thinner slices will provide greater detail of the underlying anatomy. To facilitate even greater accuracy in the segmentation of the stones, the attenuation threshold was set as an adjustable value on the user interface. The segmented binary images were obtained, followed by an automatic reconstruction using marching cubes algorithm. Initial isovalue (ISO) value was selected as 0.4 to make sure the reconstructed stone has a smooth surface. Similarly, the ISO value was set as a controllable parameter to adjust the reconstructed effect. From the reconstructed region, information is automatically derived, which includes voxel sum and calculated volume, maximum diameter, largest diameter in the x, y, and z planes, cumulative diameter, distribution of attenuation in HU, and position relative to the skin for calculation of the skin-to-stone distance (SSD). It will even calculate these parameters for branched irregularly shaped stones (Fig. 3).
User application
This algorithm was packaged into a stand-alone application (MATLAB 9.1; Natick, MA). The application was developed on a Windows 10 64-bit PC and runs on either Windows 64-bit or macOS (Apple Inc.) operating systems. The MATLAB program is not required to run the application as it is exported as a stand-alone executable application. The application allows for easy import of Digital Imaging and Communications in Medicine (DICOM) images directly from picture archiving and communication system (PACS) or other file source (Fig. 1). The program requires all images from a given scan to perform the segmentation. Once the files are imported, the user-friendly interface allows for rapid selection of the ROI (Fig. 2) to generate the reconstructed stone (Fig. 3). If this is not satisfactory, then it is possible to manually modify the attenuation threshold or reconstruction parameters to generate a closer fit to the visualized stone. The user-friendly interface is shown in Figure 4. Once reconstructed, the output data are clearly displayed and available for export as a table. Full versions of the program for Windows 64-bit and macOS (Apple Inc.) operating systems are available online (
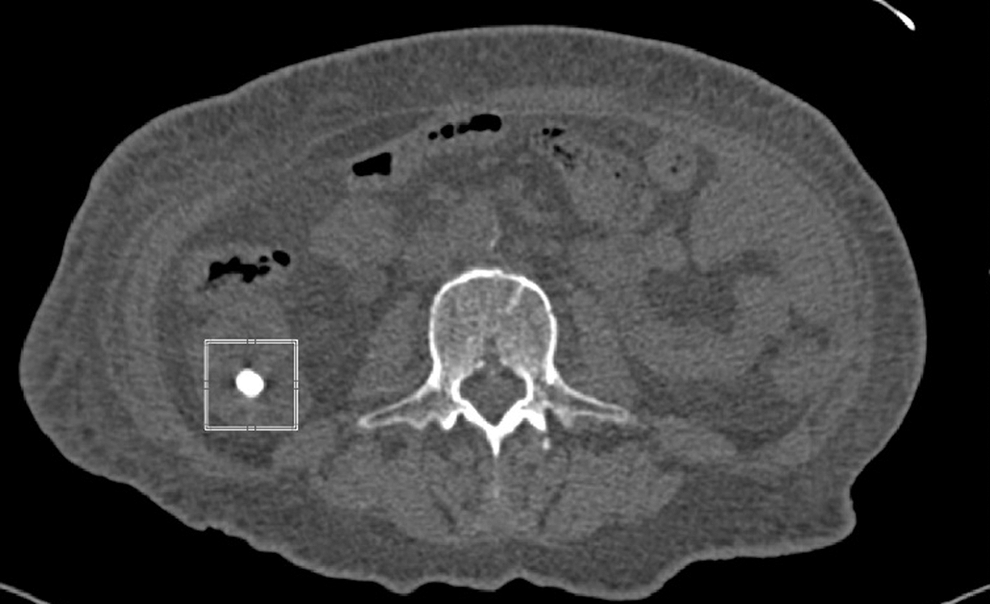
The box highlights the index renal stone on a single representative CT slice.
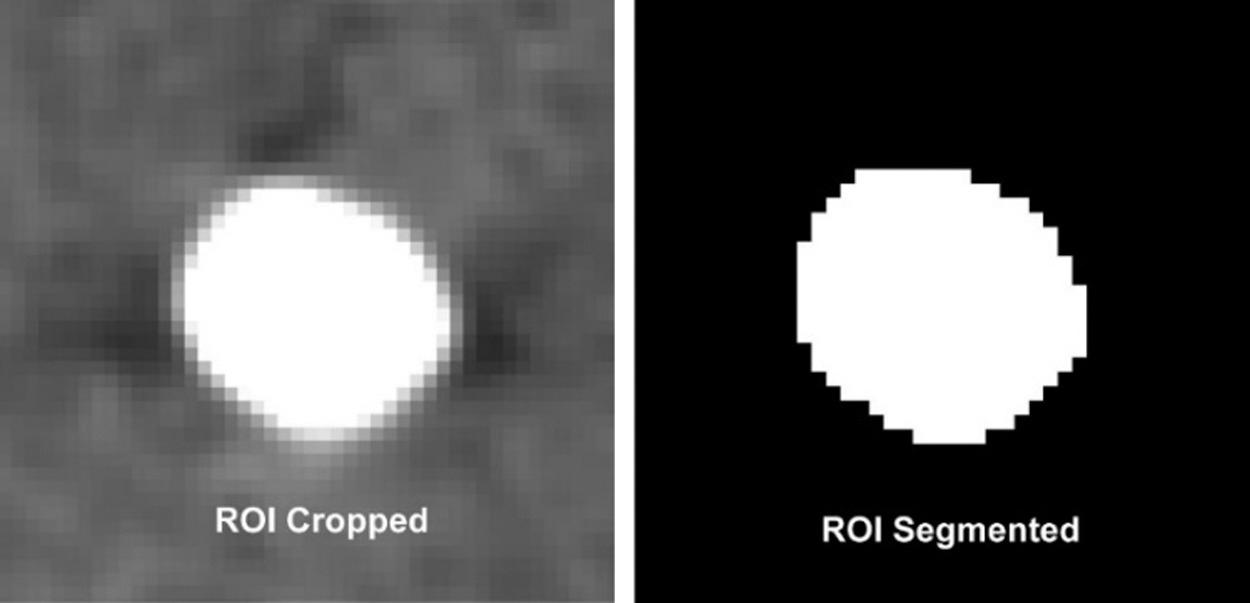
Index renal stone selected, cropped, and segmented. ROI = region of interest.

Reconstructed index renal stone and its bound sphere.
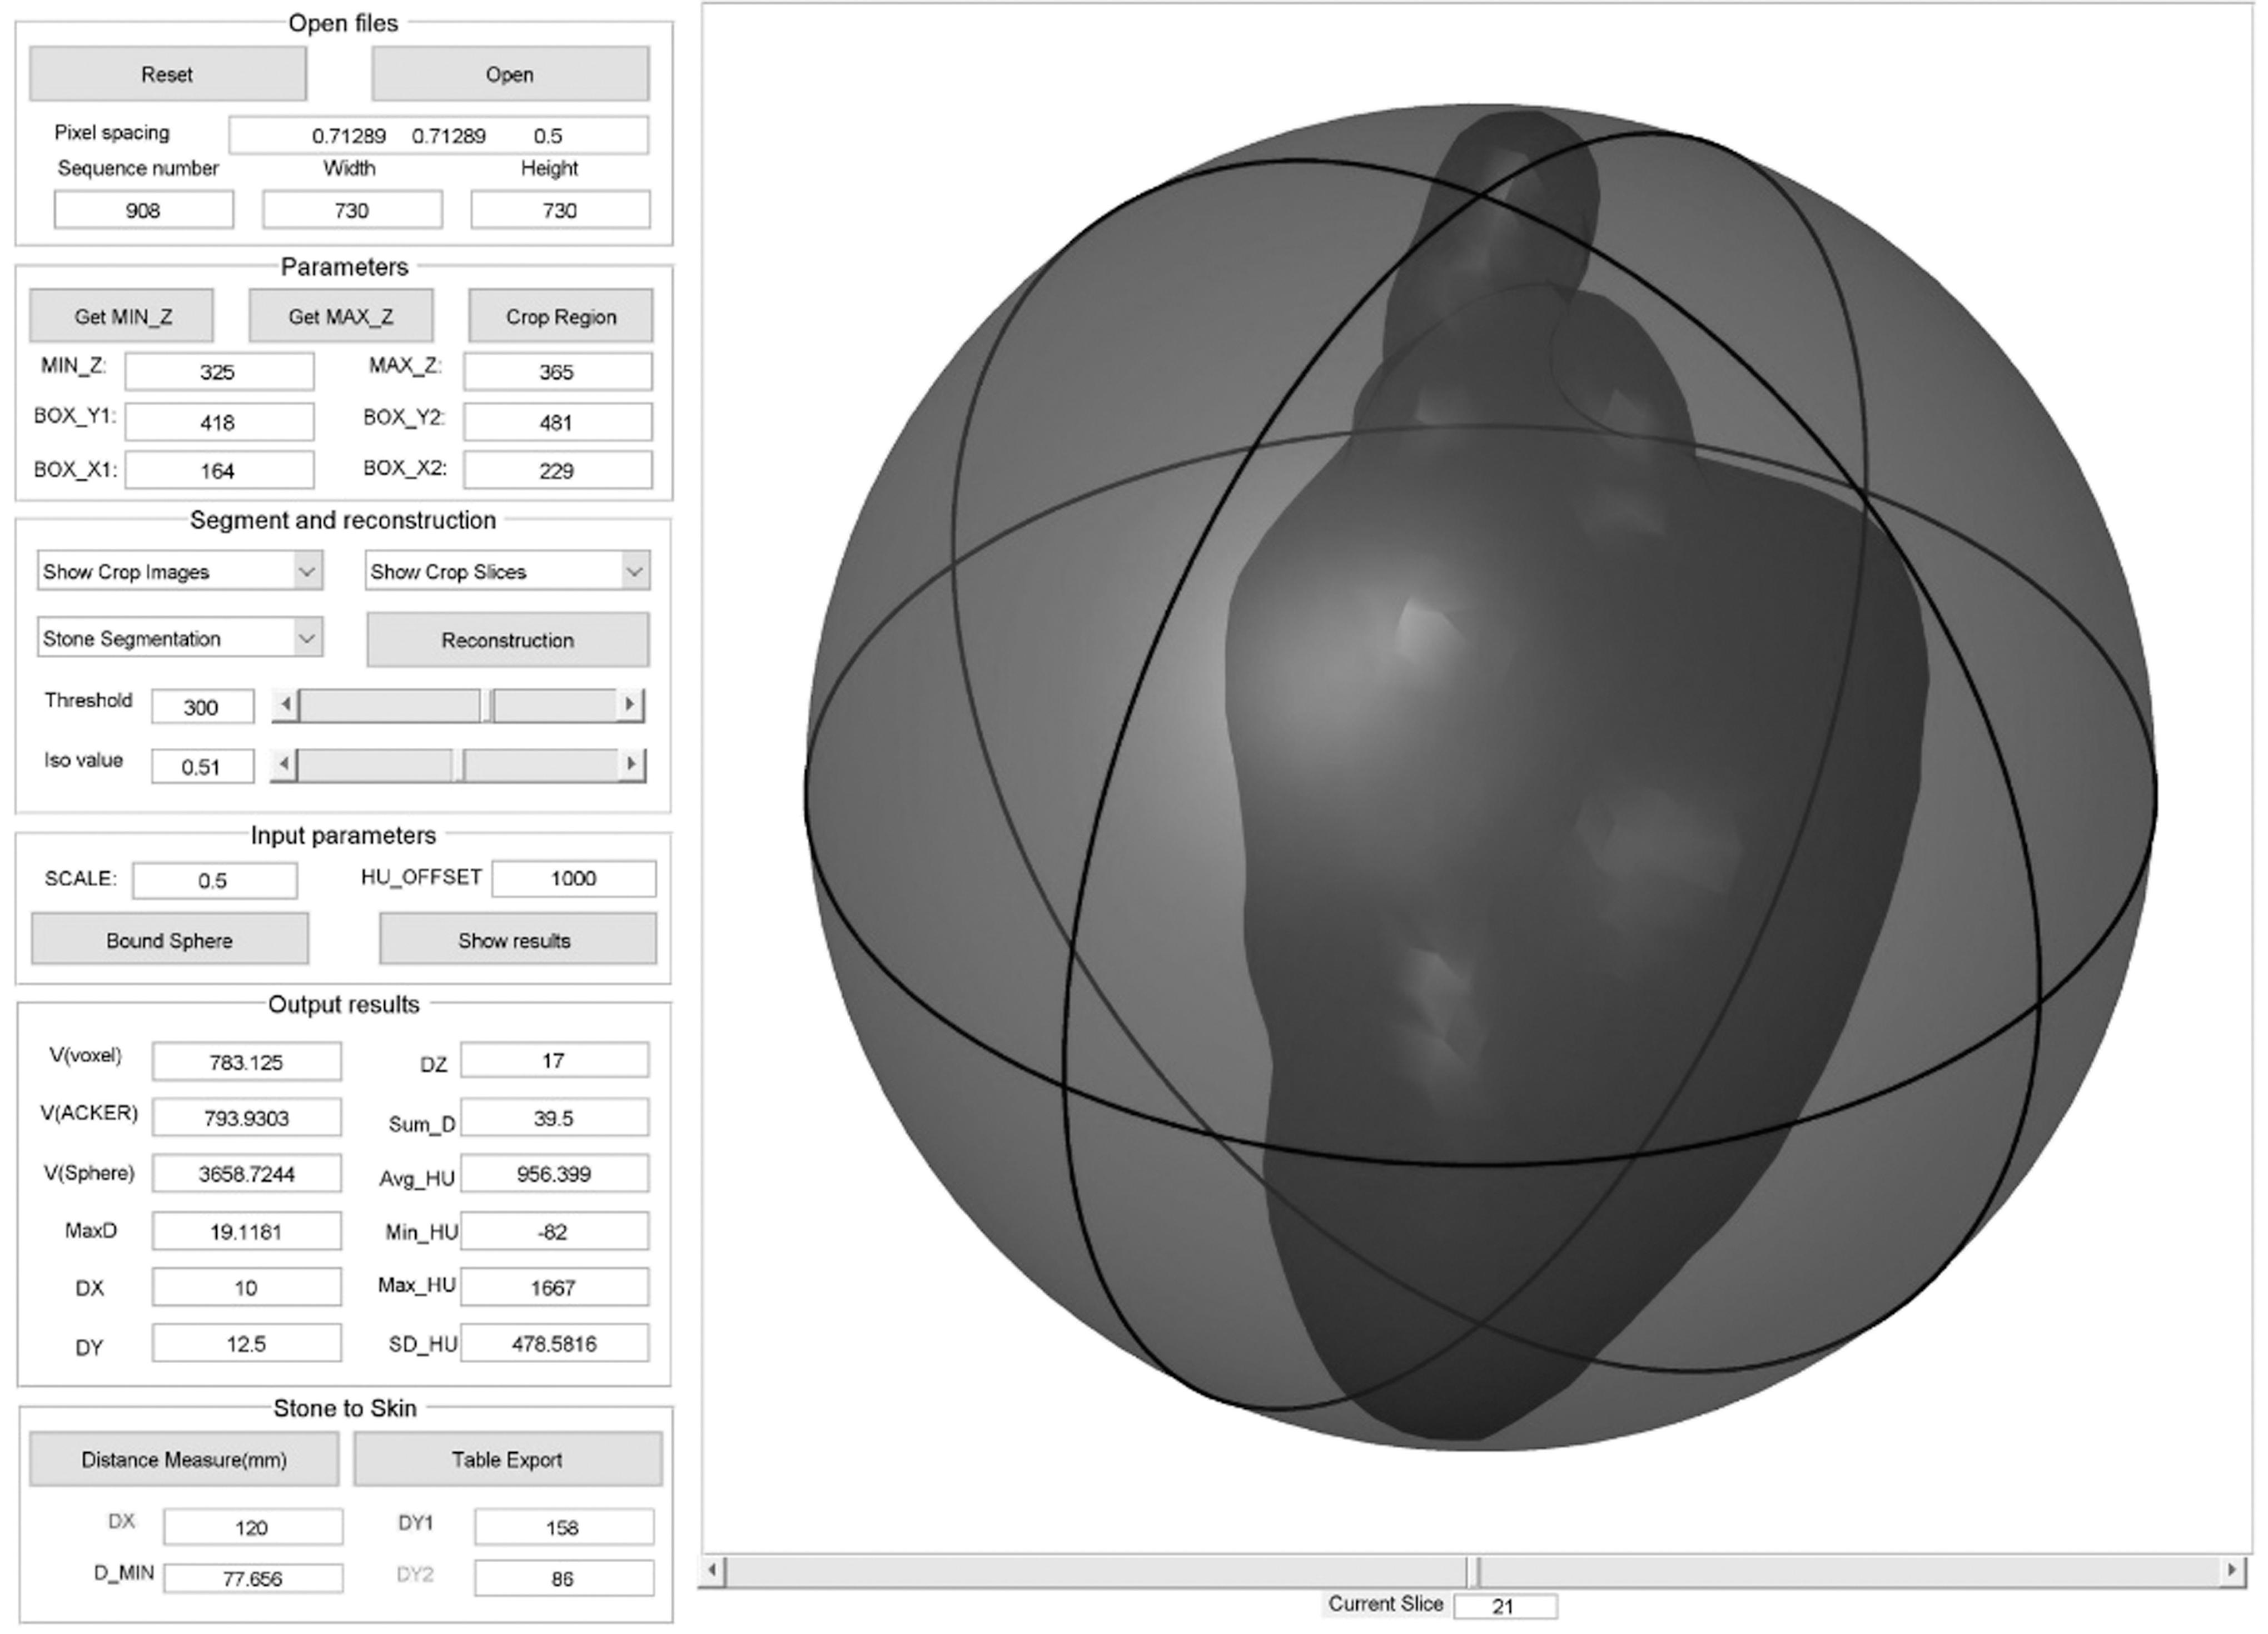
User-friendly interface showing bounded sphere of index renal stone.
Study population
From April 2017 to May 2017, all patients undergoing a noncontrast CT of the abdomen or the abdomen and pelvis at the Johns Hopkins Hospital were eligible for inclusion. At the conclusion of the 1-month eligibility period, natural language processing was utilized to identify dictated radiology reports, which included the phrase “renal stone.” The images of these patients were then reviewed by the study team to confirm that a renal stone was visible. If a renal stone was confirmed, then the imaging study was included in the final cohort.
Analysis
Each patient's CT scan was extracted from PACS in de-identified DICOM format and then opened with the stone analysis program. If multiple stones were present, then a representative single stone was selected as our ROI. The parameters calculated for each ROI included volume (voxel, mm3), maximum diameter (mm), largest diameter in x, y, and z dimensions (mm), cumulative diameter (mm), density (HU), and SSD. Volume was measured directly by summing all voxels within the stone, calculated using the formula for a sphere (4/3πr 3 , where r is the maximum radius in any one direction), and the formula based on Ackermann's water displacement model [0.6(area) 1.27 , where area is calculated as πr2 representing the area of a circle at the midpoint of the stone]. 18 SSD was calculated automatically by identifying the distance in the x and y axis from the ROI to the skin surface with identification of a line representing the shortest distance to the skin in the posterior direction. This study was approved the Johns Hopkins Institutional Review Board with informed consent waived.
Results
A total of 55 patients were identified through the screening process with all patients verified to have a renal stone on imaging. Thus, the final study cohort consisted of 55 index renal stones. The mean volume calculated by voxel sum was 216.53 mm3 (standard deviation [SD] ±616.19, range 1.50–4060.13). The mean volume calculated using the Ackermann's formula and for a sphere was 232.96 mm3 (SD ± 702.65, range 1.24–4074.04) and 1214.63 mm3 (SD ± 4233.41, range 1.77–25,246.40), respectively. The mean largest diameter in any one direction was 6.95 mm (SD ± 7.31, range 1.50–36.40). The maximum density of the stones ranged from 164 to 1725 HU. The mean SSD at the shortest possible point was 14.19 cm (SD ± 6.13, range 6.67–31.28). The calculated parameters for each individual stone are summarized in Table 1.
HU = Hounsfield units; SD = standard deviation; SSD = skin-to-stone distance.
Discussion
In this study, we achieved our goal of developing a stand-alone platform with a simple easy-to-use interface, which would allow any user the ability to calculate a battery of clinically important urinary stone parameters from CT imaging at the POC. Unique to this study is that we have made this program freely available via direct download for use in clinical care or within the research community.
The importance of urinary stone parameters, such as stone size, density, and location, cannot be understated in helping urologists to appropriately counsel patients and then select the optimal treatment modality for stone removal. The American Urological Association Guideline on the Surgical Management of Stones provides an evidence-based framework for optimal clinical care using these parameters. 7,8 For example, we know that spontaneous stone passage rate dramatically decreases with increasing stone size and a more proximal location. 7 –9 Similarly, for shockwave lithotripsy, stones that are large, dense, or located in an unfavorable location, such as in the distal or mid-ureter, or at an increased distance from the skin have lower rates of fragmentation than ureteroscopy. 7,8,19 Recently, stone volume has also demonstrated prognostic value in predicating a variety of clinically relevant outcomes like success with a trial of spontaneous passage and recurrent stone events after percutaneous nephrolithotomy. 16,20,21
Despite the obvious value of knowing these renal stone parameters, typically stone size, often in only a single dimension is readily available or reported. 10 However, with CT now the de facto gold standard for renal stone imaging and 3D reformatting, computer-aided tools, and algorithms readily available across all major CT platforms, 22,23 it is no longer acceptable to rely only on the manual calculation of the largest dimension of the stone to make clinical decision. Instead, we must leverage these CT capabilities to make all clinically relevant renal stone parameters accessible at the POC.
In fact, this is not a new concept. It was first attempted in 1989 by Ackermann and colleagues, 18 where they developed a computer program to calculate stone volume based on a traced area of the stone from a radiograph. Since that time, our technology has substantially increased. It is now accepted that CT attenuation threshold segmentation algorithms can accurately and precisely measure stone parameters, particularly axial dimensions and volume. 15,17 Furthermore, automated calculations are significantly more reproducible and reliable than manual measurements with electronic calipers. 19
Despite the growing literature on the value of automated stone parameter calculation, its use in routine clinical practice remains restricted. It is unlikely that this is due to a lack of availability of modern CT technology. Multidetector CT were first introduced in 1998. 24 With the introduction of these scanners, it became possible to capture the volumetric data necessary for multiplanar reformations and 3D reconstructions. 24 Since that time, the tools necessary for postprocessing have become commonplace. 22,23,25 –27 However, the burden of performing postprocessing, extracting the data, and interpreting it still rests with the technologist and radiologist. 25 This is arguably the greatest barrier to adoption. However, as urologists, we are also at fault. Traditionally, we have not requested that urinary stone parameters be calculated as part of a stone protocol CT report. The first step to correcting this deficiency is to ask our radiology colleagues to make this a priority.
However, even if urinary stone parameters do become routinely reported as part of a stone protocol CT, there will still be a role for a POC calculation by the urologist. In fact, POC calculations are likely to be the norm, rather than exception. This is because many patients suffering from renal stone disease arrive to the urologist's office with a CT image in hand performed elsewhere, often during an acute visit in the emergency department. Furthermore, as surgeons we still like the ability to review our own films with the purpose of planning a safe and effective operative approach.
Therefore, to meet this need, we have developed a stand-alone freely available CT postprocessing program specifically designed with the urologist as the end user. The program features an easy-to-use point-and-click interface organized in a stepwise manner to facilitate postprocessing and automated calculations. There is an option for data exportation for research purposes or trending practice habits and outcomes such as stone-free rate. However, the strength of the program is rooted in its ability to automatically calculate all clinically relevant urinary stone parameters, such as volume, diameter in each plane, maximal diameter, sum diameter, average and peak density, and SSD. It will even calculate these parameters for branched irregularly shaped stones (Fig. 3).
There are several limitations in our study. First, we did not correlate the automated calculations against a known benchmark such as a phantom model to confirm their accuracy or reproducibility. However, others have consistently demonstrated the accuracy and precision of attenuation threshold segmentation algorithms to measure stone parameters, particularly axial dimensions and volume. 15,17 Second, we did not examine how each individual parameter may influence clinical outcomes. However, none of the included parameters are novel but instead were explicitly selected because of their well-documented influence on clinical outcomes in urinary stone disease. 7,8 Third, we have not tested this program on other CT manufacturers, across differing CT protocols, or outside our institution, and thus, it may not be as easy to use or integrate or applicable to other practice environments. However, we are making this software freely available, and it is our hope that others will confirm its utility and ease of use.
Conclusions
In this study, we achieved our goal of developing a stand-alone platform with a simple easy-to-use interface, which would allow any user the ability to calculate a battery of clinically important urinary stone parameters from CT imaging at the POC. Unique to this study is that we have made this program freely available via direct download for use in clinical care or within the research community. We hope that this program will become another tool in the armamentarium of the urologist to maximize clinical outcomes in patients with urinary stone disease.
Footnotes
Acknowledgments
The software program described in this article was written primarily by the author Pan Li. We thank Mr. and Mrs. Jerry and Helen Stephens for their continued support of kidney stone disease research at the Brady Urological Institute. This study was approved by the Johns Hopkins Institutional Review Board with informed consent waived.
Disclaimer
The software program described in this article is available online (
Author Disclosure Statement
J.B.Z. is a consultant for Visible Health, Inc., but this research was not related. P.L., W.W.L., R.G., S.K., D.S., and E.F. declare that they have no competing financial interests. G.F. is an employee of the Siemens Medical Solutions USA, but this research was not sponsored by or related to his employment. B.R.M. is a consultant for the Boston Scientific Corporation, but this research was not related.