
Abstract
Objective:
Trends in the utilization of ablative therapy are unknown for the treatment of small renal masses. Our goal is to utilize the National Cancer Database (NCDB) to both assess the utilization of ablative therapies and long-term survival.
Materials and Methods:
The NCDB captures 70% of all cancer cases in the United States and was queried between 1998 and 2012 for renal cell carcinomas that were treated with ablative therapy, partial nephrectomy (PN), or radical nephrectomy. The analysis was limited to clinical stage T1a. Propensity score matching was used in 1:1 fashion. Kaplan–Meier survival analysis and a Cox proportional hazards model were used to compare overall survival (OS) for cryotherapy and PN.
Results:
A total of 119,240 cases of clinical stage T1a renal masses were treated between 1998 and 2012. Cryotherapy peaked at 927 (9.1%) cases in 2010 and had 913 (8.4%) in 2012. PN accounted for 18% of the cases in 1998, but surpassed the utilization of nephrectomy in 2008. By 2012, PN accounted for 6766 (62%) of renal mass cases. After matching, Kaplan–Meier OS was lower for cryotherapy compared with PN at 24 (94.5% vs 96.5%), 48 (86.8% vs 90.9%), and 96 months (66.0% vs 74.9%). Cryotherapy also had a lower OS (hazard ratio 1.46; p < 0.001) on adjusted analysis.
Conclusion:
Cryotherapy for small renal masses plateaued at 9% utilization in 2009. Cryotherapy had a lower OS than PN for tumors >2 cm on adjusted analysis, but this result should be used with caution until confirmed in randomized studies.
Introduction
Small renal mass discovery and renal cell carcinoma have been rising in recent decades due to many factors such as increased prevalence of imaging, improved quality of imaging, as well as a 2% to 3% increase in renal cell carcinoma each year. 1,2 Up to 70% of these solid or complex cystic masses are malignant when they are <2 cm in size, with increased chance of aggression and malignancy with increasing size. 3 Currently, no radiographic evidence can accurately predict whether these masses are malignant. 4 Surgery is the usual clinical course of treatment. Radical nephrectomy (RN) has been the historic treatment of choice, but now is used as a last resort for better long-term survival and to avoid chronic kidney disease (CKD). 5 –9 Active surveillance (AS) is an increasingly popular option, especially when a renal mass biopsy finds a benign tumor or low-risk cancer. 10,11 Partial nephrectomy (PN) has emerged as the most widely used extirpative treatment that allows for the preservation of renal tissue as well as complete excision of tumor with similar oncologic outcomes to RN. Patients who elect not to undergo PN due to comorbidities or desire to avoid potential complications are frequently offered ablation, such as cryotherapy ablation (CA). 12
Current research in CA is sparse, lacking in large-scale studies, randomized studies, or prospective studies. Research is often conflicting on CA's efficacy (oncologic outcomes and survival). Some limitations of currently published studies include poorly matched control groups, small sample sizes, and single-center representation. Some studies show CA resulting in fewer total and major perioperative complications, but with higher rates of tumor recurrence; studies show varying results in the rates of local invasion, distant metastasis, and new CKD. 5,13,14 From 1998 to 2008, CA clinical utilization was on the rise but still grossly overshadowed by PN. 13 Cryoablation is currently viewed as an alternative for treating small renal masses and especially in those with advanced age or comorbidities. 13,15 –19 Our objective was to investigate the trends in the utilization of ablation and to compare the long-term overall survival (OS) between CA and PN in a national database containing comorbidity and cancer staging data.
Materials and Methods
The National Cancer Database (NCDB) captures 70% of all cancer cases in the United States and was queried between 1998 and 2012 for renal cell carcinomas that were treated with ablative therapy (radiofrequency or cryogenic), PN, or RN. The analysis was limited to clinical stage T1a, and cN(+) and cM(+) were excluded. The data were used to establish utilization trends, and a graph was constructed to show the trend over 1998 to 2012.
Propensity score matching was performed in a 1:1 nearest neighbor fashion using tumor diameter, Charlson score, race, age, geographic region, facility type, insurance type, and income to generate the conditional treatment probability. These variables were selected due to differences seen between cryotherapy and PN (p < 0.05). A Kaplan–Meier survival analysis was used to compare OS between CA and PN as well as other significant predictors on multivariable analysis. Cancer-specific survival is not available in this database. A Cox proportional hazards model was used on the matched data to adjust for potential confounders. Variables adjusted for were year of surgery, tumor diameter, Charlson score, race, age, geographic region, facility type, insurance type, and income. A Kaplan–Meier and Cox model were performed in a sub-analysis limited to Charlson comorbidity score = 0, age ≤59 years, and academic or comprehensive cancer center to minimize the effect of potential selection bias. A priori significance was set at p < 0.05 for all analyses. All statistical analyses were performed using Stata 13.1 (Stata Corp. LP, College Station, TX).
Results
The NCDB contained a total of 119,240 cases of clinical stage T1a renal masses that were treated by ablation, PN, or RN between 1998 and 2012 (Fig. 1). Overall, thermal ablation accounted for 2173 (1.8%) cases, CA 6701 (5.6%), PN 51,135 (43%), and RN 59,231 (50%). CA peaked at 927 (9.1%) cases in 2010 and had 913 (8.4%) in 2012. PN accounted for 18% of the cases in 1998, but surpassed nephrectomy in utilization in 2008 and by 2012 accounted for 6766 (62%) cases. Table 1 shows the demographics for PN and CA before and after propensity score matching. Those undergoing CA compared with PN were older, more likely to have a higher Charlson score (p < 0.001), less likely to be treated at an academic center (p < 0.001), less likely to be treated in the Northeast (p < 0.001), less likely to have private insurance (p < 0.001), less likely to be in the top income category (p < 0.001), and more likely to have unknown tumor grade (p < 0.001).
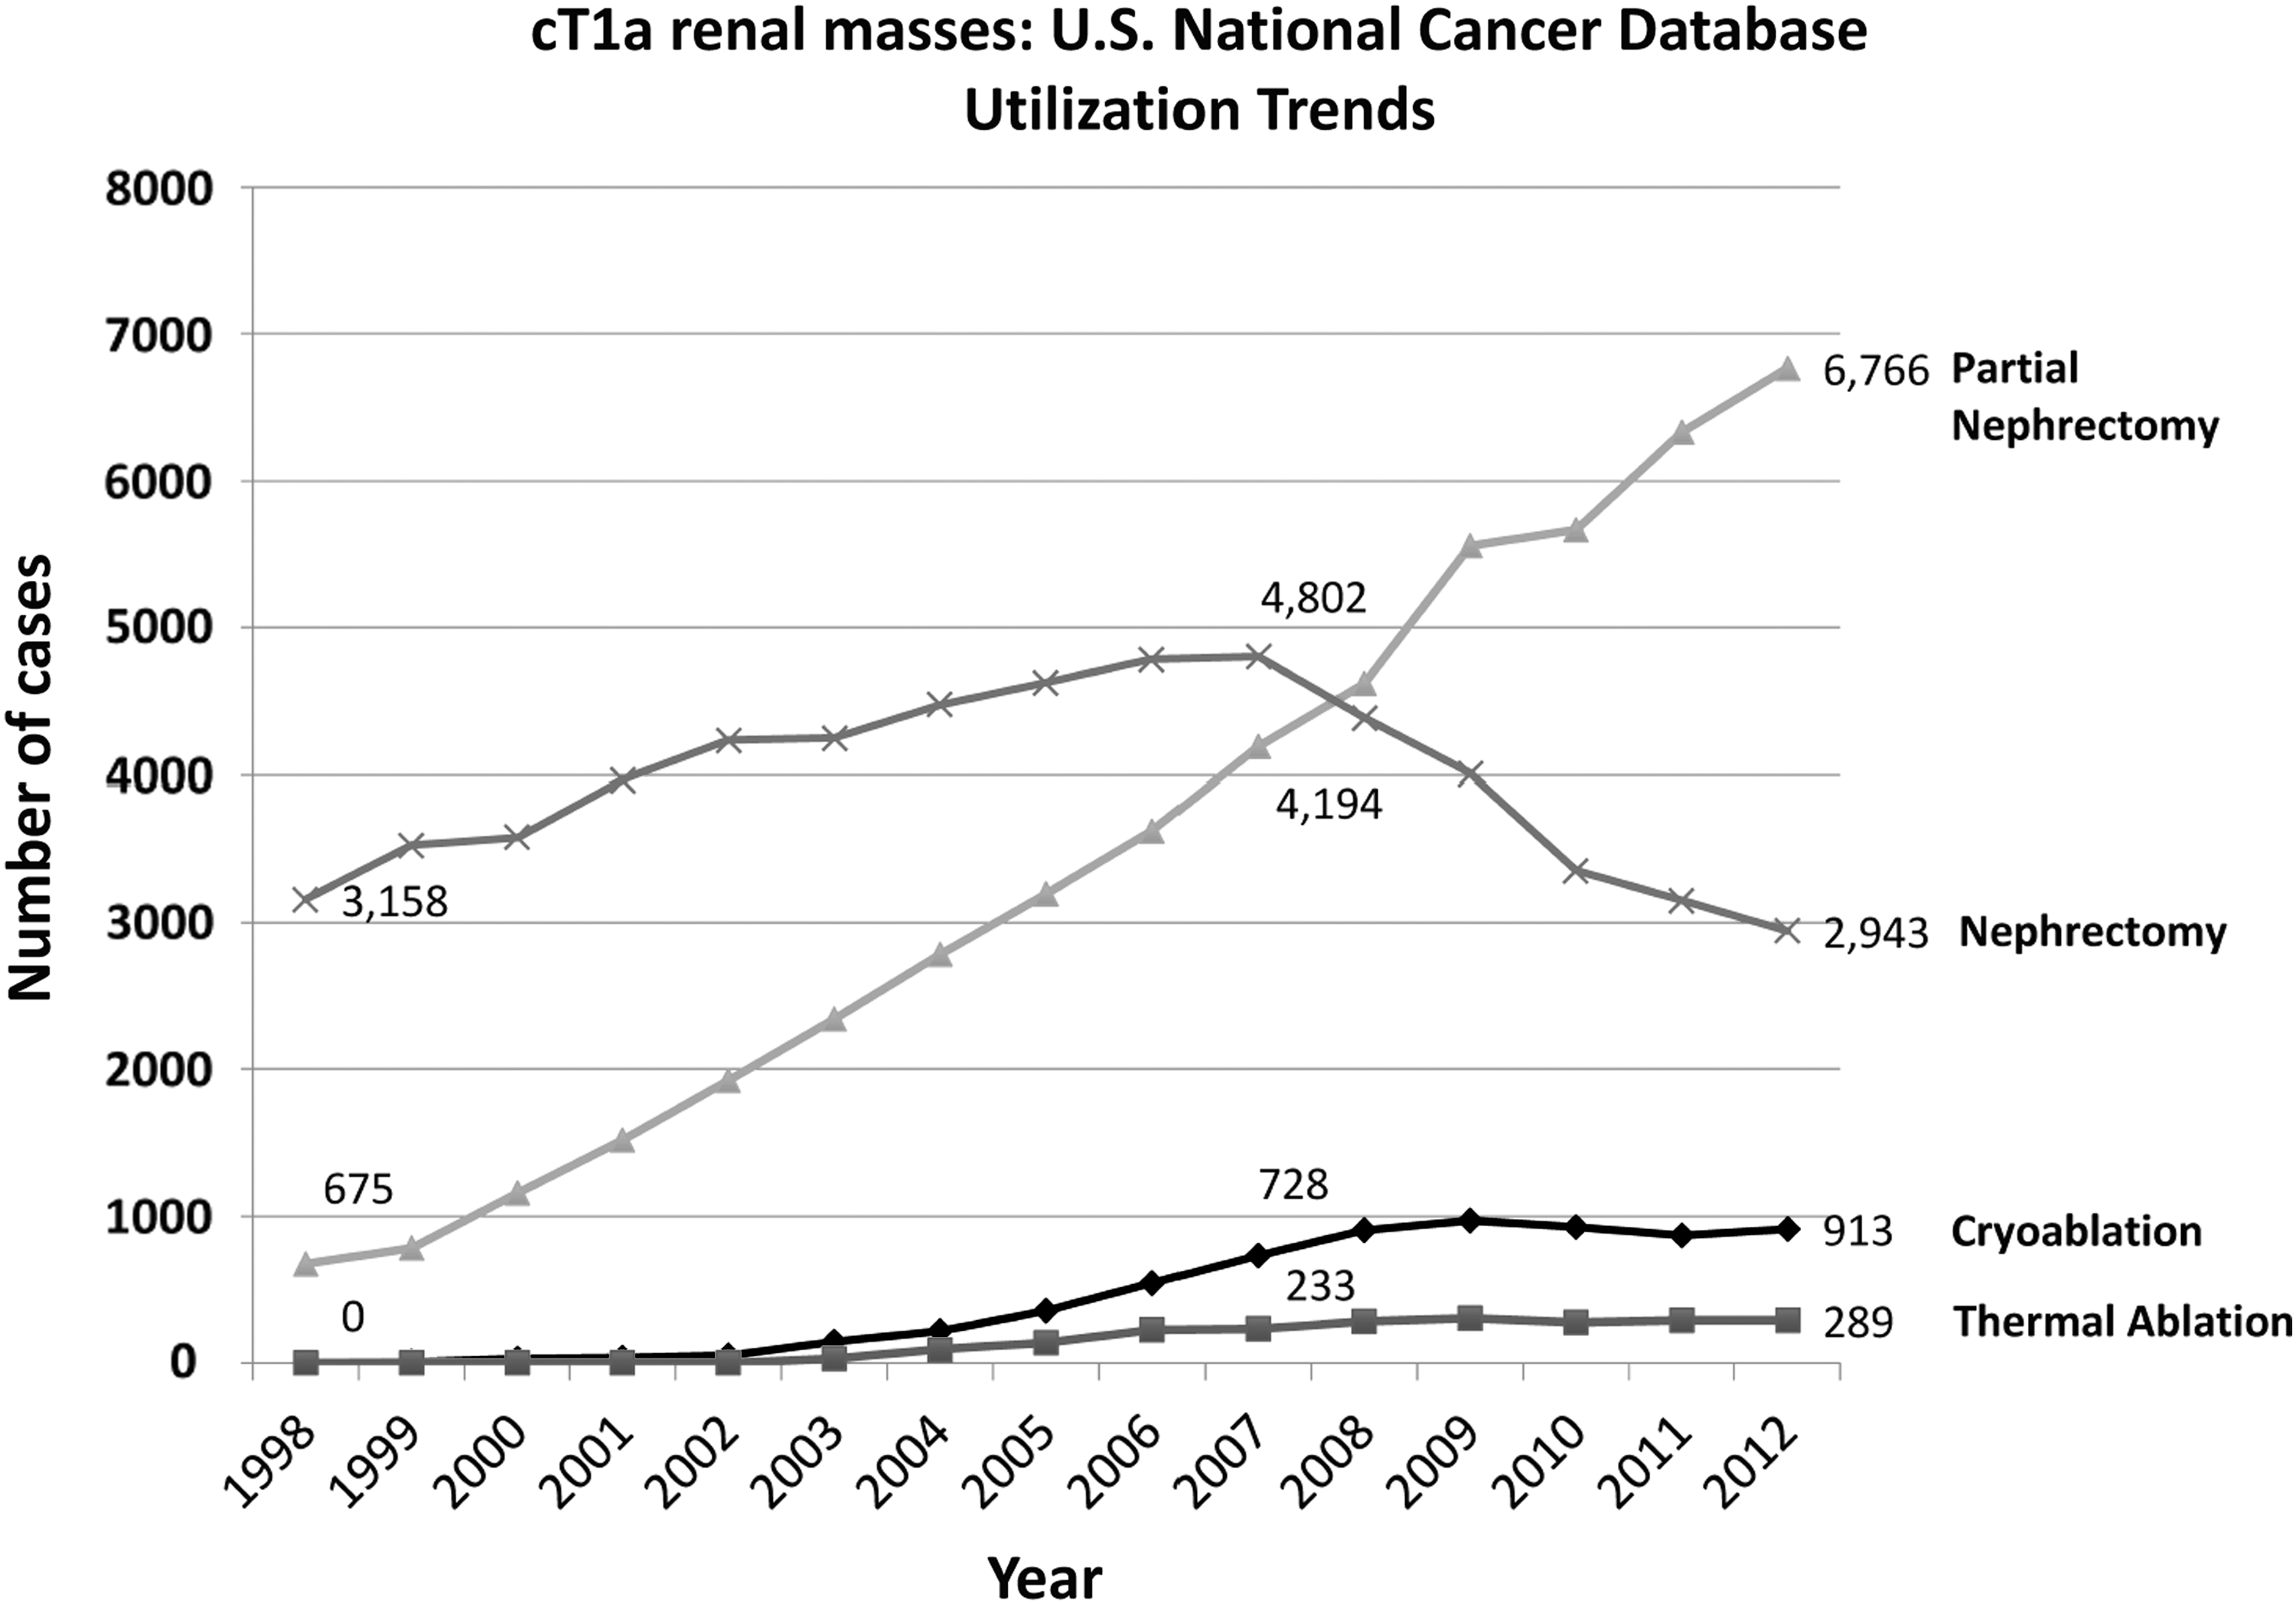
Treatment trends from 1998 to 2013, demonstrating an increased utilization of partial nephrectomy.
Demographics for T1
Bold emphasizes values that reached statistical significance.
Where clinical stage is unknown or N.O.S., the diameter was confirmed to be ≤4 cm with node and status of metastasis = 0.
IQR = interquartile range; SD = standard deviation; N.O.S. = not otherwise specified.
After patient matching (Table 1), a total of 12,458 cases of stage T1a renal masses were treated; CA accounted for 6229 (50%), and PN accounted for 6229 (50%). The two groups were matched for gender, age, Charlson comorbidity score, facility type, tumor diameter, and staging criteria. Race, region of treatment, insurance, and income showed small absolute differences (<5%) that were statistically significant.
Kaplan–Meier OS was lower for CA compared with PN at 24 (94.5% vs 96.5%), 48 (86.8% vs 90.9%), and 96 months (66.0% vs 74.9%) (Fig. 2). CA continued to have a lower OS (hazard ratio [HR] = 1.46; p < 0.001) than PN after adjusting for age, gender, insurance, facility type, region, income, year, tumor diameter, and tumor grade in the Cox proportional hazards model for OS. Other significant predictors were age (HR 1.62), female gender (HR 0.85), tumor diameter (HR 1.02), Charlson score, facility type, region, and income. Race and insurance type were not predictors. Figure 3 is Kaplan–Meier curves for PN vs CA after the patient population was limited to age <60 years, Charlson score = 0, and facility being academic or comprehensive cancer center. Survival was still lower for CA compared with PN (HR 2.7; p < 0.001).
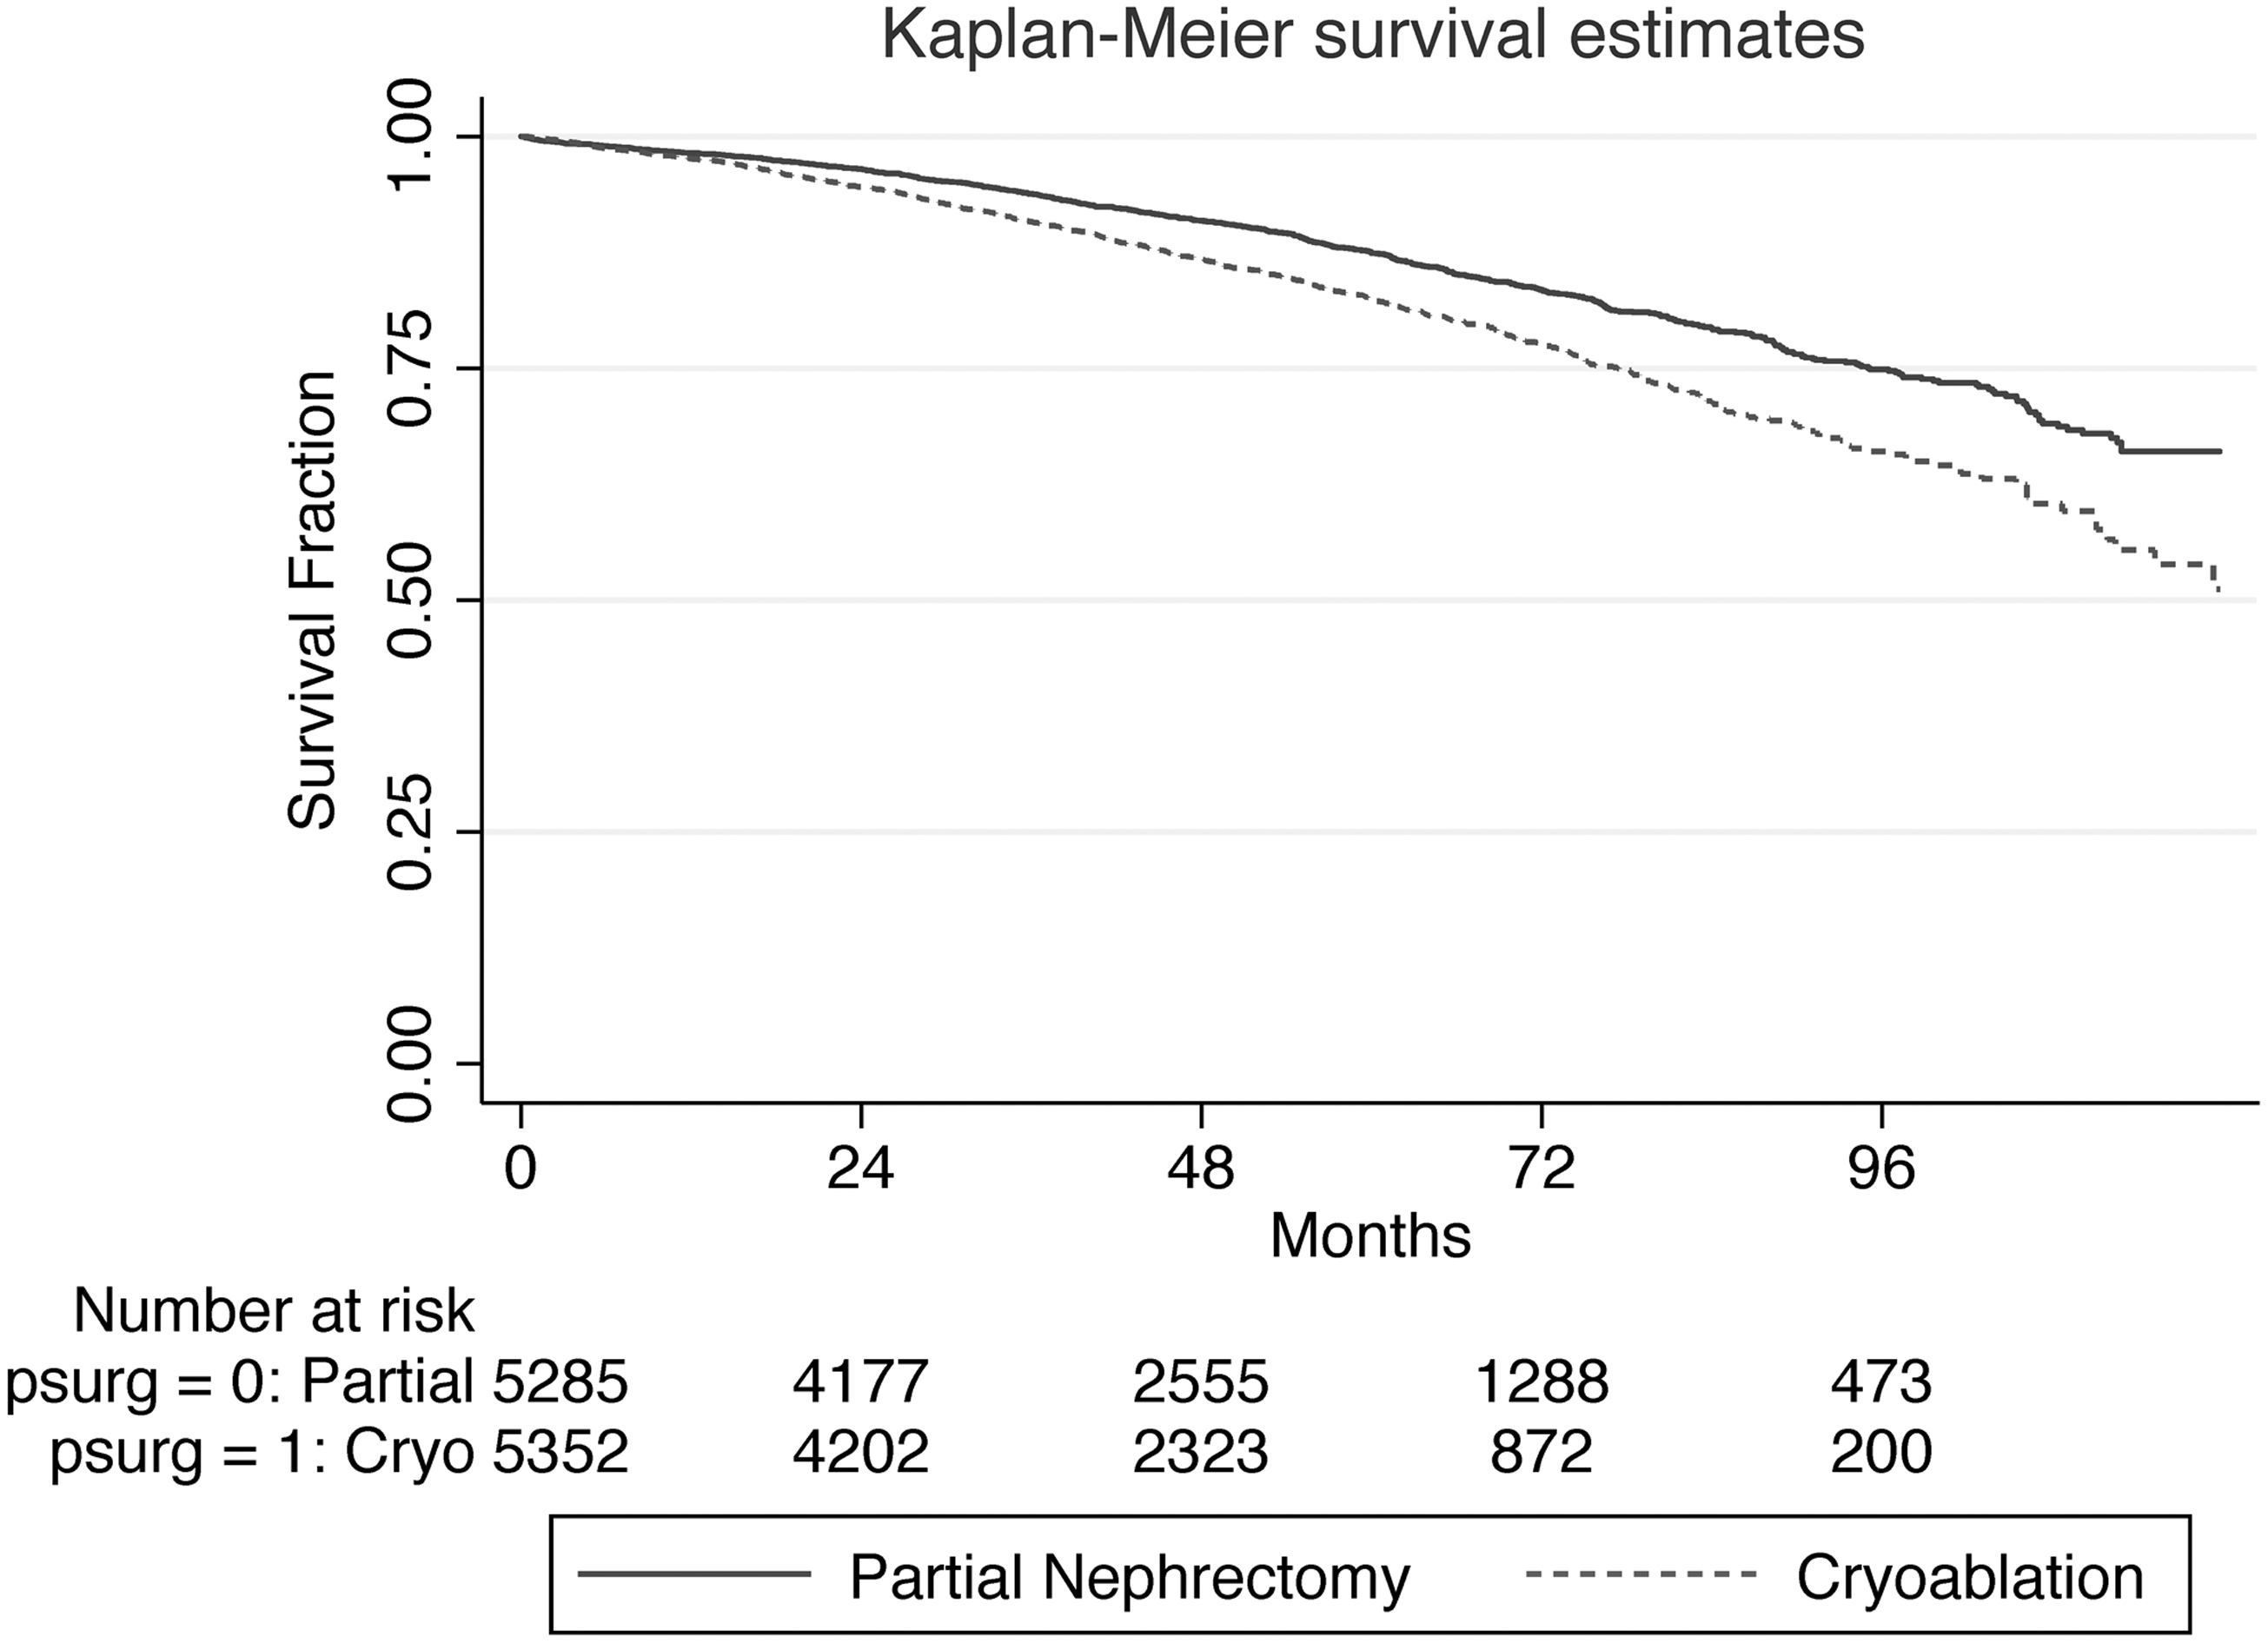
Overall survival for partial nephrectomy compared with cryotherapy, demonstrating a lower survival rate for cryoablation.
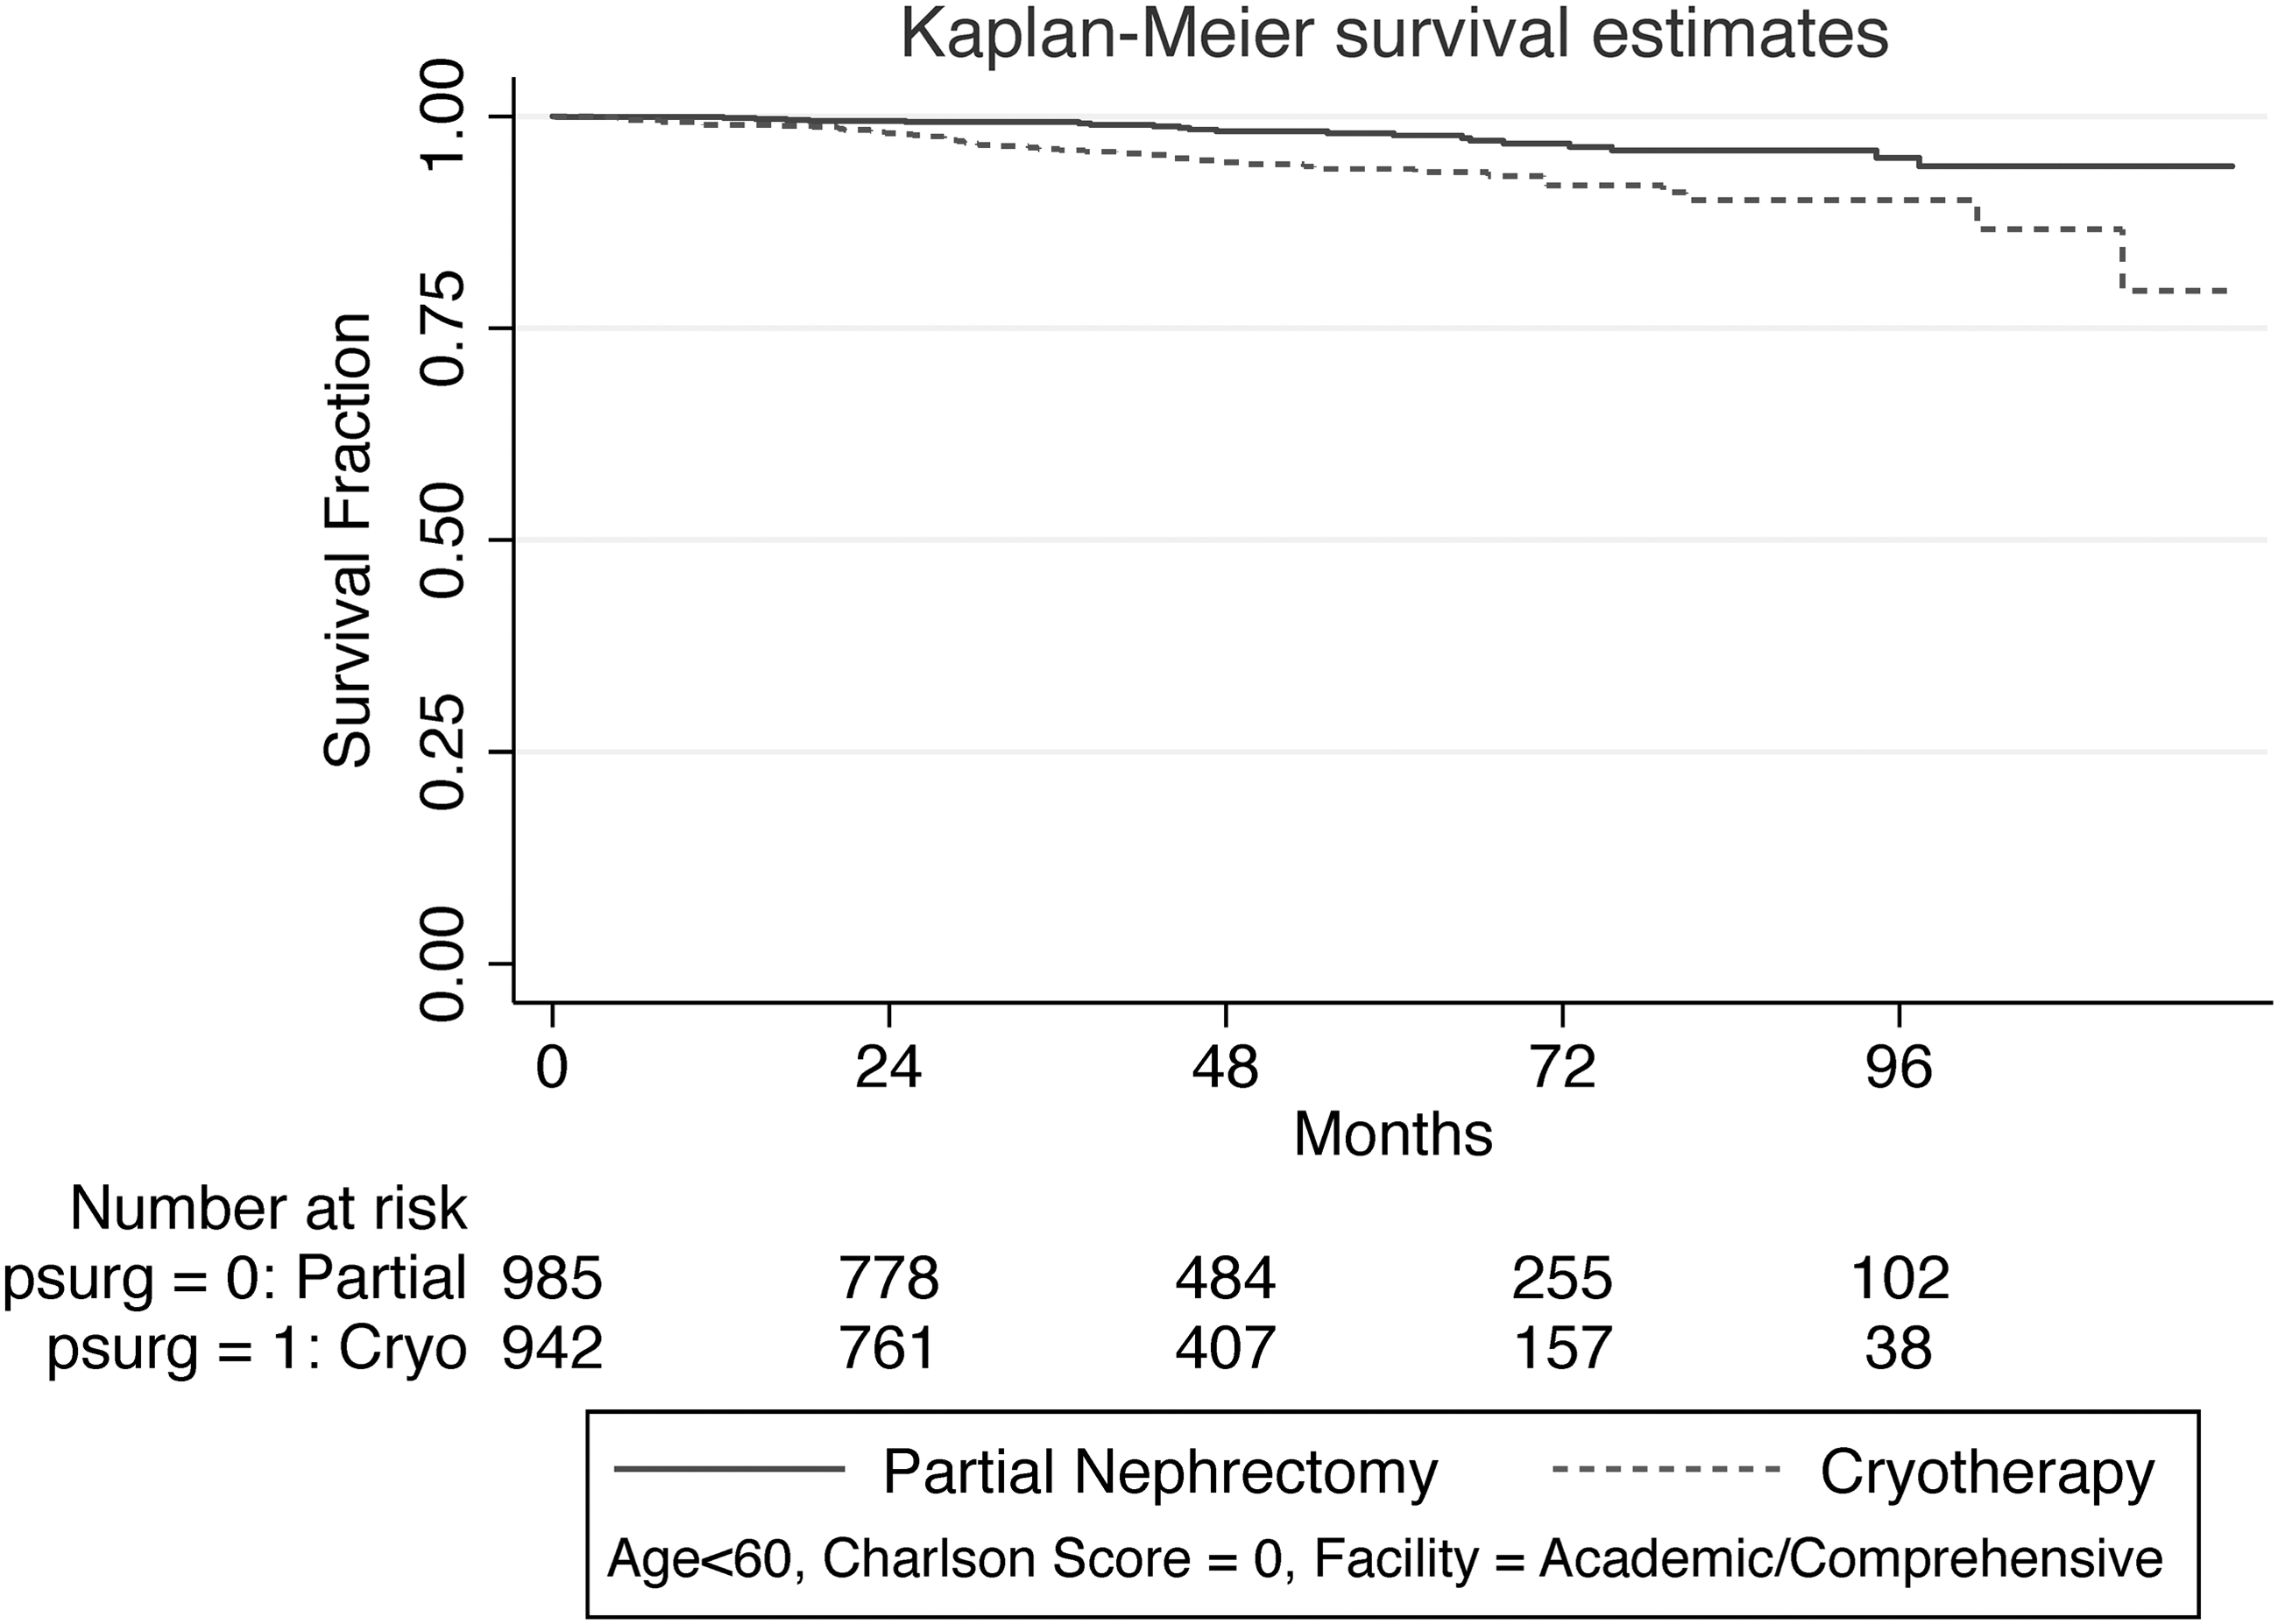
Adjusted survival for partial nephrectomy compared with cryotherapy, demonstrating similar rates of survival for both treatments.
OS increased with grade 1 (p = 0.003) and 2 (p ≤ 0.0001) tumors when offered PN over CA. For grade 1 tumors, at 60 months, OS was 89% for PN, whereas 83% survived after CA. In regard to grade 2 tumors, at 60 months, OS was 87.5% for PN vs 82.4% for CA. There was insufficient data to comment on grade 3 or 4 tumors. Kaplan–Meier curves for tumor size <2, 2 to 3, and 3 to 4 cm are shown in Figure 4. We found that OS was not changed between PN and CA for the <2 cm group (p = 0.11), but did see significant increase in OS in the 2 to 3 cm (p < 0.0001) and 3 to 4 cm (<0.0001) groups. The OS at 60 months for PN for the <2, 2 to 3, and 3 to 4 cm was 91.2%, 87.9%, and 83.5%, respectively, compared with CA at 89.1%, 83.6%, 75.7% for the same respective groups.

Overall survival of patients based on tumor size, categorized by tumors
Discussion
We evaluated the overall trends in the treatment of small renal masses and performed a propensity score matched analysis of OS for PN and cryoablation. We found that PN incidence has been steadily increasing to become the most common form of treatment at 62% of chosen regimens in 2012. RN, by contrast, has been declining in the past decade in utilization, falling to 27%. Ablative therapies rose in incidence in the early 2000s but since 2008 have plateaued around 8.4% for CA and 2.6% for thermal ablation. Survival rates for those treated with CA, instead of PN, were lower with post-operative follow-up and had a statistically significantly higher HR of 1.46 compared with PN (Table 2). This was noted before and after patient matching and when limiting the data to the most healthy patients.
Multivariable Analysis for Matched Cohort: Cox Proportional Hazards Model for Overall Survival
Not enough observations (n = 11).
HR = hazard ratio; CI = confidence interval.
We further restricted the study population to those younger than 60, Charlson score of 0, and operated at an academic facility and found that in this selected group CA survival was still lower (HR 2.7; p < 0.001). We found that age, diameter, and Charlson score all predicted survival. Female gender seemed to offer a small protective factor for survival. Finally, facility types such as comprehensive or academic facilities resulted in higher survival rates.
From the NCDB, we found that PN is the most common procedure performed in the management of small renal masses, and that CA utilization rose from 1998 to 2008. 13 We discovered that CA has plateaued in utilization since 2008. According to Woldrich et al., the prevalence for cryoablation/radiofrequency ablation (RFA), PN, and RN was 3.7, 9, and 87.1, respectively, per 100,000 in 1998. 20 From 1998 to 2008 all methodologies of treatment increased in sheer number due to higher case volumes, but PN increased with the highest velocity of 3.1/100,000 admissions per year, rising from ∼10% in 1998 to ∼25% in 2008. Ablation therapies and RN also rose during this period at a velocity of 1.05 and 2.2, respectively. During this same period, ablation therapies rose from ∼4% in 1998 to ∼9% in 2008, and RN dropped from ∼85% in 1998 to only 67% in 2008. 20 Our study agrees with Woldrich et al. in that PN has been rising rapidly in terms of utilization over the years of 1998 (∼675 cases in NCDB; 18%) to 2008 (∼4500 in NCDB) and continued to rise to n = 6766 (62%) by 2012. We also found, in terms of ablation therapy and RN, that utilization increased in a similar manner over 1998 to 2008. RN increased in the number of cases over 1998 to 2008, but at a slower rate of increase in comparison to PN. Since 2008, we found that PN has continued to increase at a similar rate, while ablative therapies have plateaued and RN has actually decreased in utilization from 2008 to 2012. Cryoablation utilization peaked in 2010 with 927 cases or roughly 9.1% of the total procedures in that year. By the end of the study range in 2012, CA utilization had slightly decreased to 8.4%, n = 913.
Kiechle et al. reported a similar trend among ablative therapies over the period of 2004 to 2011, rising from 2.2% to 6.2%, respectively. 21 It seems that over the past 15 years PN has become the most utilized treatment option for the average patient with a small renal mass, with RN declining in utilization but still being a close second choice to PN. Ablative therapies have also increased in utilization since 2000, but not to the extent as PN.
No randomized control trials or prospective studies were found comparing CA with PN, and the studies that do exist have relatively small sample sizes with varying length of follow-up. We identified two major studies, Tanagho et al. and Thompson et al., that compared PN with CA in terms of OS; 77.1% CA vs 91.7% PN and 88% CA vs 95% PN, respectively. 15,18 Thompson et al. reported the longest follow-up with a median of 5 years with no propensity score match for their 1424 patients. 15,24 OS at 3 years was 95%, 82%, and 88% for PN, RFA, and CA, respectively. PN patients were found beyond statistical significance to survive longer than those undergoing CA (p < 0.001) or RFA (p < 0.001). They adjusted their data for Charlson score and age and also found OS difference while comparing PN with CA (HR 1.72; p = 0.019). 15 Our study similarly shows worse survival outcomes for CA. After matching, Kaplan–Meier analysis showed a PN survival rate of 75% and CA survival rate of 50% at 10 years post-treatment. Our 3-year survival rate for PN was 93.8%, while CA survival rate was 90.8% at 3 years. Hazard ratio for CA in reference to PN was 1.46 (p < 0.001) (Table 2), which is comparable to Thompson et al.'s HR of 1.72. Our Kaplan–Meier OS was lower for CA compared with PN (Fig. 2).
Further sub-analysis revealed that, despite tumor grade, PN had better OS compared with CA, but we were unable to analyze grades 3 to 4 due to insufficient numbers for adequate analysis. When examining tumor size, we found similar results to those seen in Moskowitz et al. in which no difference in OS was shown between CA and PN for tumors <2 cm, but once tumors grew >2 cm, PN showed increases in OS (Fig. 4). 25 The reason for this discrepancy in OS with CA and PN is unclear with 2 to 4 cm tumors; whether advances in imaging will allow better “ice ball” assessment in real time causing more accurate and precise CA therapy leading to increases in OS remains to be understood. Difficulty certainly exists when targeting these tumors off imaging due to the inability to assess how far your kill zone had progressed and if your placement of the probe is reliable.
Tanagho et al. also examined PN vs CA therapies in terms of survival. Their data showed that OS rates at 5 years was 91.7% to 77.1%, PN vs CA, respectively (HR 11.4; p = 0.01). 18 Our 5-year survival rate was 87.4% for PN and 82.3% for CA. Despite finding lower survival rates in CA compared with PN, it could be attributed to a selection bias in favor of PN having fewer comorbidities. 15,18 For this reason, we attempted to stratify our analysis by limiting our population to patients <60 years, Charlson score of 0, and operated on at a comprehensive/academic facility. This analysis showed higher overall rates of survival at 5 years compared with the non-restricted data, due to a “healthier” population base. Once the restraints were instituted, CA was still associated with lower survival after ∼2 years (Fig. 3). This population at 5 years had rates of survival of 97.7% and 93.8% for PN and CA, respectively. Although we used Charlson score to standardize the “level of illness/comorbidity,” it is unlikely to fully account for patient health, and a future area of interest would be to explore disease-free survival with PN and CA.
The above findings may challenge current recommendations that state that CA is comparable to PN in terms of oncologic outcomes. 11,13,15,18,22 – 24 However, before patient matching, our data were highly comminuted due to a large selection bias from various recognized and unknown sources. Other limitations of the database were that it was unable to provide sufficient information of patient biopsy/pathology, information on patients who were followed with AS, or disease-specific survival. For patients with many complicating comorbidities, who are elderly, and who cannot undergo major surgery, the physicians utilize CA more frequently. 15 In this population with lower life expectancies, it may be a reasonable alternative with few procedure-associated risks. The current recommendation is that although CA does not have sufficient data, it is seen as an acceptable alternative to PN in patients with comorbidities, increasing age, who do not desire AS, and who are poor surgical candidates. 16,17,23,25
Our study has limitations, such as being a retrospective study, and thus the conclusions on OS should be used cautiously. We were not able to look at oncologic outcomes, as the database does not record the cause of death. The database also had no data on operative complications and thus we were unable to comment. The data do not allow us to examine morbidity created by therapies. The NCDB captures roughly 70% of the oncologic cases in the United States, but unknown and known selection bias may be present in the database. We attempted to remove selection bias by using a database large enough to allow for matching within the patient population, but possible bias still exists. The NCDB also has patients who were lost to follow-up, which could also yield further patient bias since the status of those patients (alive vs decreased) is unknown. Using large databases can result in statistical significance where there is not clinical significance.
Conclusion
Cryoablation for small renal masses increased in usage, until it plateaued at 9% in 2009, while PN increased every year of the study and accounted for 62% of the cases in 2012. Cryoablation was correlated with a similar but slightly lower OS rate than PN on matched, adjusted analysis and tumors >2 cm. The data and results from this study should be used with caution until confirmed by randomized studies.
Footnotes
Author Disclosure Statement
No competing financial interests exist.