
Abstract
Background:
The role of robot assistance is increasingly gaining importance among all major surgical uro-oncological procedures (MSUPs). However, contemporary analyses showed that total hospital charges (THCGs) related to robot-assisted procedures exceed those of open procedures. Based on increasing familiarity with robot-assisted surgery, we postulated that THCGs may have decreased over the past half-decade. Thus, we tested contemporary trends and THCGs related to robot-assisted vs nonrobot-assisted MSUPs.
Materials and Methods:
Within the National Inpatient Sample database (2009–2015), we identified patients who underwent robot-assisted vs nonrobot-assisted (open or laparoscopic) MSUPs, which included radical prostatectomy (RP), radical nephrectomy (RN), partial nephrectomy (PN), and radical cystectomy (RC). Rates of robot-assisted MSUPs were evaluated using estimated annual percentage changes (EAPCs) analyses. The t-test was used to examine statistically significant differences between mean THCGs according to either robot-assisted or nonrobot-assisted approach. Finally, linear regression analyses were tested for annual variation in the mean THCGs.
Results:
Of 128,367 MSUPs, 47.7% were robot-assisted. Overall, robot-assisted surgery rates among MSUPs increased from 40.3% to 57.6% (EAPC: +6.3%, p < 0.001) between 2009 and 2015. The mean THCGs for robot-assisted RP, RN, PN, and RC were $13,799, $18,789, $16,574, and $33,575, respectively. The observed mean THCGs differences between robot-assisted and nonrobot-assisted MSUPs were +$1594, +$1592, and +$1829 for RP, RN, and RC, respectively (all p < 0.05). Conversely, no statistically significant difference in the mean THCGs was reported between robot-assisted and nonrobot-assisted PN (+$367, p > 0.05). Finally, the annual observed mean THCGs linearly decreased for all robot-assisted MSUPs during the study period.
Conclusions:
Rates of robot-assisted MSUPs exponentially increased between 2009 and 2015. Although the mean THCGs decreased in a significant manner during the study period for all MSUPs, THCGs of robot-assisted RP, RN, and RC still exceed those of their respective nonrobot-assisted counterparts. Conversely, no differences in the mean THCGs were reported between robot-assisted vs nonrobot-assisted PN.
Introduction
Robot assistance is increasingly used at major surgical uro-oncological procedures (MSUPs), which include radical prostatectomy (RP), radical nephrectomy (RN), partial nephrectomy (PN), and radical cystectomy (RC). 1,2 Particularly, robot-assisted radical prostatectomy (RARP) has become the most frequently used approach for surgical management of localized prostate cancer. 3,4 Such temporal trends also appear to affect other MSUPs. 5 –9 In consequence, the increasing uptake of robot-assisted surgery may result in improvements of perioperative outcomes, based on the practice makes perfect hypothesis. This concept relies on the progressive improvement of surgical outcomes with the experience progression that may also be interpreted as learning curve effect. Indeed, several analyses demonstrated that increasing surgical experience improves outcomes after RARP, robot-assisted PN (RAPN), or robot-assisted RC (RARC), with or without reaching a stable plateau. 10 –12 As a consequence, it is plausible to expect progressive outcomes improvement over time. Moreover, it is noteworthy that several investigators reported lower perioperative complications for robot-assisted MSUPs relative to nonrobot-assisted MSUPs. 2,3,9,13 Since complications add to total hospital charges (THCGs), it could be argued that lower complications at robot-assisted MSUP may exert a protective effect of THCGs. Moreover, the reported shorter length of stay (LOS) after robot-assisted MSUPs should also decrease THCGs. Despite these convincing hypotheses, several North American and European contemporary analyses showed that THCGs related to robot-assisted MSUPs still exceed those of their counterpart open surgeries. 4,9,14 –17
Based on this premise, we tested the contemporary trends of robot-assisted surgery use among MSUPs, within a large-scale population-based data repository, namely the Nationwide Inpatient Sample (NIS). Subsequently, we tested the annual trends and observed differences in mean THCGs between robot-assisted and nonrobot-assisted MSUPs. We hypothesized that the increasing use of robot-assisted surgery may lead to a reduction in THCGs, especially for the most contemporary robot-assisted MSUPs.
Materials and Methods
Data source and patient selection
We relied on the NIS database (2009–2015) to assess trends and THCGs of robot-assisted vs nonrobot-assisted MSUPs. The NIS is a set of longitudinal hospital inpatient databases included in the Healthcare Cost and Utilization Project family, created by the Agency for Healthcare Research and Quality through a Federal-state partnership. 18 The database includes 20% of U.S. inpatient hospitalizations, with discharge abstracts from 8 million hospital stays.
Study population
Within the NIS database, we focused on patients aged ≥18 years with a primary diagnosis of prostate cancer (ICD-9-CM code 185), renal cell carcinoma (ICD-9-CM code 189.0), or urothelial carcinoma of the bladder (ICD-9-CM code 188.0). All procedures and diagnoses were coded using the International Classification of Diseases, Ninth Revision, Clinical Modification (ICD-9-CM). Primary procedure codes were used to identify MSUPs, specifically: prostatectomy (ICD-9-CM code 60.4, 60.5, and 606.2), RN (ICD-9-CM code 555.1 and 555.2), PN (ICD-9-CM code 555.4), and RC (ICD-9-CM code 57.6 and 57.7). 15,19,20 Patients with a secondary diagnosis of metastatic disease were excluded (ICD-9-CM code 197.x and 198.x). Secondary procedure codes were used to identify robotic procedures according to the modifier codes 17.4 and 17.42. 2,21 These selection criteria yielded 128,367 patients.
Patient and hospital characteristics
Patient age, year of surgery, race/ethnicity (Caucasian, African American, Hispanic, and Others), Charlson Comorbidity Index, 22 and insurance status (private insurance, Medicare, Medicaid, and other [self-pay]) were ascertained from the NIS. Additional risk variables consisted of hospital region (Northeast, Midwest, South, West), hospital size (small, medium, and large), and hospital teaching vs nonteaching status. Teaching institutions had an American Medical Association-approved residency program, were a member of the Council of Teaching Hospitals, or had a ratio of 0.25 or higher of full-time equivalent interns and residents to non-nursing home beds. 23 Annual hospital volume (low, medium, and high), representing the number of cases performed at each participating institution during each study calendar year, was calculated. Finally, inflation-adjusted THCGs were defined according to the NIS methodology. 18
Definition of complications
Complication rates were defined using secondary ICD-9 diagnostic codes, as previously described. 21,24 Intraoperative complications consisted of accidental blood vessel and/or nerve and/or organ puncture or laceration during the procedure. Postoperative complications consisted of cardiac, respiratory, vascular, operative wound, infections, bowel obstruction, genitourinary, transfusion, miscellaneous medical, and miscellaneous surgical. LOS, provided by the NIS, is calculated by subtracting the admission date from the discharge date. In-hospital mortality information is coded from the disposition of the patient.
Statistical analysis and covariates
To test contemporary use rates and THCGs trends among MSUPs, four analytical steps were performed. First, medians and interquartile ranges, as well as frequencies and proportions were reported for continuous (age and LOS) and categorical variables, respectively. Second, estimated annual percentage change (EAPC) was defined according to the surgical approach and was depicted graphically for each specific MSUP. Additionally, EAPC analyses were used to test for changes of proportion of hospitals performing robot-assisted procedures over time for each specific MSUP. Third, overall and annual mean inflation rate-adjusted THCGs were reported according to the surgical approach for each specific MSUP. For purpose of complications, LOS and THCGs comparison, the surgical approach was dichotomized as either robot-assisted or nonrobot-assisted (open or laparoscopic). The statistical significance of differences in means was evaluated with the t-test. Finally, linear regression analyses were tested for annual variation in THCGs means, according to the surgical approach (robot-assisted vs nonrobot-assisted), for each specific MSUP.
All statistical tests were two-sided with a level of significance set at p < 0.05. Analyses were performed using the R software (version 3.5.1;
Results
Study populations
Between 2009 and 2015, 128,367 patients underwent one of the four examined MSUPs. Of those, 61,320 (47.7%) underwent robot-assisted procedures. Of 71,580 RP patients, 49,484 (69.1%) underwent RARP. Of 30,587 RN patients, 3682 (12.0%) underwent robot-assisted radical nephrectomy (RARN). Of 15,120 PN patients, 6195 (40.9%) underwent RAPN. Finally, of 11,080 RC patients, 1879 (16.9%) underwent RARC (Table 1).
Baseline Characteristics of 128,367 Patients Undergoing Open vs Laparoscopic vs Robot-Assisted Surgery Among Major Surgical Uro-Oncological Procedures Within the Nationwide Inpatient Sample (2009–2015)
IQR = interquartile range; LPS = laparoscopic.
Robot-assisted MSUPs were associated with lower overall complications rates relative to nonrobot-assisted MSUPs. Specifically, overall complication rates were 9.4%, 37.1%, 25.8%, and 63.2% for, respectively, RARP, RARN, RAPN, and RARC vs 14.1%, 42.7%, 37.8%, and 67.2% for, respectively, non-RARP, non-RARN, non-RAPN, and non-RARC (all p < 0.05) (Supplementary Table S1). Similarly, robot-assisted MSUPs were associated with shorter LOS. Specifically, median LOS were 1, 3, 2, and 7 days for, respectively, RARP, RARN, RAPN, and RARC vs 2, 4, 4, and 8 days for, respectively, non-RARP, non-RARN, non-RAPN, and non-RARC (all p < 0.05) (Supplementary Table S1).
Trend analyses of overall use rates and proportion of hospitals using robot assistance
Overall, robot-assisted surgery use among MSUPs increased from 40.3% to 57.6% (EAPC: +6.3%, confidence interval (CI): +5.2%–7.5%, p < 0.001) between 2009 and 2015. Specifically, RARP use increased from 58.9% to 80.8% (EAPC: +5.6%, CI: +4.3%–7.0%, p < 0.001), RARN use increased from 4.6% to 21.4% (EAPC: 25.3%, CI: +21.0%–30.2%, p < 0.001), RAPN use increased from 21%.4 to 57.9% (EAPC: 16.0%, CI: +12.1%–20.3%, p < 0.001), and RARC use increased from 11.6% to 25.0% (EAPC: +14.5%, CI: +12.6%–16.5%, p < 0.001) between 2009 and 2015 (Fig. 1).
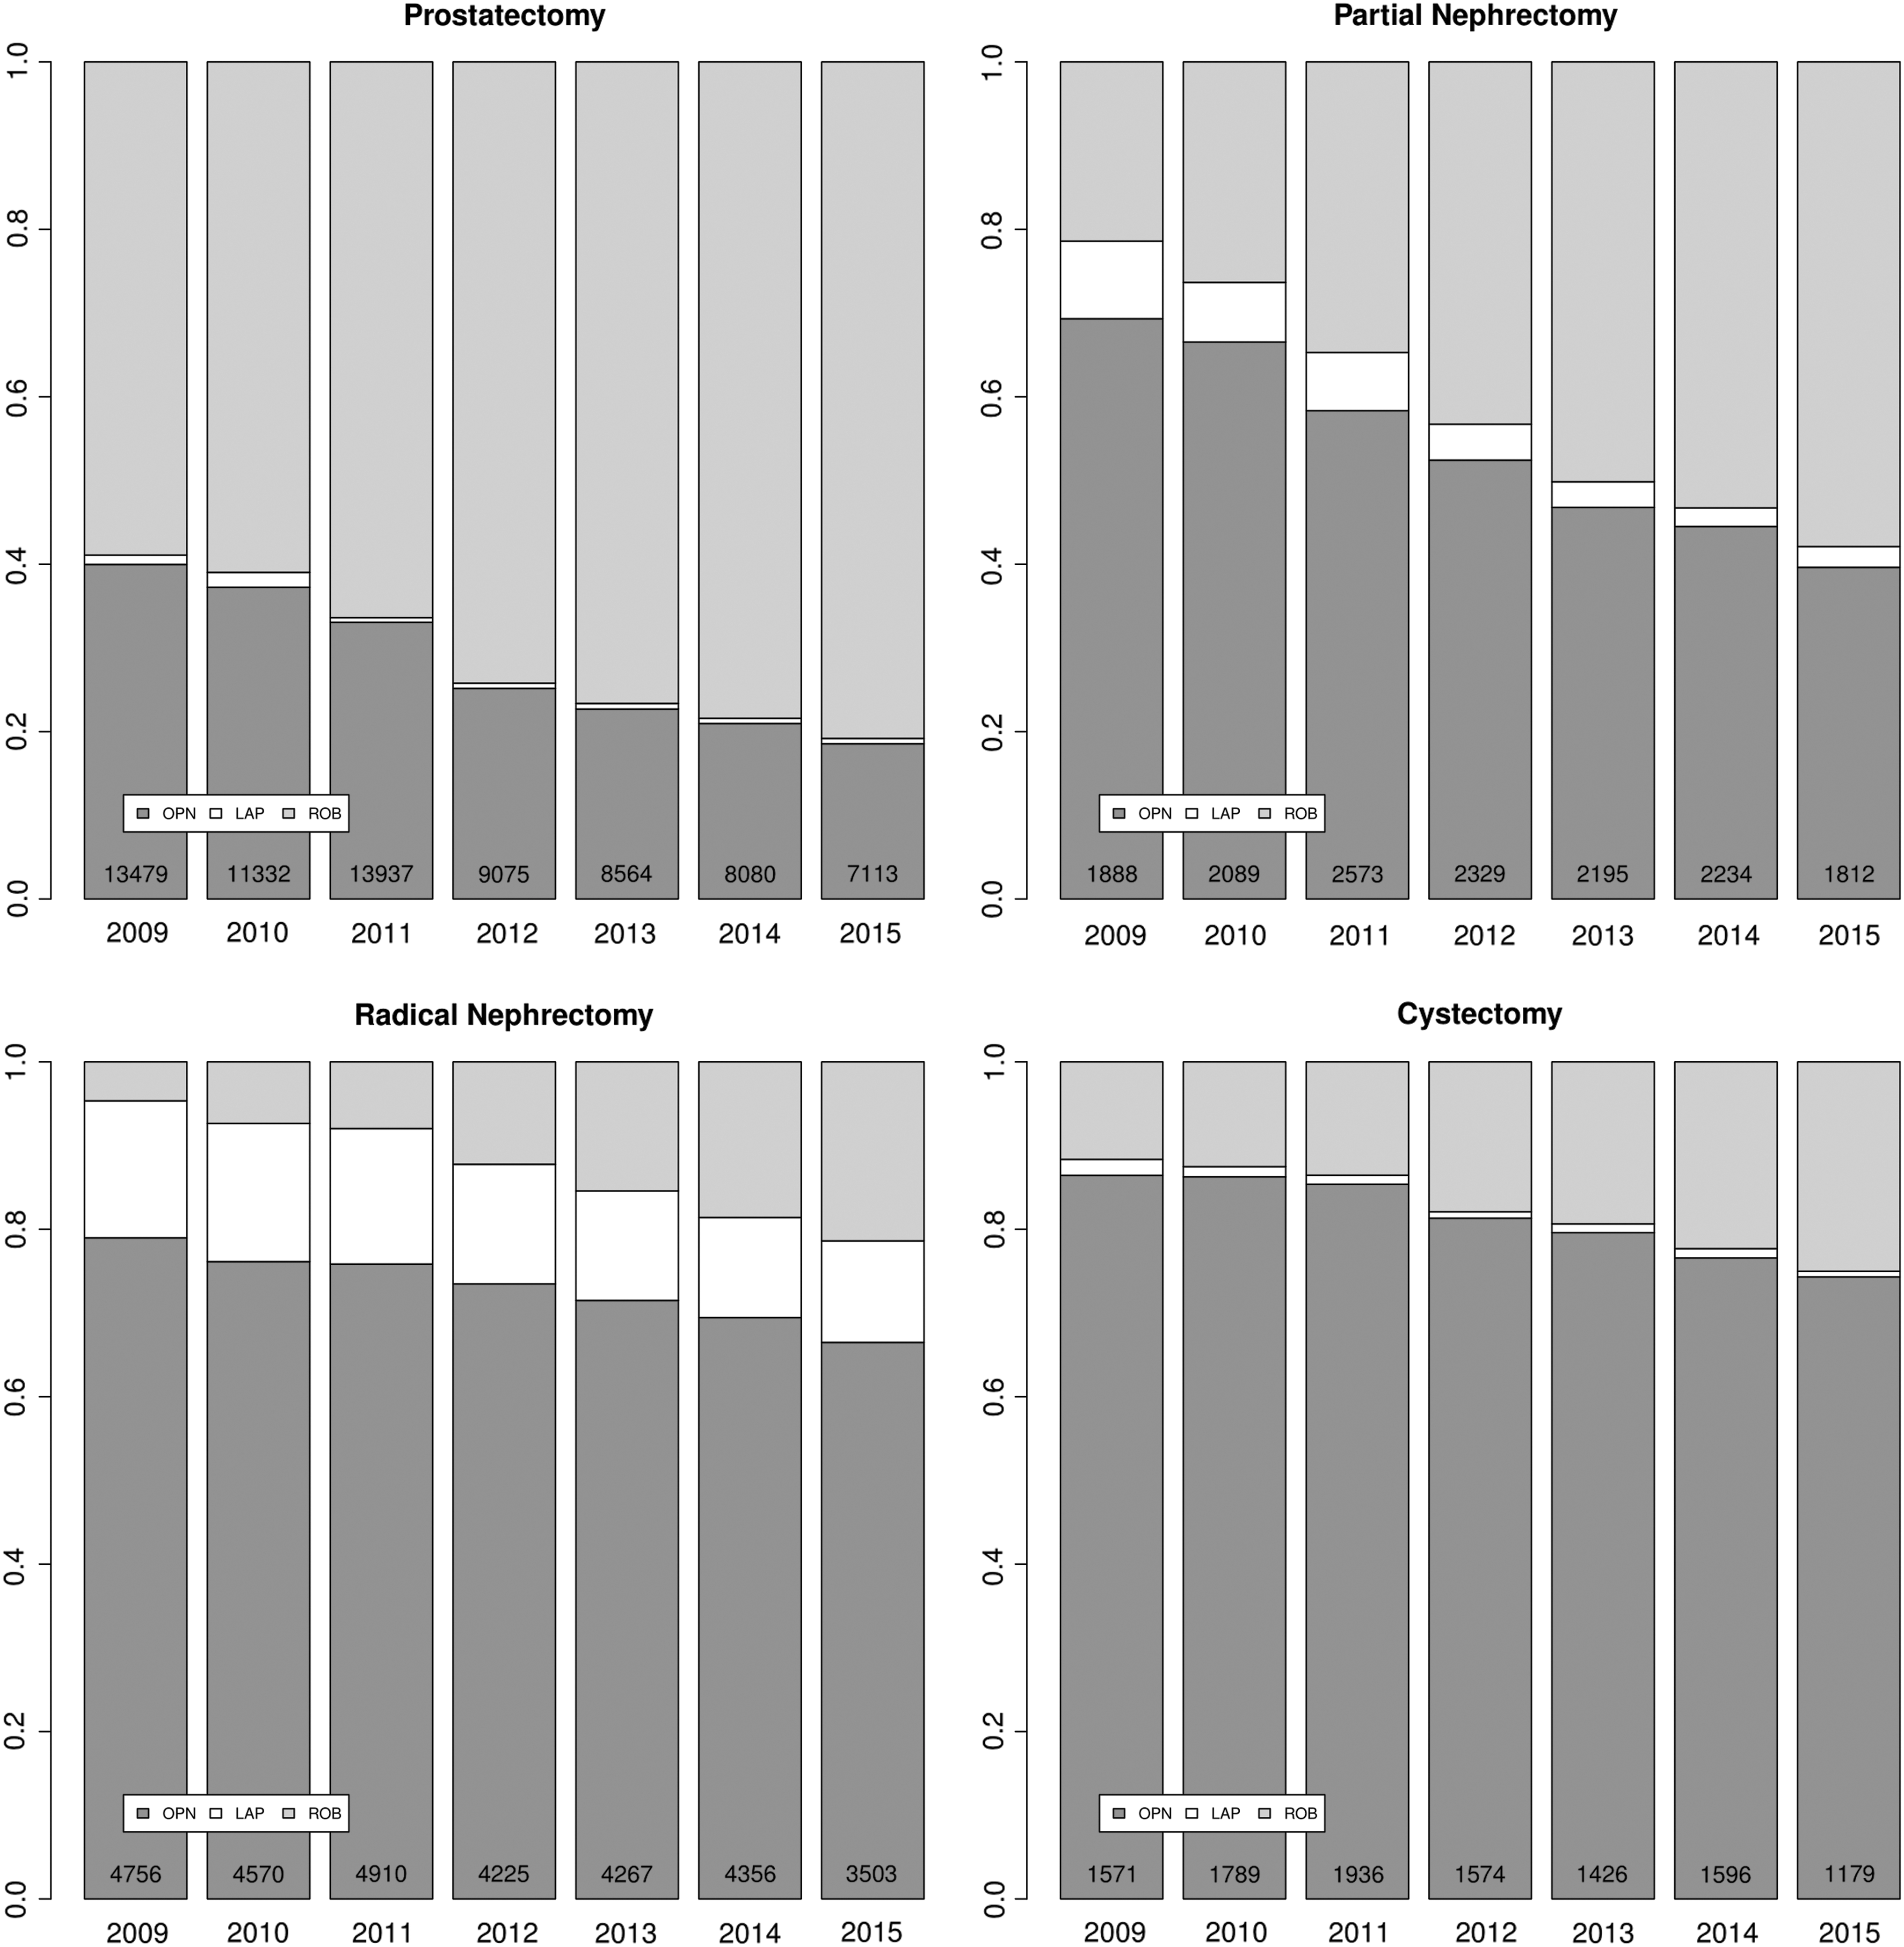
Bar plots depicting the use rates of robot-assisted laparoscopic and open approaches among major surgical uro-oncological procedures between 2009 and 2015.
The proportion of hospitals using robot assistance among MSUPs increased from 21.9% to 41.4% (EAPC: +9.9%, CI: +7.8%–12.0%, p < 0.001) between 2009 and 2015. Specifically, this proportion increased from 25.0% to 60.6% for RARP (EAPC: +14.1%, CI: +10.1%–18.4%, p < 0.001), from 13.5% to 26.0% for RARN (EAPC: 10.3%, CI: +7.9%–12.8%, p < 0.001), from 23.4% to 52.4% for RAPN (EAPC: 12.9%, CI: +9.5%–16.6%, p < 0.001), and from 14.1% to 28.7% for RARC (EAPC: +11.0%, CI: +8.3%–13.7%, p < 0.001) between 2009 and 2015 (Table 2).
Number of Hospitals Performing Major Surgical Uro-Oncological Procedures Over Time, Stratified According to Surgical Approach
Bold type indicates p values < 0.05.
EAPC = estimated annual percentage change.
Observed THCGs
In RP patients, the overall mean THCGs for RARP were $13,799 (standardized difference [SD]: $6777) vs $11,975 (SD: $9115) for non-RARP (p < 0.001). In RN patients, the overall mean THCGs for RARN were $18,789 (SD: $13,253) vs $17,196 (SD: $15,880) for non-RARN (p < 0.001). In PN patients, the overall mean THCGs for RAPN were $16,574 (SD: $10,028) vs $16,207 (SD: $11,821) for non-RAPN (p = 0.05). Finally, in RC patients, the overall mean THCGs for RARC were $33,575 (SD: $21,608) vs $31,575 (SD: $27,690) for non-RARC (p < 0.001) (Table 3).
Mean Total Hospital Charges Among Major Surgical Uro-Oncological Procedures Within the Nationwide Inpatient Sample (2009–2015), Stratifies According to Surgical Approach (Nonrobot-assisted vs Robot-Assisted)
Bold type indicates p values < 0.05.
SD = standardized difference; THCGs = total hospital charges.
The comparison between the observed THCGs means revealed that THCGs were $1824 higher for RARP relative to non-RARP (p < 0.001), $1593 higher for RARN relative to non-RARN (p < 0.001), and $1829 higher for RARC relative to non-RARC (p = 0.008). Conversely, we did not record any statistically significant difference in the observed mean THCGs between RAPN and non-RAPN (p = 0.05) (Table 4).
Overall and Annual Observed Mean Total Hospital Charges for Major Surgical Uro-Oncological Procedures, Reported in U.S. Dollars
Bold type indicates p values < 0.05.
t-test derived p > 0.05.
Statistically significant differences in the annual mean THCGs were tested using the t-test.
Between 2009 and 2015, the annual mean THCGs for RARP showed a decreasing temporal trend in linear regression analyses of −$236 per-year (p = 0.041). Similarly, the annual mean THCGs for RARN, RAPN, and RARC linearly decreased of −$1018 (p < 0.001), −$497 (p < 0.001), and −$1142 (p = 0.008) per-year, respectively (Table 4).
Discussion
Several studies reported increasing use of robot assistance at MSUPs. 1,2,7,9 However, the increasing rates of robot assistance did not translate into a cost reduction at robot-assisted surgeries, as shown in several analyses. 4,5,9,16 Moreover, a direct comparison of costs and use trends over time in robot-assisted MSUPs was never reported. Based on this unmet need, we hypothesized that the increasing use of robot-assisted surgery may lead to a reduction in THCGs, especially within the most contemporary years, based on the practice makes perfect hypothesis. To test this hypothesis, we relied on a large population-based database, namely the NIS. Our analyses demonstrated several noteworthy findings.
First, we demonstrated an increasing use of robot-assisted surgery among all MSUPs. The highest increase was reported for RARN (EAPC: 25.3%, p < 0.001) followed by RAPN (EAPC: 16.0%, p < 0.001), RARC (EAPC: 14.5%, p < 0.001), and RARP (EAPC: 5.6%, p < 0.001). Our results confirmed those of several previous reports that separately showed an increased uptake of robot-assisted surgery in urology. 2,4,9 However, we are the first to report a global North American contemporary trend analysis of robot-assisted MSUPs relative to nonrobot-assisted MSUPs. Taken together, our findings, combined with all previous reports, 1,2,7,9 showed that the proportion of robot-assisted surgeries among MSUPs is steadily increasing. For some procedures, such as RARP, a plateau may soon become evident. However, for others, where the proportion of robot assistance is lower, such as RARC, the increasing rate may continue for many years to come. It is plausible that in a decade only the most anatomically and/or oncologically challenging patients will be treated without robot assistance. This said, numerous examples in contemporary western literature suggest otherwise, whereby robotic surgeons are open for increasingly greater challenges as time goes by and their experience increases. 25 –27 Moreover, our trend analyses also showed that the overall increasing uptake of robot-assisted surgery was paralleled by an increasing proportion of hospitals using robot assistance. Indeed, we recorded an increasing number of hospitals using robot assistance among all the MSUPs. Particularly, the highest increase was recorded for hospitals performing RARP (EAPC: +14.1%, p < 0.001), followed by those performing RAPN (EAPC: +12.9%, p < 0.001), RARC (EAPC: +11.0%, p < 0.001), and RARN (EAPC: +10.3%, p < 0.001). These results provide an important evidence that the increasing number of hospitals using robot assistance in the United States did not negatively affect the overall THCGs rates.
Second, we reported higher mean THCGs for robot-assisted vs nonrobot-assisted surgeries among MSUPs, except for PN. The highest mean THCGs difference was reported for RARC (+$1829), followed by RARP (+$1824) and RARN (+$1529). No statistically significant difference was recorded between RAPN and non-RAPN. Regarding RP, our results are in agreement with those of Yu et al. (+$1111), 2 who relied on a more historical version (last quarter of 2008) of the NIS database. Regarding RC and RN, we reported lower differences in the mean THCGs between robot-assisted and nonrobot-assisted RC and RN than those previously reported from, respectively, Leow et al. 17 and Jeong et al. 9 However, both investigators relied on different data repositories (the Premier Databases), different study years (Jeong et al.: 2003–2015; Leow et al.: 2004–2010), and different sample sizes (Jeong et al.: n = 23,753; Leow et al.: n = 43,647 weighted-cohort). In addition to patient origin, hospitals location, study years, and sample sizes, the studies of Leow et al. 17 and Jeong et al. 9 reported direct hospital costs instead of THCGs, which represented our outcome of interest and that of Yu et al. 2 In consequence, a direct comparison between the NIS database and the Premier Databases is not applicable. Finally, regarding PN, we confirmed the findings of Yu et al., 2 where no statistically significant difference in health care costs was observed between RAPN and non-RAPN. Taken together, our findings demonstrate that some robot-assisted procedures result in greater differences relative to their non-robot-assisted counterparts than others. It could be postulated that procedures with high complexity, such as RC, contribute to the biggest difference in THCGs. Conversely, less complex procedures, such as PN, do not even achieve statistically significant difference in the mean THCGs, when robot assistance is used vs non-used.
Third, to the best of our knowledge, we are the first to report a decreasing temporal trend of the mean THCGs for robot-assisted procedures among all MSUPs. Specifically, the highest significant linear decrease of the mean THCGs was recorded for RARC (−$1142 per-year), followed by RARN (−$1018 per-year), RAPN (−$497 per-year), and RARP (−$236 per-year). Such trend was also reported for nonrobot-assisted procedures but in lesser magnitude. In consequence, progression of experience and reduction of complications seem to affect the mean THCGs in time, particularly for robot-assisted procedures.
Interestingly, we recorded a decreasing trend of THCGs also for nonrobot-assisted surgeries. However, several factors may affect the overall THCGs over time. For instance, improvement in perioperative management, as well as the introduction of early recovery after surgery (ERAS) programs, 13 may also have played a crucial role on reducing THCGs. In consequence, the overall reduction of costs is representative of a general improvement in perioperative management that may affect surgery regardless the approach. Indeed, this decrease was more pronounced for robot-assisted surgeries. This difference in reduction can be explained by the more recent introduction of robot assistance in urological surgery that may be related with higher margin of outcomes improvement relative to open surgeries, where surgical techniques are well established and global learning curves may have reached a potential plateau. 28 Moreover, to the best of our knowledge, we are the first to observe this phenomenon in the context of robot-assisted procedures. In consequence, a direct comparison with previous literature is not applicable.
Taken together, several generalizations can be made about our findings. First, our analyses confirm a national trend toward increasing adoption of robot-assisted surgery among all MSUPs. These trends were evidenced by several previous North American and European studies. 2,7,9,14,16 In distinction to previous analyses that provided a more fragmented picture, our analysis provides the most global assessment of robot-assisted vs nonrobot-assisted MSUPs. Based on its design, our findings can be used to generalize the notion that robot-assisted MSUPs will soon eliminate a large proportion of nonrobot-assisted surgeries. Second, although we reported higher THCGs for robot-assisted RP, RN, and RC, we also demonstrated a decreasing linear temporal trend of the mean THCGs for all MSUPs. We acknowledge that the higher THCGs for robot-assisted MSUP may be related to more expensive equipment and longer operating room time, which were previously identified as some of the key drivers for these differences. However, we also know that lower postoperative complication rates and shorter LOS of robot-assisted MSUPs may also determine lower THCGs. In consequence, the decreasing trends in the mean THCGs reported in our analyses may be interpreted as an improvement in surgical expertise, which intern results in lower complication rates, shorter operating room time, and shorter LOS. This relationship should further reduce hospital charges since complications, operating room time, and LOS represent the main cost drivers of surgical costs. 9
Despite its strengths, our study is not devoid of limitations. First, as for previous analyses that reported THCGs for MSUPs, 1,4,5,9 our study is based on a retrospective analysis with all its inherent limitations. Second, we were unable to adjust for tumor characteristics. Based on anatomical and oncological complexity that we could not adjust for, it may be postulated that patients treated with nonrobot-assisted MSUPs are subjects to higher rates of complications and longer LOS. This pattern was observed when complications and LOS were examined. 3,4,9,17 Third, we were also unable to adjust for patient characteristics, such as performance status, American Society of Anesthesiologists physical status, differences in laboratory values, and opioid use, as well as the presence or absence of exposure to perioperative chemotherapy, androgen deprivation, and radiotherapy. Fourth, as elegantly and eloquently put by Penson, 29 the THCGs estimates do not include the capital investment of purchasing a robotic system or the indirect economic benefits of patients' early return to work and increased productivity. Moreover, the NIS database does not provide information on operative time that may have further affected the reported changes of THCGs. Last but not least, only inpatient data are available in the NIS database. In consequence, we could not examine the effect of readmissions and postdischarge complications. These should ideally be included when analyses focusing on THCGs are performed.
Conclusions
Robot-assisted MSUPs rates exponentially increased between 2009 and 2015. Although the mean THCGs decreased in a significant manner during the study period among all MSUPs, THCGs of RARP, RARN, and RARC still exceed those of the respective nonrobot-assisted procedures. Conversely, no difference in the mean THCGs was reported between RAPN and non-RAPN.
Footnotes
Disclaimer
This research did not receive any specific grant from funding agencies in the public, commercial, or not-for-profit sectors.
Author's Contributions
E.M. had full access to all the data in the study and takes responsibility for the integrity of the data and the accuracy of the data analysis.
Author Disclosure Statement
E.M. certifies that no conflicts of interest exits, including specific financial interests and relationships and affiliations relevant to the subject matter or materials discussed in the article (e.g., employment/affiliation, grants or funding, consultancies, honoraria, stock ownership or options, expert testimony, royalties, or patents filed, received, or pending).
Supplementary Material
Supplementary Table S1
Abbreviations Used
References
Supplementary Material
Please find the following supplemental material available below.
For Open Access articles published under a Creative Commons License, all supplemental material carries the same license as the article it is associated with.
For non-Open Access articles published, all supplemental material carries a non-exclusive license, and permission requests for re-use of supplemental material or any part of supplemental material shall be sent directly to the copyright owner as specified in the copyright notice associated with the article.