
Abstract
Introduction:
There is paucity of literature about the validation of the American College of Surgeons National Surgical Quality Improvement Program (ACS NSQIP®) surgical risk calculator for prediction of outcomes after robot-assisted radical cystectomy (RARC). We sought to evaluate the accuracy of the ACS NSQIP surgical risk calculator in the patients who underwent RARC at our institute.
Methods:
We retrospectively reviewed our prospectively maintained database for patients who underwent RARC between 2005 and 2017. Accuracy of the ACS NSQIP surgical risk calculator was assessed, by comparing the rate of actual complication events after surgery with the receiver operating characteristics curve analysis by calculating the fractional area under the curve (AUC) and the Brier score (BS). We utilized the code number 51595 and 51596 in the ACS NSQIP calculator for the patients undergoing radical cystectomy and reconstructed with the ileal conduit and neobladder, respectively.
Results:
A total of 462 patients were included in this study: 99 (22%) had diabetes, 302 (66%) had hypertension requiring medication, and 241 (52%) were classified as high American Society of Anesthesiologists (≥3) class. The actual observed rates of any complication and serious complications were 48% and 11%, vs 29% and 25% predicted by the ACS NSQIP, respectively. The actual mean length of hospital stay (10.6 ± 7.8 days) was longer compared with the predicted length (8.5 ± 1.6 days). AUC values were low and the BSs were high for any complication (AUC: 0.50 and BS: 0.29), serious complication (AUC: 0.53 and BS: 0.12), urinary tract infection (AUC: 0.61 and BS: 0.14), renal insufficiency (AUC: 0.64 and BS: 0.08), return to operation room (AUC: 0.58 and BS: 0.07), and early readmission (AUC: 0.55 and BS: 0.11, respectively).
Conclusions:
The ACS NSQIP calculator demonstrated low accuracy in predicting postoperative outcomes after RARC. These findings highlight the need for development of procedure- and technique-specific RARC calculators.
Introduction
Robot-assisted radical cystectomy (RARC) has been increasingly utilized, with a high level of evidence supporting similar oncologic outcomes and improved perioperative outcomes compared with open radical cystectomy (ORC). 1 Benefits include reduced blood loss, transfusion, shorter hospital stay, and quicker recovery. 2,3 Patients undergoing RARC are often of advanced age, with history of smoking and with multiple comorbidities, including cardiopulmonary disease, placing them at increased risk for perioperative complications. With either approaches, it remains a complex procedure with significant morbidity. 4 For this reason, comprehensive preoperative assessment is critical when assessing the benefits and potential harms of RARC. Identification of patients at a higher risk for complications may allow for preoperative management of modifiable risk factors, prompt further patient counseling, and influence clinical decision making.
In 2013, the American College of Surgeons National Surgical Quality Improvement Program (ACS-NSQIP) published a surgical risk calculator designed to estimate patient-specific complication risks for a variety of procedures within the first month after surgery. This calculator was developed based on preoperative and postoperative data from ∼2.7 million surgical procedures performed between 2010 and 2014 in 586 medical centers. 5 This easily accessible online tool incorporates patient-specific variables to predict 30-day outcomes of more than 2500 procedures. There is paucity of data about the applicability of the ACS-NSQIP surgical risk calculator for patients undergoing urologic oncologic procedures. Recent literature has shown poor performance of the risk calculator for estimating 30-day outcomes after ORC and robot-assisted partial nephrectomy. 6,7 To our knowledge, this tool has not been externally validated for its applicability to RARC. We sought to evaluate the predictive value of the calculator's performance in our cohort of patients undergoing RARC.
Methods
Study design
A retrospective review of our prospectively maintained Roswell Park Comprehensive Cancer Center Quality Assurance database was performed (I-97906). We identified 464 patients who underwent RARC with either ileal conduit (IC) or neobladder (NB) at our institution between 2005 and 2017. All preoperative characteristics were obtained from patient health records in accordance with the parameters set forth by the ASC-NSQIP, including age, sex, height, weight, diabetes, hypertension requiring medication, congestive heart failure, dyspnea, chronic obstructive pulmonary disease, dialysis, acute renal failure, smoking status, functional status, American Society of Anesthesiologists (ASA) class, steroid use, ascites, systemic sepsis, ventilator dependence, disseminated cancer, and if procedure was emergent. 5 A current procedural terminology (CPT) code was assigned to each case according to type of urinary diversion used: “51595” was the CPT code assigned to RARC with IC, and “51596” was assigned to RARC with NB. These codes represent all surgical components of the procedure, including cystectomy, lymph node dissection, and urinary diversion except for robotic vs open and diversion approach (intracorporeal vs extracorporeal). The surgeon adjustment of risks—a tool of the NSQIP calculator that allows one to increase the estimated risks if they feel the risks are under calculated—was defined as “1: no adjustment necessary” for all patients.
Patients' preoperative characteristics and procedure CPT code were entered in the online calculator to estimate the predicted 30-day postoperative complication rates for various outcomes. These complications include any complication, serious complication, pneumonia, cardiac complication, surgical site infection (SSI), urinary tract infection (UTI), venous thromboembolism, renal failure, readmission, return to operating room (OR), discharge to nursing or rehab facility, and death. These were then compared with the observed complications rates as determined from our records in the database that are regularly updated by our clinical outreach and database manager.
Statistical analysis
Evaluation of the predictive accuracy of the ACS-NSQIP calculator was performed by comparing the predicted rates vs the observed rates by using the receiver operating characteristic (ROC) and the area under the curve (AUC) of the ROC. The ROC curve provides a visual representation for how accurately the NSQIP scores separated the study subjects into complication vs no complication states. The AUC is a measure of discriminative accuracy; it estimates the ability of a model to separate patients at risk for a given outcome from patients not at risk. AUC values greater than or equal to 0.80 were generally considered useful in predicting responses for individual patients, whereas a value of 0.50 corresponded with the null hupothesis. 8 To assess calibration and overall discriminatory performance, we utilized Brier score (BS). BS is calculated as the average squared difference between predicted probabilities and the observed rate of binary outcomes. 9 BSs can range from 0 to 1, with zero indicating perfect prediction. Higher BSs are indicative of worse model fits, or a larger proportion of unexplained variability. Based on previous studies, a BS of 0.01 or less was considered good predictive performance. 5 Correlations between the predicted and observed length of hospital stay were also tested by using Spearman correlation.
Results
Four hundred sixty-two patients who underwent RARC at our institution during the specified period were included in the study. Thirty-one percent of patients were 75 years or older, 118 were women (26%), and almost all patients were functionally independent at the time of the procedure (99%). More than half were classified as high ASA (≥3) (Table 1). Overall, 226 patients (49%) experienced at least one complication, and 53 patients (11%) experienced serious complications within 30 days of RARC with IC patients showing a statistically significantly higher rate compared with NB (50% vs 33%; p = 0.02) (Table 2).
Perioperative Characteristics
ACS = American College of Surgeons; BMI = body mass index; GFR = glomerular filtration rate; SD = standard deviation.
Perioperative Characteristics (Ileal Conduit vs Neobladder)
ASA = American Society of Anesthesiologists; IC = ileal conduit; ICU = intensive care unit; IQR = interquartile range; NB = neobladder.
The calculated AUC was low (<0.8) for all outcomes. The AUC was 0.50 (95% confidence interval [CI] 0.45–0.56) for overall complications and 0.53 (95% CI 0.45–0.61) for serious complications (Figs. 1 and 2). The highest AUC calculated was for renal failure, 0.64 (95% CI 0.54–0.73) (Fig. 3). When looking at specific complications, for pneumonia, the AUC was 0.59 (95% CI 0.48–0.69). For SSI, the AUC was 0.48 (95% CI 0.43–0.53). For UTIs, the AUC was 0.61 (95% CI 0.54–0.69). For thromboembolism, the AUC was 0.46 (95% CI 0.33–0.60). For cardiac complications, the calculated AUC was 0.59 (95% CI 0.46–0.71). The predicted length of stay was 8.5 days (standard deviation [SD] ±1.6), compared with the observed stay of 11 days (SD ±7.8) (r = 0.12, p = 0.01) (Fig. 3). Similarly, the calculated AUC for readmission was 0.55 (95% CI 0.47–0.63). The calculated AUC for return to the OR in 30 days was 0.58 (95% CI 0.47–0.68). The calculated AUC is displayed in Figures 1 and 2.

AUC curves of postoperative complications. AUC = area under the curve.

AUC curves of postoperative complications.
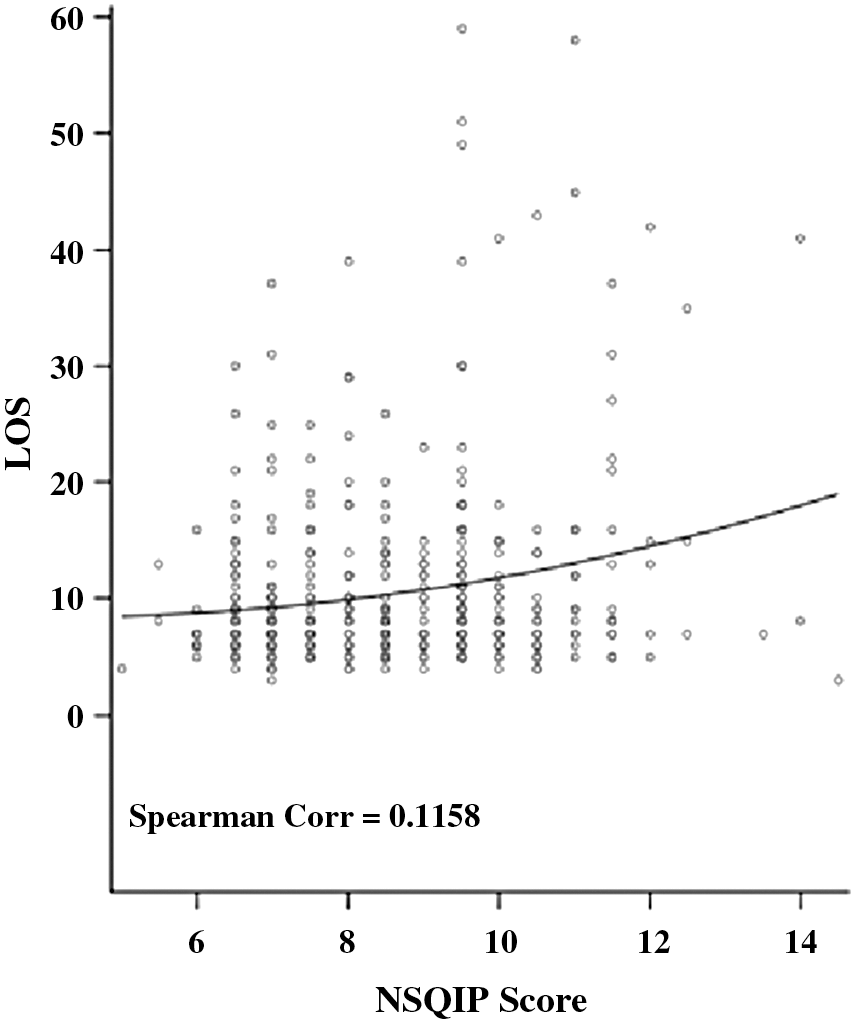
Spearman correlation of predicted length of stay.
BSs were calculated for all collected perioperative outcomes. The BS for any complication was 0.29 and for serious complications it was 0.12. When looking at specific complications, pneumonia had a BS of 0.06 whereas SSI and UTI had BSs of 0.35 and 0.14, respectively (Table 3). Thromboembolism and cardiac complications had the lowest BS of 0.04. Renal failure had a BS of 0.08. When looking at re-admission and return to OR, the BSs were 0.11 for the former and 0.07 for the latter. None of the BS was <0.01, which would have indicated good predictive performance.
Predicted vs Observed Complications with Corresponding Area Under the Curve and Brier Score
AUC = area under the curve; CI = confidence interval; OR = operating room; NA = not applicable; UTI = urinary tract infection.
Discussion
Radical cystectomy is a major procedure that includes simultaneous surgeries involving the urinary, gastrointestinal tracts and the retroperitoneum. It is imperative to counsel patients about the high morbidity associated and to clearly define realistic expectations. Risk calculators, such as the NSQIP calculator, have an important role in this context in counseling patients. The ACS reported that 58,789 urologic procedures were included in developing its surgical calculator among the 2.7 million procedures analyzed. However, the subsequent breakdown of specific urologic procedures included has not been published. 5 The NSQIP surgical risk calculator is an easily accessible tool that allows clinicians to empirically estimate customized, patient-specific risks for a wide array of surgical procedures. 5 An advantage of this tool is the large and diverse sample size of which it was designed, providing good generalizability for most patient populations. However, when applied to a specific surgical procedure such as radical cystectomy, there exist many pitfalls of the calculator in both preoperative variable collection and postoperative outcome estimations.
Certain preoperative variables collected by the NSQIP calculator may not be particularly relevant as they pertain to radical cystectomy (RC). For example, criteria such as ventilator dependence, preoperative sepsis, or emergency of case are not as informative in the setting of an elective procedure such as RARC. Conversely, the collection of certain preoperative variables not included in this calculator may provide more accurate predictions of postoperative outcomes in this cohort. As an example, history of prior abdominal surgery or receipt of radiation therapy is an important factor when predicting postsurgical complications, and it is not collected as a preoperative data point in the current calculator. Similarly, the calculator captures data such as dialysis or acute kidney injury, but it does not collect quantitative data regarding renal function. These binary data points limit the degree to which we can stratify preoperative renal function. Numerical data such as blood urea nitrogen, creatinine, or estimated glomerular filtration rate may better predict those at risk for postoperative renal deterioration and thus impact patient selection and preoperative counseling. 11 Neoadjuvant chemotherapy is another preoperative characteristic that warrants collection. Although prior studies suggested that neoadjuvant chemotherapy may not add to surgical morbidity, associated hematologic toxicity can be of detrimental consequences. 12, 13 The approach to urinary diversion, intracorporeal vs extracorporeal, may also affect perioperative outcomes. In a recent study by Hussein et al., intracorporeal urinary diversion was associated with higher rates of complications, readmissions, and longer hospital stay. 14 More than 1500 unique CPT codes are included in development of the calculator, whereas few (if any) robotic-assisted procedures are included for analysis. 10 The under-representation of robotic procedures in development of this calculator may contribute to the discordance between observed and predicted outcomes.
In addition to its use as a quality indicator, surgical risk calculators are used as tools to identify high-risk patients for counseling purposes and clinical decision making. The NSQIP calculator demonstrated poor predictive and discriminatory ability in all studied complications at 30 days, as evidenced by low AUC. The result is that many patients who would potentially benefit from high-risk counseling or alternate treatments are not being recognized, as such, by the current risk calculator. A reason for this may lie in the 30-day period for which the NSQIP database has been developed. Although the calculator is designed to capture early perioperative outcomes within the first month after surgery, it may not reflect the actual burden of RARC. It has been found that approximately two-thirds of complications after RARC occur after 3 months after surgery. 15 These complications can cause significant morbidity, and they should be included in the discussion when counseling patients before surgery. Mortality within the first month after RARC is likely a result of complications related to operative management rather than bladder cancer itself. 16 Although this statistic may be an indicator of quality of care, it may not accurately reflect complications. Prior studies show that morbidity and mortality after cystectomy are two- to three-fold higher at 90 days compared with 30 days. 17 Indeed, our data revealed that 7% of IC patients and 13% of NB patients were readmitted beyond the 30-day timeframe. Designing a calculator to predict outcomes beyond a 30-day window may help capture more patients at risk for complications.
Although we observed that the NSQIP had poor ability to predict outcomes in RARC, there are limitations to our work. Limitations for this study include its retrospective nature and inherent risk of selection bias. All procedures were performed by an experienced robotic surgeon at a single comprehensive cancer institution; this may limit the generalizability of our results to all centers. The CPT codes available on the NSQIP calculator utilized in our analysis were “51595” for RARC with IC, and “51596” for RARC with NB. Although “51595” included bilateral pelvic lymphadenectomy, including external iliac, hypogastric, and obturator nodes, there was no specific CPT code for those who received RC with NB who also received lymph node dissection. Therefore, these patients were categorized under “51596.” It should be noted that the strength of BS becomes increasingly limited when analyzing data of low sample size or outcomes of low prevalence. In these cases, comparing the calculated BS with null BS can help better illustrate the true calibration of the calculator. 18 Finally, although we follow our patients, even if they are re-admitted and managed at an outside institution, some complications could have been missed.
Conclusion
The ACS-NSQIP risk calculator demonstrated low accuracy in predicting 30-day postoperative outcomes ater RARC. These findings highlight the need to develop procedure- and technique-specific calculators for RARC.
Footnotes
Author Disclosure Statement
No competing financial interests exist.