
Abstract
CT is a widely used imaging modality in the diagnosis of urolithiasis but subjects patients to ionizing radiation. Reduced dose protocols have recently gained wide acceptance. Stone density measurements have been used to predict composition and help guide treatment in standard dose CT (sCT) but not in reduced dose CT (RdCT). We aimed to compare density measurements obtained through RdCT vs sCT and to determine if there is a correlation between stone composition. A total of 201 patients undergoing evaluation for renal colic were prospectively recruited, whereby each subject underwent an sCT (120 kVp) followed immediately by an RdCT (80 or 100 kVp). All calculi <5 mm were excluded to prevent volume averaging and distortion to Hounsfield units measurements. The iliac bone cortex was utilized as an internal control. We also collected stone compositional analyses. In total 36 stones were identified. When the same calculi were evaluated with 120 kVp vs 80 kVp, the RdCT revealed a higher HU (n = 18, 1214 ± 520 vs 1007 ± 307, p < 0.005). Statistical difference was not achieved when 120 kVp was compared with 100 kVp scans (p = 0.151). The percentage differences were 10.6 ± 21 and 1.4 ± 15, respectively. Measurements of the iliac crest mirrored the findings of calculi, with density measurements in 80 kVp being statistically higher than those obtained through 120 kVp. A total of 41 stone analyses were reviewed in accordance with variable CT dosages. When stratified by CT kVp and stone composition, RdCTs trended toward wider density ranges than sCT. Density measurements of urolithiasis in RdCT, achieved by voltage reduction, corresponds to a paradoxical increase in HU. Although HU can be used as a predictor for stone composition, there can be a wide deviation in measured density, and this can be further magnified in the setting of dose reduction.
Introduction
CT remains the gold standard in the diagnosis of urolithiasis. Its unique ability to characterize material density has important clinical applications. Correlation between renal stone density, reported in HU, has long been used to predict stone composition. 1 Although CT is the first-line examination in evaluating patients with renal calculi, it also exposes patients to ionizing radiation.
Adherent to the principle of “as low as reasonably achievable” (ALARA), multiple institutions have implemented reduced dose CT (RdCT) protocols in the management of renal colic and stone disease. Systematic reviews of dose-reduced CT have demonstrated excellent sensitivity and specificity, with diagnostic accuracies >90%. 2,3
Historically, dose reduction was achieved by modulating the tube current. More recently, iterative reconstruction techniques allowed for further dose reduction. Both of these techniques, however, did not affect the mean HU values. 4,5 Current CT scanners can achieve dose reduction through tube voltage modulation. Unlike tube current modulation and iterative reconstruction, HU readings obtained from CT scans performed with tube voltage modulation will differ from HU readings obtained from CT scans using standard tube voltage (120 kVp). 6 Voltage reduction has been shown to affect HU levels in stones; however, this has not been thoroughly addressed in the urologic literature. 7 Since HU readings of urolithiasis has been used to assist in patient care decisions, it is important that urologists are aware of this potential pitfall, as patient management may differ. 1,7
The purpose of this study is to compare HU measurements of urolithiasis acquired using standard CT parameters at 120 kVp vs RdCT protocol obtained through a reduced voltage of 80 or 100 kVp. Secondarily, this study seeks to establish correlation between RdCT HU measurements and stone composition.
Methods
This study was approved by the Yale Institutional Review Board as well the Yale Radiation Safety Committee. A total of 201 patients undergoing evaluation for suspected renal colic at the emergency department were prospectively recruited as part of our initial study on the diagnostic accuracy of RdCT. 8
Inclusion criteria
Adult patients who presented with renal colic to the emergency department between February 2012 and May 2013 were enrolled into the study. After providing informed consent, each participant underwent both a standard and RdCT of the abdomen pelvis during the same session.
CT scan protocol
All CT scans were performed without intravenous or oral contrast on a 64-slice LightSpeed Scanner (GE Healthcare, Milwaukee, WI) using automated tube current modulation (SmartmA with noise index of 35 for 2.5-mm slice thickness), 0.5 second rotation time, and a pitch of 1.375. A standard dose CT (sCT) was performed as a first pass utilizing a tube voltage of 120 kVp. The protocol used for RdCT was divided into a low and high body mass index (BMI) protocols, based on a threshold of effective abdominal diameter (600 mm). Subjects with effective abdominal diameter of <600 mm, generally corresponding to a BMI of <30 kg/m2, received the low BMI protocol. Those above this cutoff received the high BMI protocol. The range of tube current for the low BMI protocol was set as 50–100 mA, and the tube voltage as 80 kVp from the top of the kidneys to the iliac crests, and 100 kVp from the iliac crests through the pelvis. The high BMI protocol utilized tube current between 50 and 150 mA, with 100 kVp from the top of the kidneys through the pelvis.
Stone size and Hounsfield measurement
Stone size was measured as the largest diameter of the stone in the axial plane. The elliptical region of interest (ROI) tool was used to measure the stone density in HU, as most calculi were of similar shape. HU measurements were obtained by placing an ROI in the middle of the stone. As much of the stone was included in the ellipse and care was taken not to include adjacent structures (Fig. 1A).
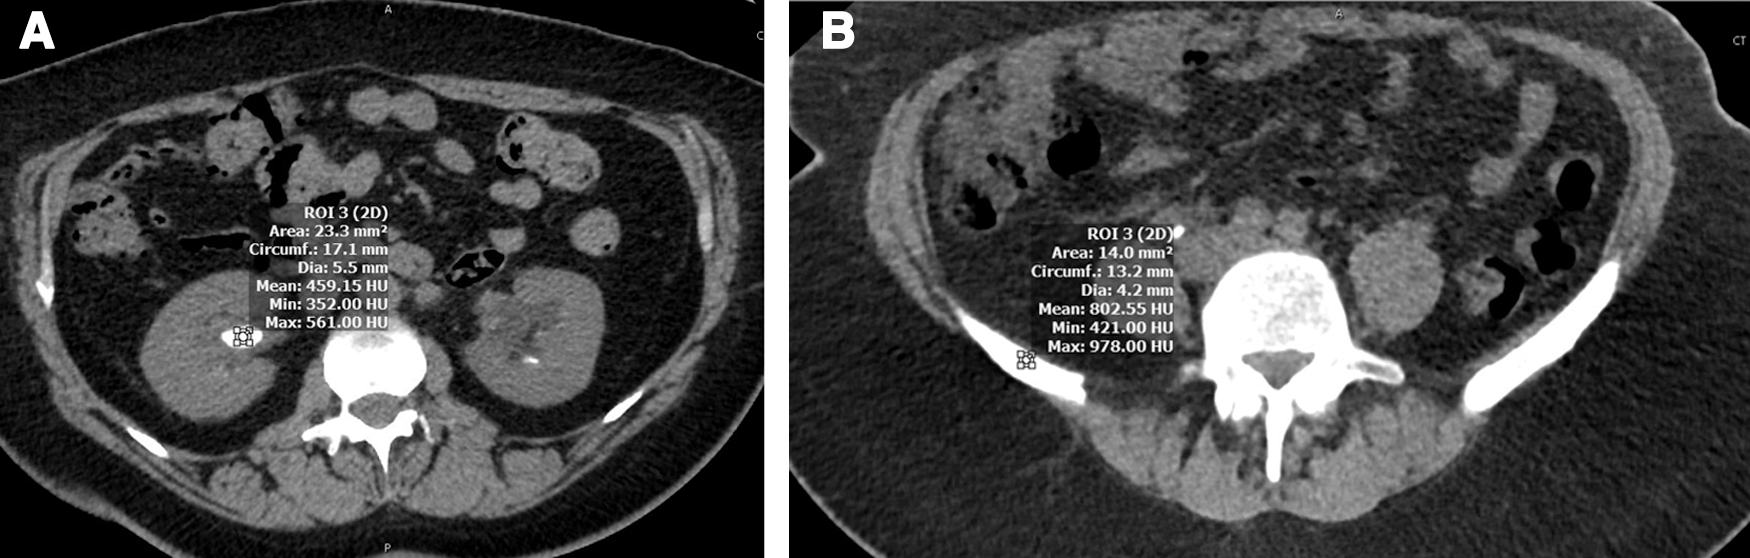
Iliac crest measurement for internal validation
As a measure of internal validation, the iliac bone cortex was utilized as a control. Bone is primarily composed of hydroxyapatite, which has similar density as urinary calculi. HU measurements were obtained at the cortical portion of the iliac crest utilizing the same elliptical ROI tool, taking care to avoid inclusion of the medullary portion of the bone (Fig. 1B).
Stone composition
Stone compositional analyses were performed when available. All of the specimen were obtained from surgical intervention. Stones that did not have a primary composition (defined as >50%) were excluded from analysis, in an effort to optimize the homogeneity of density measurements. The calculi included for analysis were categorized according to their dominant composition.
Statistical analysis
Statistical analyses were performed with SPSS 24.0 using paired t-tests with an alpha value of 0.05. Values are displayed as mean ± standard deviation.
Results
A total of 201 consecutive patients with suspected renal colic were enrolled in the study. Out of them 102 patients had kidney or ureteral stones and 26 patients collectively had 36 stones in the kidney or ureter that were 5 mm or greater in size. Eleven patients with 18 stones >5 mm were scanned with the 80 kVp reduced voltage protocol and 15 patients with 18 stones >5 mm were scanned with 100 kVp voltage reduction.
The mean stone size was 7.7 mm (range 5.1–17 mm). Although we do not report size as a primary outcome, we did not note any significant difference in size measurements in our analysis. When the same calculi were evaluated with 80 kVp vs 120 kVp, the RdCT revealed a higher HU (n = 18, 1214 ± 520 vs 1007 ± 307, p < 0.005) (Fig. 2). Statistical difference was not achieved when 100 kVp was compared with 120 kVp scans (n = 18, 962 ± 354 vs 915 ± 299, p = 0.151) (Fig. 3). The percentage differences were 10.6% ± 21% and 1.4% ± 15%, respectively. Furthermore, our measurements of the iliac crest yield similar results. Measured density was significantly higher in the scans utilizing 80 kVp as opposed to 120 kVp (n = 11, 883.18 ± 245.47 vs 752.45 ± 253.05, p = 0.002) (Fig. 4).
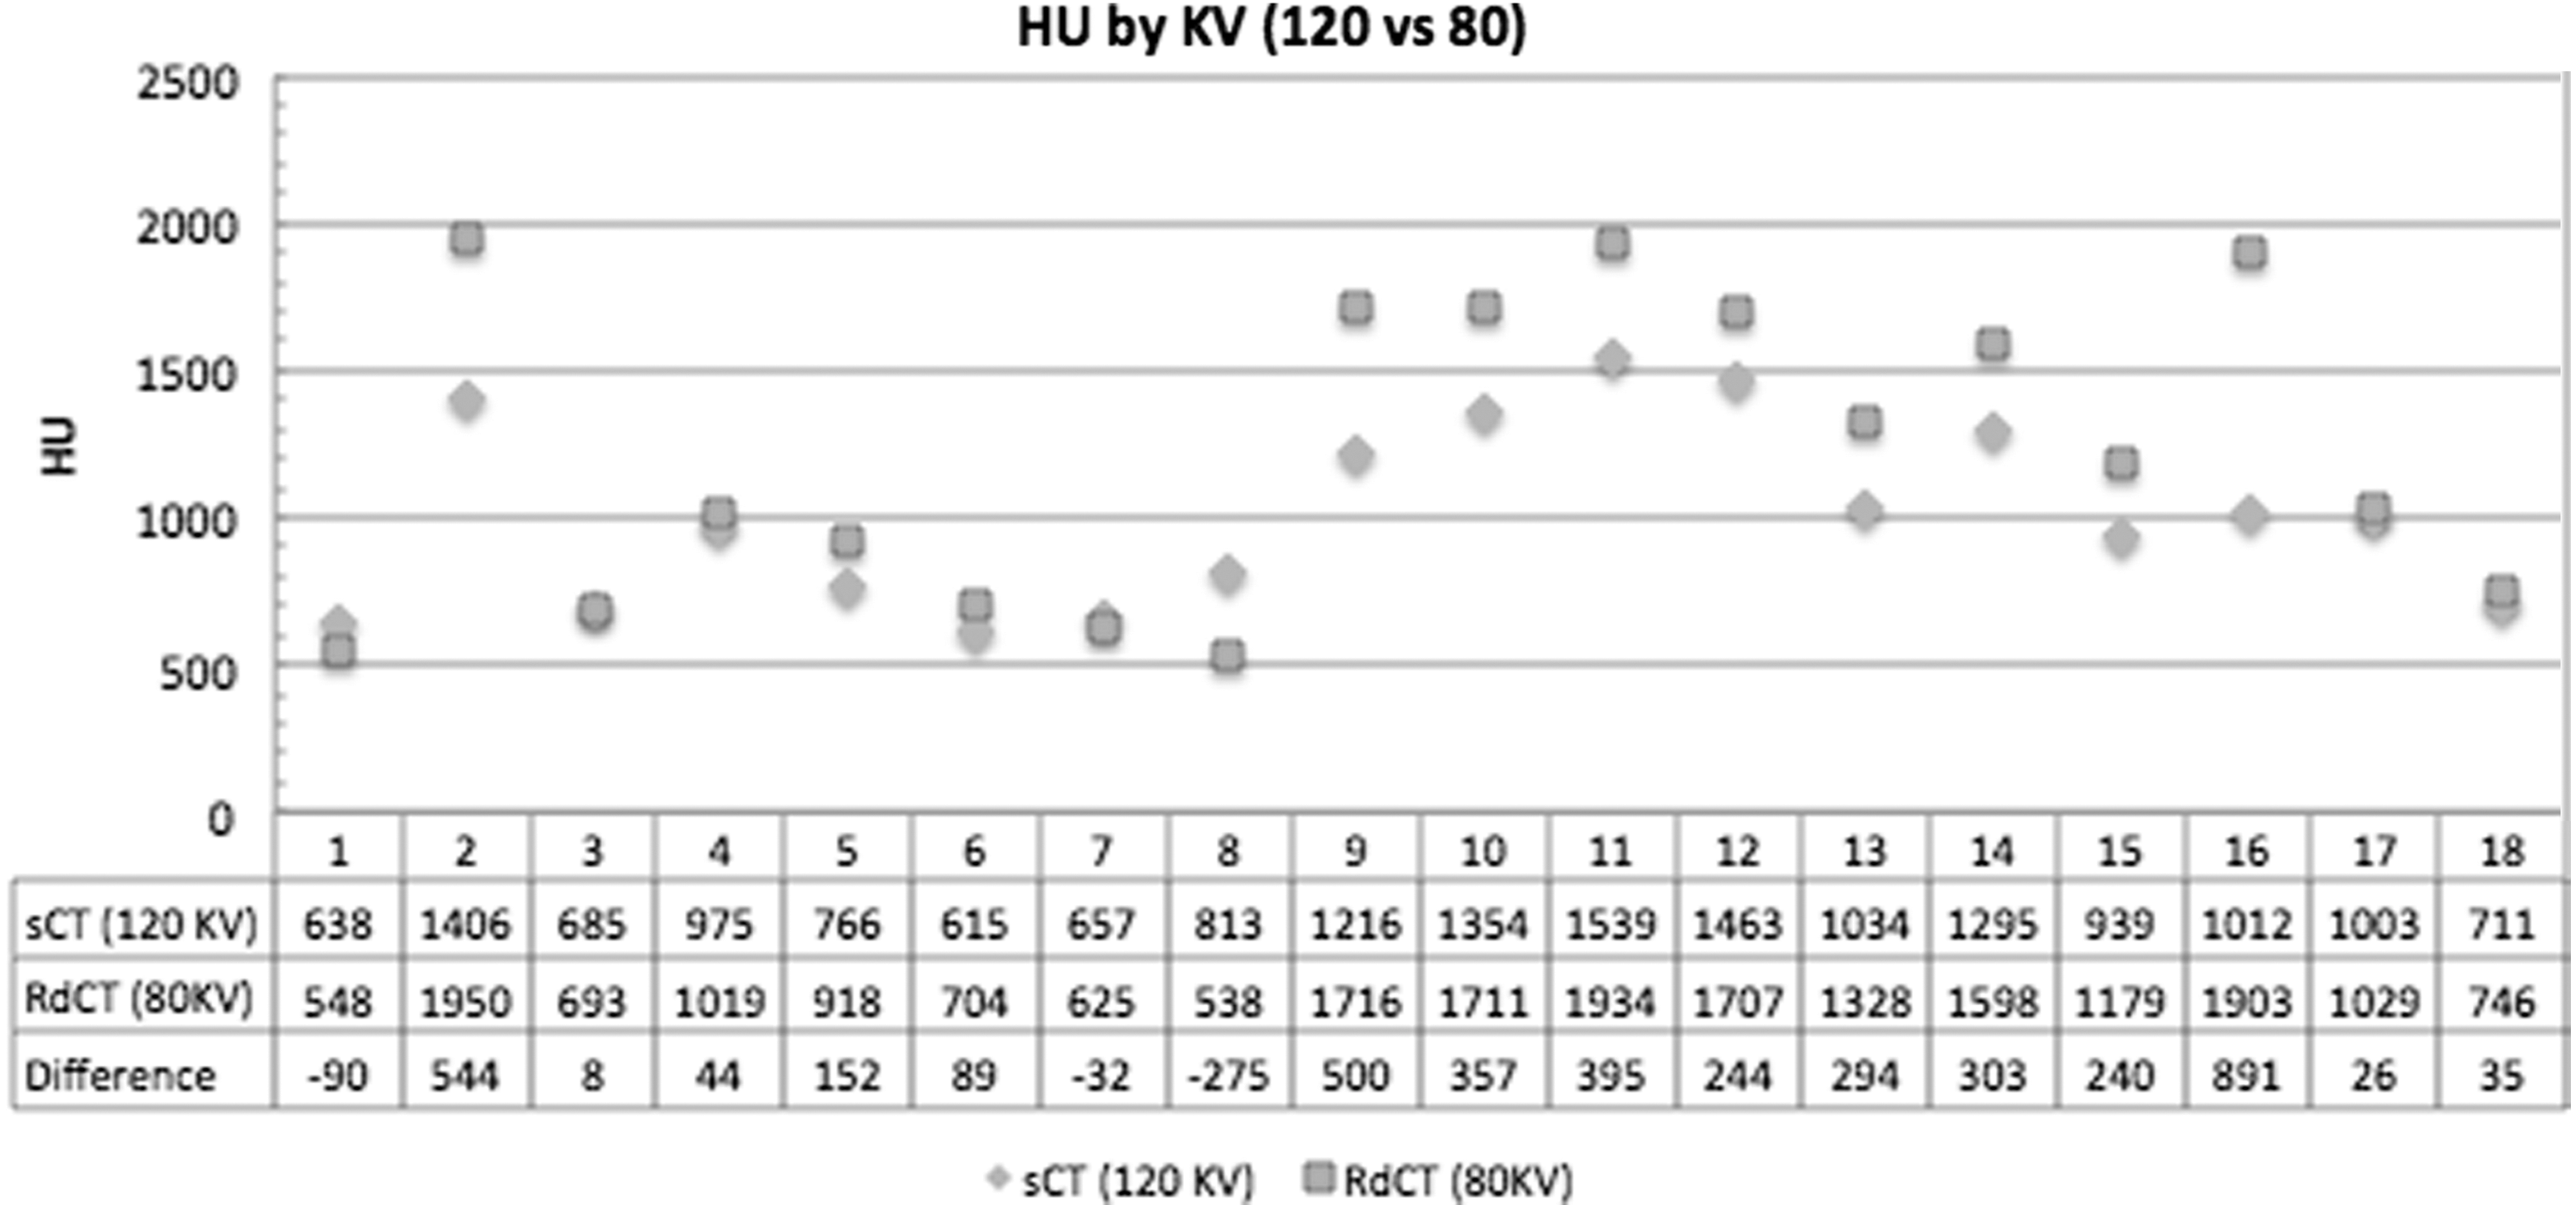
Stone density measurements in HU between standard 120 kVp CT vs 80 kVp RdCT. RdCT = reduced dose CT.

Stone density measurements in HU between standard 120 kVp CT vs 100 kVp RdCT.

Density measurements, in HU, of iliac crest, comparing standard 120 kVp CT vs 80 kVp RdCT.
In total 41 stone analyses were reviewed in accordance with variable CT dosages. The stones' primary compositions were calcium oxalate dihydrate (4), calcium oxalate monohydrate (31), calcium phosphate (21), and uric acid (5). When stratified by CT voltage and stone composition, RdCTs trended toward wider density ranges than sCT, but significance was not achieved (Fig. 5).
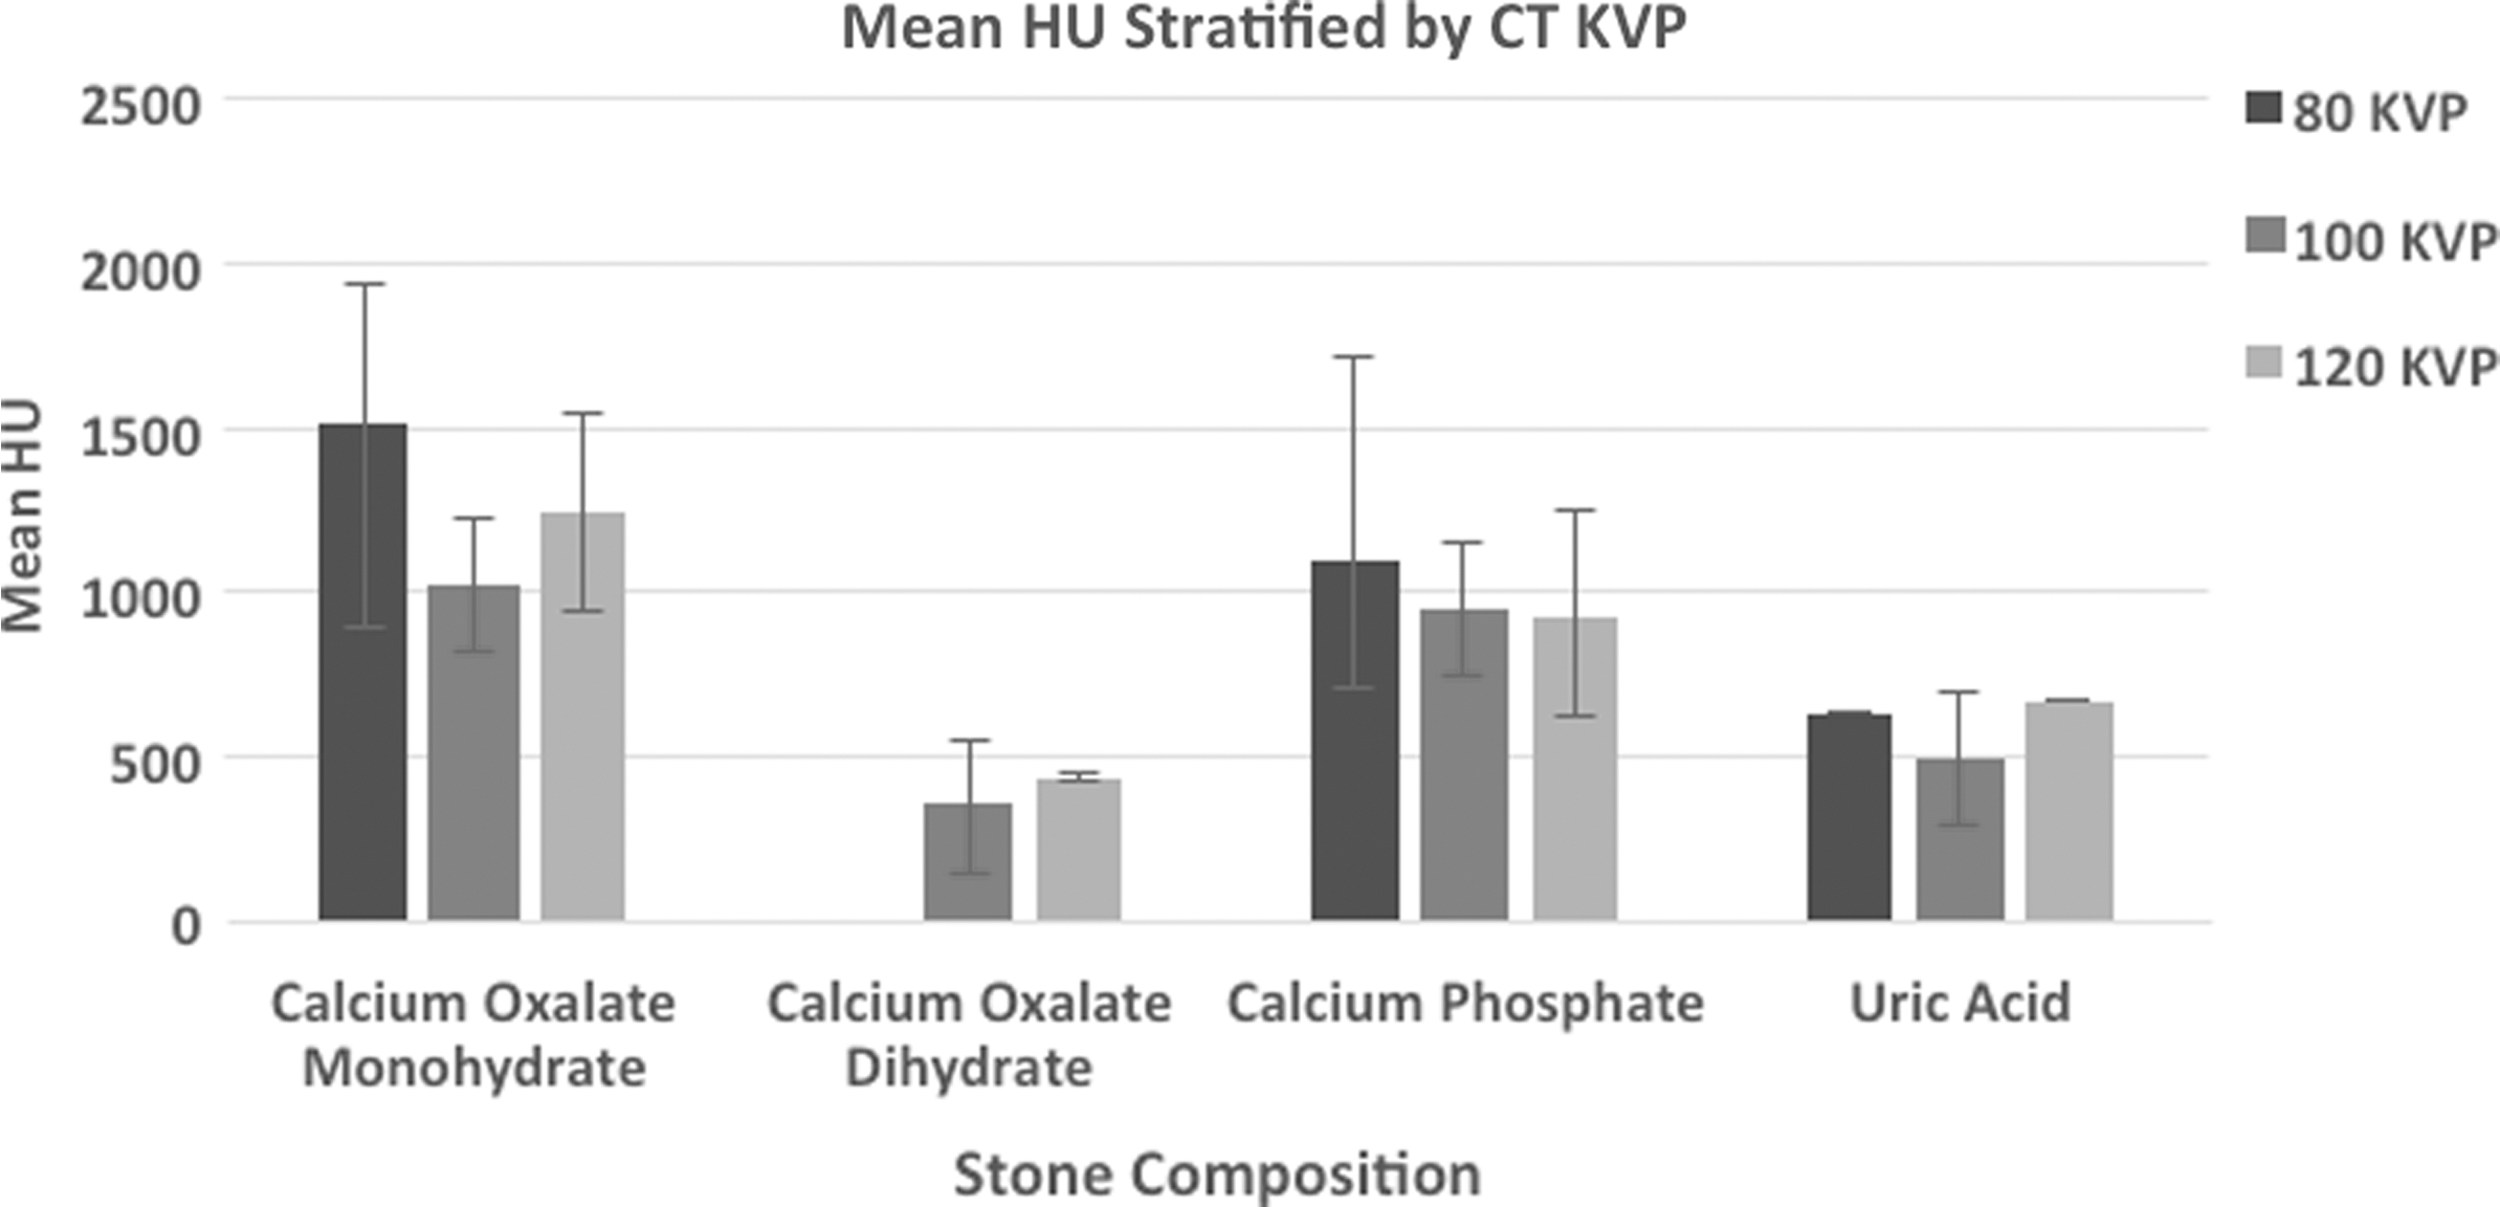
Urolithiasis stratified by primary composition and their average density measurements based on varying CT voltages (80, 100, and 120 kVp).
Discussion
In the past 30 years, the number of CT scans performed in the United States has increased more than sixfold. Health care providers should be cognizant of the effects of radiation exposure and their risks of secondary malignancy. As such, the principle of “as low as reasonably achievable” has been developed.
Low-dose CT scans can decrease radiation exposure 10-fold. The RdCT protocol implemented in our study had an average radiation dose of 1.6 mSv compared with 12.6 mSv in the standard CT scan protocol. The diagnostic capability of low-dose scans to accurately diagnose kidney stones has been well proven in the literature. 9 In addition to diagnosing the presence of stones, CT scans can be used to predict stone composition using stone density measurements. 10
Stone composition can guide management and surgical planning. Uric acid stones, which tend to have lower Hounsfield densities between 200 and 600 HU, 11 can be managed with medical dissolution in lieu of surgical removal. 10 Stones with high densities >1000 HU, in contrast, have demonstrated resistance to fragmentation by shockwave lithotripsy. 12
When comparing the stone density at 120 kVp vs 80 kVp, we found that decreasing the tube voltage resulted in an average increase in density measurements by ∼10%. This offers us an important clinical guideline when interpreting an RdCT scan with decreased tube voltage. Our data demonstrate that denser stones tend to exhibit greater increases in HU, denoting not an absolute increase but rather a multiplier effect. We did not detect a statistical difference when comparing the 120 kVp with the 100 kVp, perhaps implying a dose-dependent effect of voltage reduction.
HU as a surrogate for density measurements have been utilized in specialties other than urology to guide treatment. 13,14 Our measurements of the iliac crest served as an internal validation, affirming the findings of 120 kVp vs 80 kVp stone measurements. It also suggests that other tissues will exhibit parallel changes in HU when scanned with reduced voltage, expanding the applicability of this study.
Our attempt to classify stones based on their true stone composition revealed that there was wider variation in stone density measurements in the 80 kVp group. This phenomenon indicates that tube voltage affects both image noise and tissue contrast. The dose change is proportional to the square of the tube voltage change and the noise change is inversely proportional to the tube voltage change. 15
Our study is limited by the relatively small number of test subject after the application of the exclusion criteria. Many of these patients also lacked stone specimen for analysis, which limited our ability to examine the HU ranges associated with various stone compositions. The matter is further complicated by a number of calculi with mixed composition, which has always imposed a limitation on radiologic studies by introducing significant sampling error. 7 Finally, the stone fragments analyzed after surgical removal may not be representative of the entire stones.
Although a prior ex vivo animal study has been conducted, 7 this is the only clinical study to our knowledge with consecutive application of sCT followed by RdCT for the evaluation of resultant stone density. As stated previously, other studies have looked at and found no difference in density measurements with tube current modulation and iterative reconstruction. 5 Follow-up studies can examine whether this change persists when evaluating other tissues/organs with and without the addition of contrast enhancement.
Conclusion
Density measurements of urolithiasis in RdCT, achieved by voltage reduction, corresponds to an increase in HU. Although HU can be a useful predictor for stone composition, there can be a wide deviation in measured density, and it is further magnified in the setting of RdCT. As low-dose CT gains further acceptance, it is important to recognize the effects of voltage reduction on perceived density measurement. Urologists in particular should be wary of mischaracterizing stone composition and adjust their management decisions accordingly. Future research efforts can be dedicated to generating a more expansive database correlating stone density measurements and composition utilizing dose-reduced CTs.
Footnotes
Author Disclosure Statement
No competing financial interests exist.