
Abstract
Objective:
To evaluate the effect of obesity and overweight on surgical, functional, and survival outcomes in patients with large kidney masses after minimally invasive surgery.
Materials and Methods:
Within a multicenter multinational dataset, patients found to have
Results:
Of 812 patients, 30.6% were normal weight, 42.7% were overweight, and 26.7% obese. Overweight (odds ratio 0.82, 95% confidence interval [CI]: 0.51–1.31, p = 0.406) and obese patients (OR: 0.81, 95% CI: 0.44–1.47, p = 0.490) experienced similar complication rates than normal weight. Moreover, no statistically significant differences in eGFR were found for overweight (p = 0.129) or obese (p = 0.166) patients compared to normal weight. However, higher OM rates were recorded in overweight (hazard ratio [HR] 3.59, 95% CI: 1.03–12.51, p = 0.044), as well as in obese, patients (HR 7.83, 95% CI: 2.20–27.83, p = 0.002). Similarly, higher DR rates were recorded in obese (HR 2.76, 95% CI: 1.40–5.44, p = 0.003) patients.
Conclusions:
Obese and overweight patients do not experience higher complication rates or worse eGFR after minimally invasive kidney surgery, which therefore can be deemed feasible and safe also in this subset of patients. Nevertheless, obese and overweight patients seem to carry a higher risk of OM, and therefore, they should undergo a strict follow-up after surgery.
Introduction
Renal cell carcinoma (RCC) is one of the leading causes of death among genitourinary cancers. 1 Several tumor 2 and host features are associated with RCC diagnosis and prognosis, including age, gender, marital status, and obesity. 3 –5 Overweight and obesity are defined according to the body mass index (BMI) of at least 25 and 30 kg/m2, respectively. Overweight affects more than 1 billion of people, while 300 million are considered obese. 5
Nowadays, minimally invasive surgery (MIS) represents the preferred surgical approach for the management of renal masses. 6 Unfortunately, results about surgical and functional outcomes after MIS in obese patients are conflicting. Indeed, obesity was found to be associated with worse tumor features 7 and surgical 8 and functional outcomes 7 by some authors, while others showed the feasibility and the safety of robotic kidney surgery even in patients with a BMI as much as 60 kg/m2. 9
Recently, a growing body of literature explored the feasibility of MIS for large renal masses.
10,11
However, to the best of our knowledge none of the studies available in literature specifically focuses on the effect of overweight and obesity status on surgical, functional, and oncologic outcomes after MIS for large renal masses (
Thus, we aimed to test the hypothesis that overweight and obese patients with large renal tumors may experience worse outcomes after laparoscopic or robotic kidney surgery compared to their normal weight counterpart.
Materials and Methods
Study design and features of interest
Using a multicenter (20 institutions) multinational (7 countries) database, we identified cases with
Baseline characteristics included age, preoperative estimated glomerular filtration rate (eGFR), surgery type, gender, comorbidities (diabetes, hypertension, chronic kidney disease >3), ASA score, RENAL score, clinical T-stage, and clinical N-stage. Main perioperative characteristics included operative time, estimated blood loss, length of stay, any complications, and major complications (defined according to the Clavien-Dindo system
Main outcomes
The main outcome of interest was any complication rates, defined as any complication that occurred during the surgical procedure or as much as 30 days after surgery. Secondary outcomes were the eGFR change over time, overall mortality (OM), and local or distant disease recurrence (DR) rates. We defined follow-up as the time interval between surgery and death due to any cause. For patients in whom none of the events occurred, we defined the follow-up time interval as the period from surgery to the last follow-up visit. The follow-up time for DR was defined as the time interval between surgery and DR. For patients without DR, the follow-up was defined as the time interval of the period from surgery to the last follow-up visit or death for any cause.
Statistical analysis
All the analyses were stratified according to BMI categories defined as: obese (BMI
Second, mixed models accounting for the random effect of belonging institute tested the effect of several covariates, including BMI category, on any complication rates. Covariates included in multivariable models were those statistically significant in univariable analyses (p < 0.05).
Third, linear mixed models taking into account the within and between patient eGFR variation 12 tested the effect of BMI classes on eGFR change over time, after accounting for the interaction between BMI classes and follow-up time. Moreover, multivariable linear mixed model was fitted to test the effect of BMI categories after accounting for possible confounders. Furthermore, a sensitivity analysis within the subgroup of partial nephrectomy patients was performed.
Fourth, Kaplan–Meier plots graphically depicted overall survival (OS) and disease-free survival (DFS) after stratification according to BMI classes. Univariable Cox's proportional hazard ratio (HR) models estimated HR and 95% confidence intervals (95% CI) for OM and local or distant DR rates.
All tests were two sided, and a level of statistical significance was set at p < 0.05. Analyses were performed using the R software environment for statistical computing and graphics (version 3.6.1;
Results
Descriptive analyses
In the original dataset, 1203 patients were included. Of them, 391 (32.5%) did not match our inclusion criteria and were excluded from the analyses resulting in 812 included patients with cT2-4 renal masses. Of all, 30.6% were classified as normal weight, while 42.7% and 26.7% were classified as overweight and obese, respectively.
Obese patients were younger (60.9 vs 65.0 years old, p = 0.014) and with lower eGFR (73.0 vs 81.6 mL/minute, p = 0.046) compared to normal weight patients. Moreover obese patients were more frequently diabetic (30.4% vs 16.5%, p = 0.001), with hypertension (55.8% vs 35.9%, p < 0.001) and Chronic Kidney Disease
Preoperative Descriptive Characteristics of Patients with ≥cT2 Renal Masses in Whom Minimally Invasive Kidney Surgery Was Performed
Kruskal-Wallis test.
Chi-square test.
Significant codes: *0.01 ≤ p < 0.05; **0.001 ≤ p < 0.01; *** < 0.001.
Post hoc analyses comparing obese and overweight patients to normal weight patients. p-Value for post hoc analyses was adjusted according to Bonferroni correction for multiple comparisons. In bold are reported statistically significant p-values.
ASA = American Anesthesiologist Association; eGFR = estimated glomerular filtration rate.
Moreover, obese patients experienced longer operative time than normal weight (184.0 vs 130.0 minutes, p < 0.001), but shorter length of stay (3 vs 6 days, p < 0.001). In addition, obese patients had higher rates of pN1 tumors than normal weight (1.8% vs 0.4%, p < 0.001) (Table 2).
Main Perioperative and Postoperative Outcomes After Minimally Invasive Kidney Surgery in Patients with ≥cT2 Renal Masses
Kruskal-Wallis test.
Chi-square test.
Significant codes: * < 0.001; **0.01 ≤ p < 0.05; ***0.001 ≤ p < 0.01.
In bold are reported statistically significant p-values. Post hoc analyses comparing obese and overweight patients to normal weight patients. p-Value for post hoc analyses was adjusted according to Bonferroni correction for multiple comparisons.
Effect of BMI on complication rates and renal function
Overall, 724 (89.2%) patients had data available about complications. Of all, the 24.3% of patients experienced intra- or postoperative complications (Table 2). More specifically, 68 (9.4%) and 120 (16.6%) had intra- and postoperative complications, respectively. However, only 3.3% were classified as major complications (Clavien-Dindo
Univariable and Multivariable Mixed Models Predicting Any Complications After Minimally Invasive Kidney Surgery After Accounting for the Random Effect of Clustering According to Belonging Center
In bold are reported statistically significant p-values.
BMI = body mass index; CI = confidence interval.
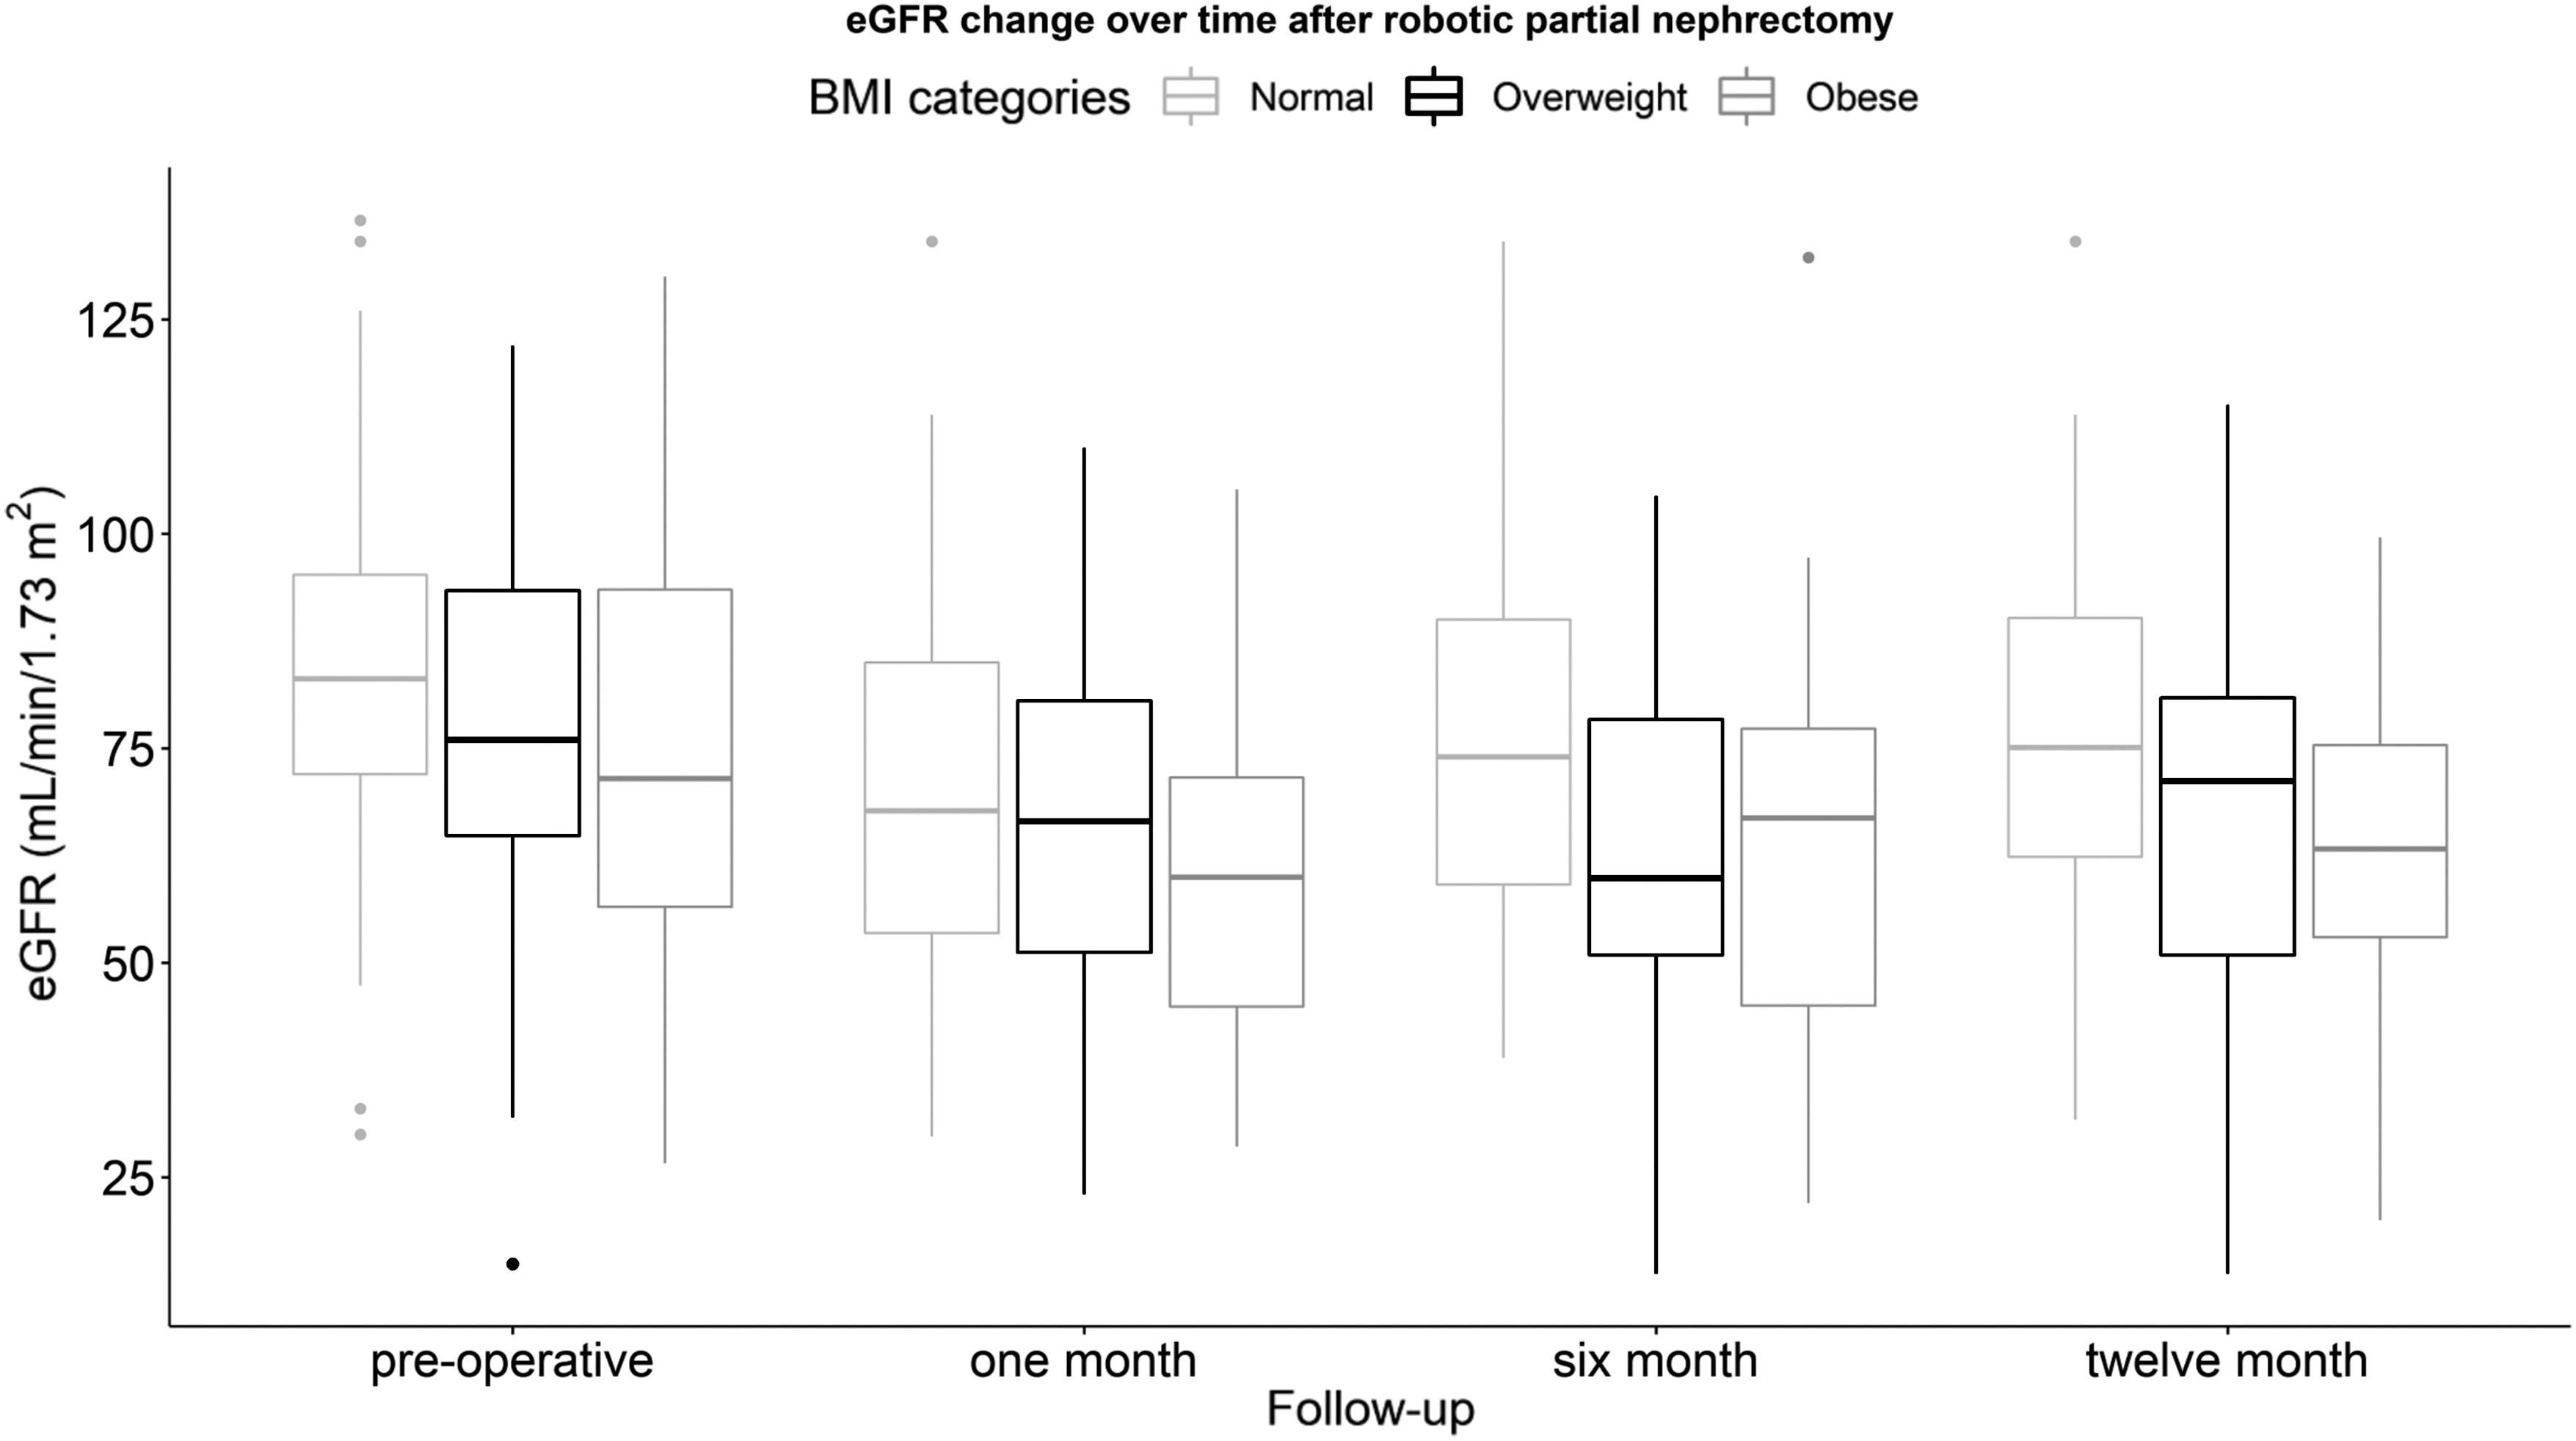
Similarly, even if obese patients had worse eGFR preoperatively (Table 1), no statistically significant differences were found at 1, 6, and 12 months postoperatively in terms of eGFR (Table 2). Linear mixed model accounted for 1958 measurements overtime. In this study, a statistically significant eGFR reduction (coefficient: −8.71, 95% CI: −9.66 to −7.76, p < 0.001) was shown through the follow-up, as per the effect of kidney surgery. Conversely, no statistically significant differences in eGFR were found when comparing overweight (coefficient: −3.06, 95% CI: −7.02 to 0.89, p = 0.129) or obese (coefficient: −3.20, 95% CI: −7.74 to 1.34, p = 0.166) patients to the normal weight patients. Moreover, no statistically significant interaction of follow-up time with overweight status (p = 0.112), as well as with obese status (p = 0.139), was found (Fig. 1). Multivariable models yielded virtually the same results (Table 4) both in overweight (p = 0.446) and obese patients (p = 0.241).

Boxplots graphically depict the eGFR at each follow-up time points for normal, overweight, and obese patients within the overall cohort. eGFR = estimated glomerular filtration rate.
Multivariable Linear Mixed Models Predicting Estimated Glomerular Filtration Rate After Minimally Invasive Kidney Surgery
In bold are reported statistically significant p-values.
Sensitivity analyses focusing only on robot-assisted partial nephrectomy patients showed similar results. Indeed, a statistically significant eGFR reduction (coefficient: −2.86, 95% CI: −4.73 to −0.99, p = 0.003) was shown through the follow-up, as per the effect of kidney surgery. Conversely, no statistically significant differences in eGFR were found when comparing overweight (coefficient: −4.15, 95% CI: −12.38 to 4.02, p = 0.321) or the obese (coefficient: −7.32, 95% CI: −16.38 to 1.74, p = 0.113) to the normal weight patients. Moreover, no statistically significant interaction of follow-up time with overweight status (p = 0.240), as well as with obese status (p = 0.602), was found (Fig. 2). Multivariable models yielded virtually the same results (Table 4) both in overweight (p = 0.419) and obese patients (p = 0.711).
Boxplots graphically depict the eGFR at each follow-up time points for normal, overweight, and obese patients within the robotic partial nephrectomy subgroup.
Effect of BMI on survival outcomes
Overall, 678 (83.5%) of the patients had data available about OM. Among them, only 33 (4.9%) deaths were recorded. Similarly, 647 (79.7%) had data available about DR. Among them, only 67 (10.4%) experienced DR. The 5-year OS rates were 91.5% ± 5.5%, 87.0% ± 4.0%, and 67.2% ± 15.6% in normal weight, overweight, and obese patients, respectively (p = 0.001) (Fig. 3). Higher OM rates were recorded in overweight (HR 3.59, 95% CI: 1.03–12.51, p = 0.044), as well as in obese, patients (HR 7.83, 95% CI: 2.20–27.83, p = 0.002). Among those found to have a malignant histology the 5-year DFS rates were 88.6% ± 3.5%, 75.2% ± 5.4%, and 76.2% ± 5.0% in normal weight, overweight, and obese patients, respectively (p = 0.012) (Fig. 4). Higher DR rates were recorded in obese (HR 2.76, 95% CI: 1.40–5.44, p = 0.003) but not in overweight patients (HR 1.68, 95% CI: 0.90–3.17, p = 0.106).
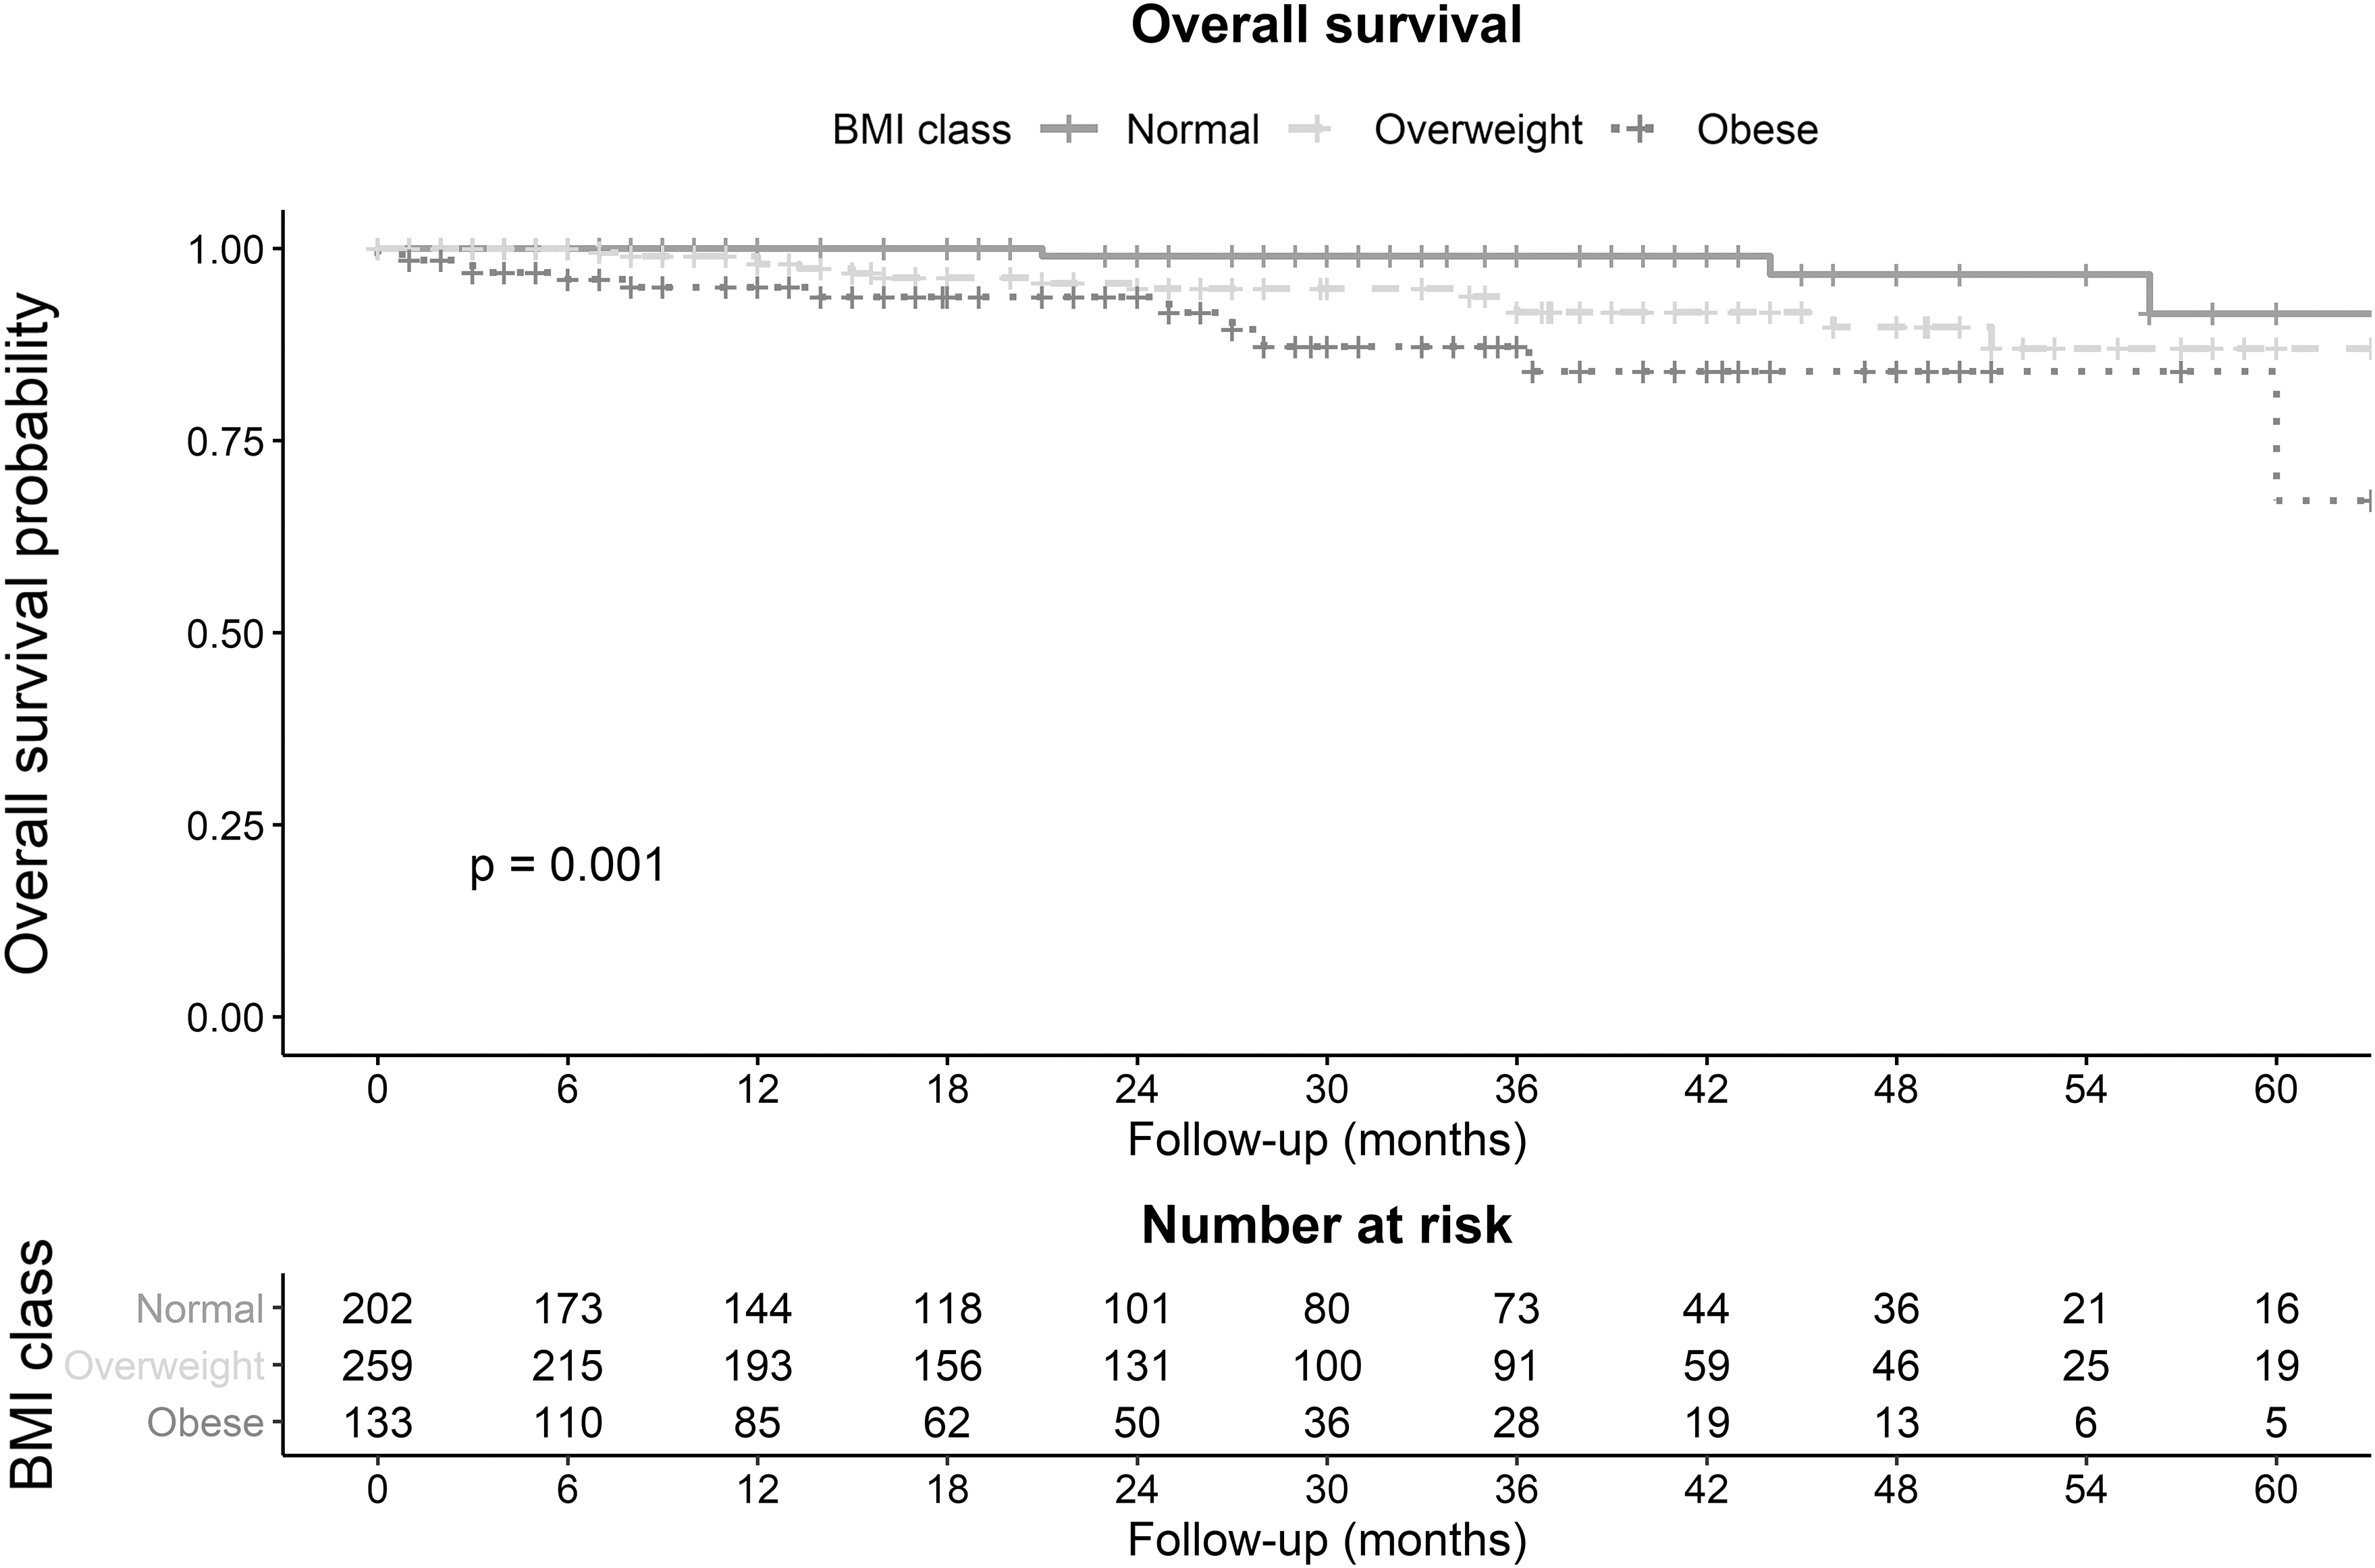
Kaplan–Meier curves depicting the overall survival overtime stratified according to the three body mass index groups (normal: solid line, overweight: dashed line, and obese: dotted line).
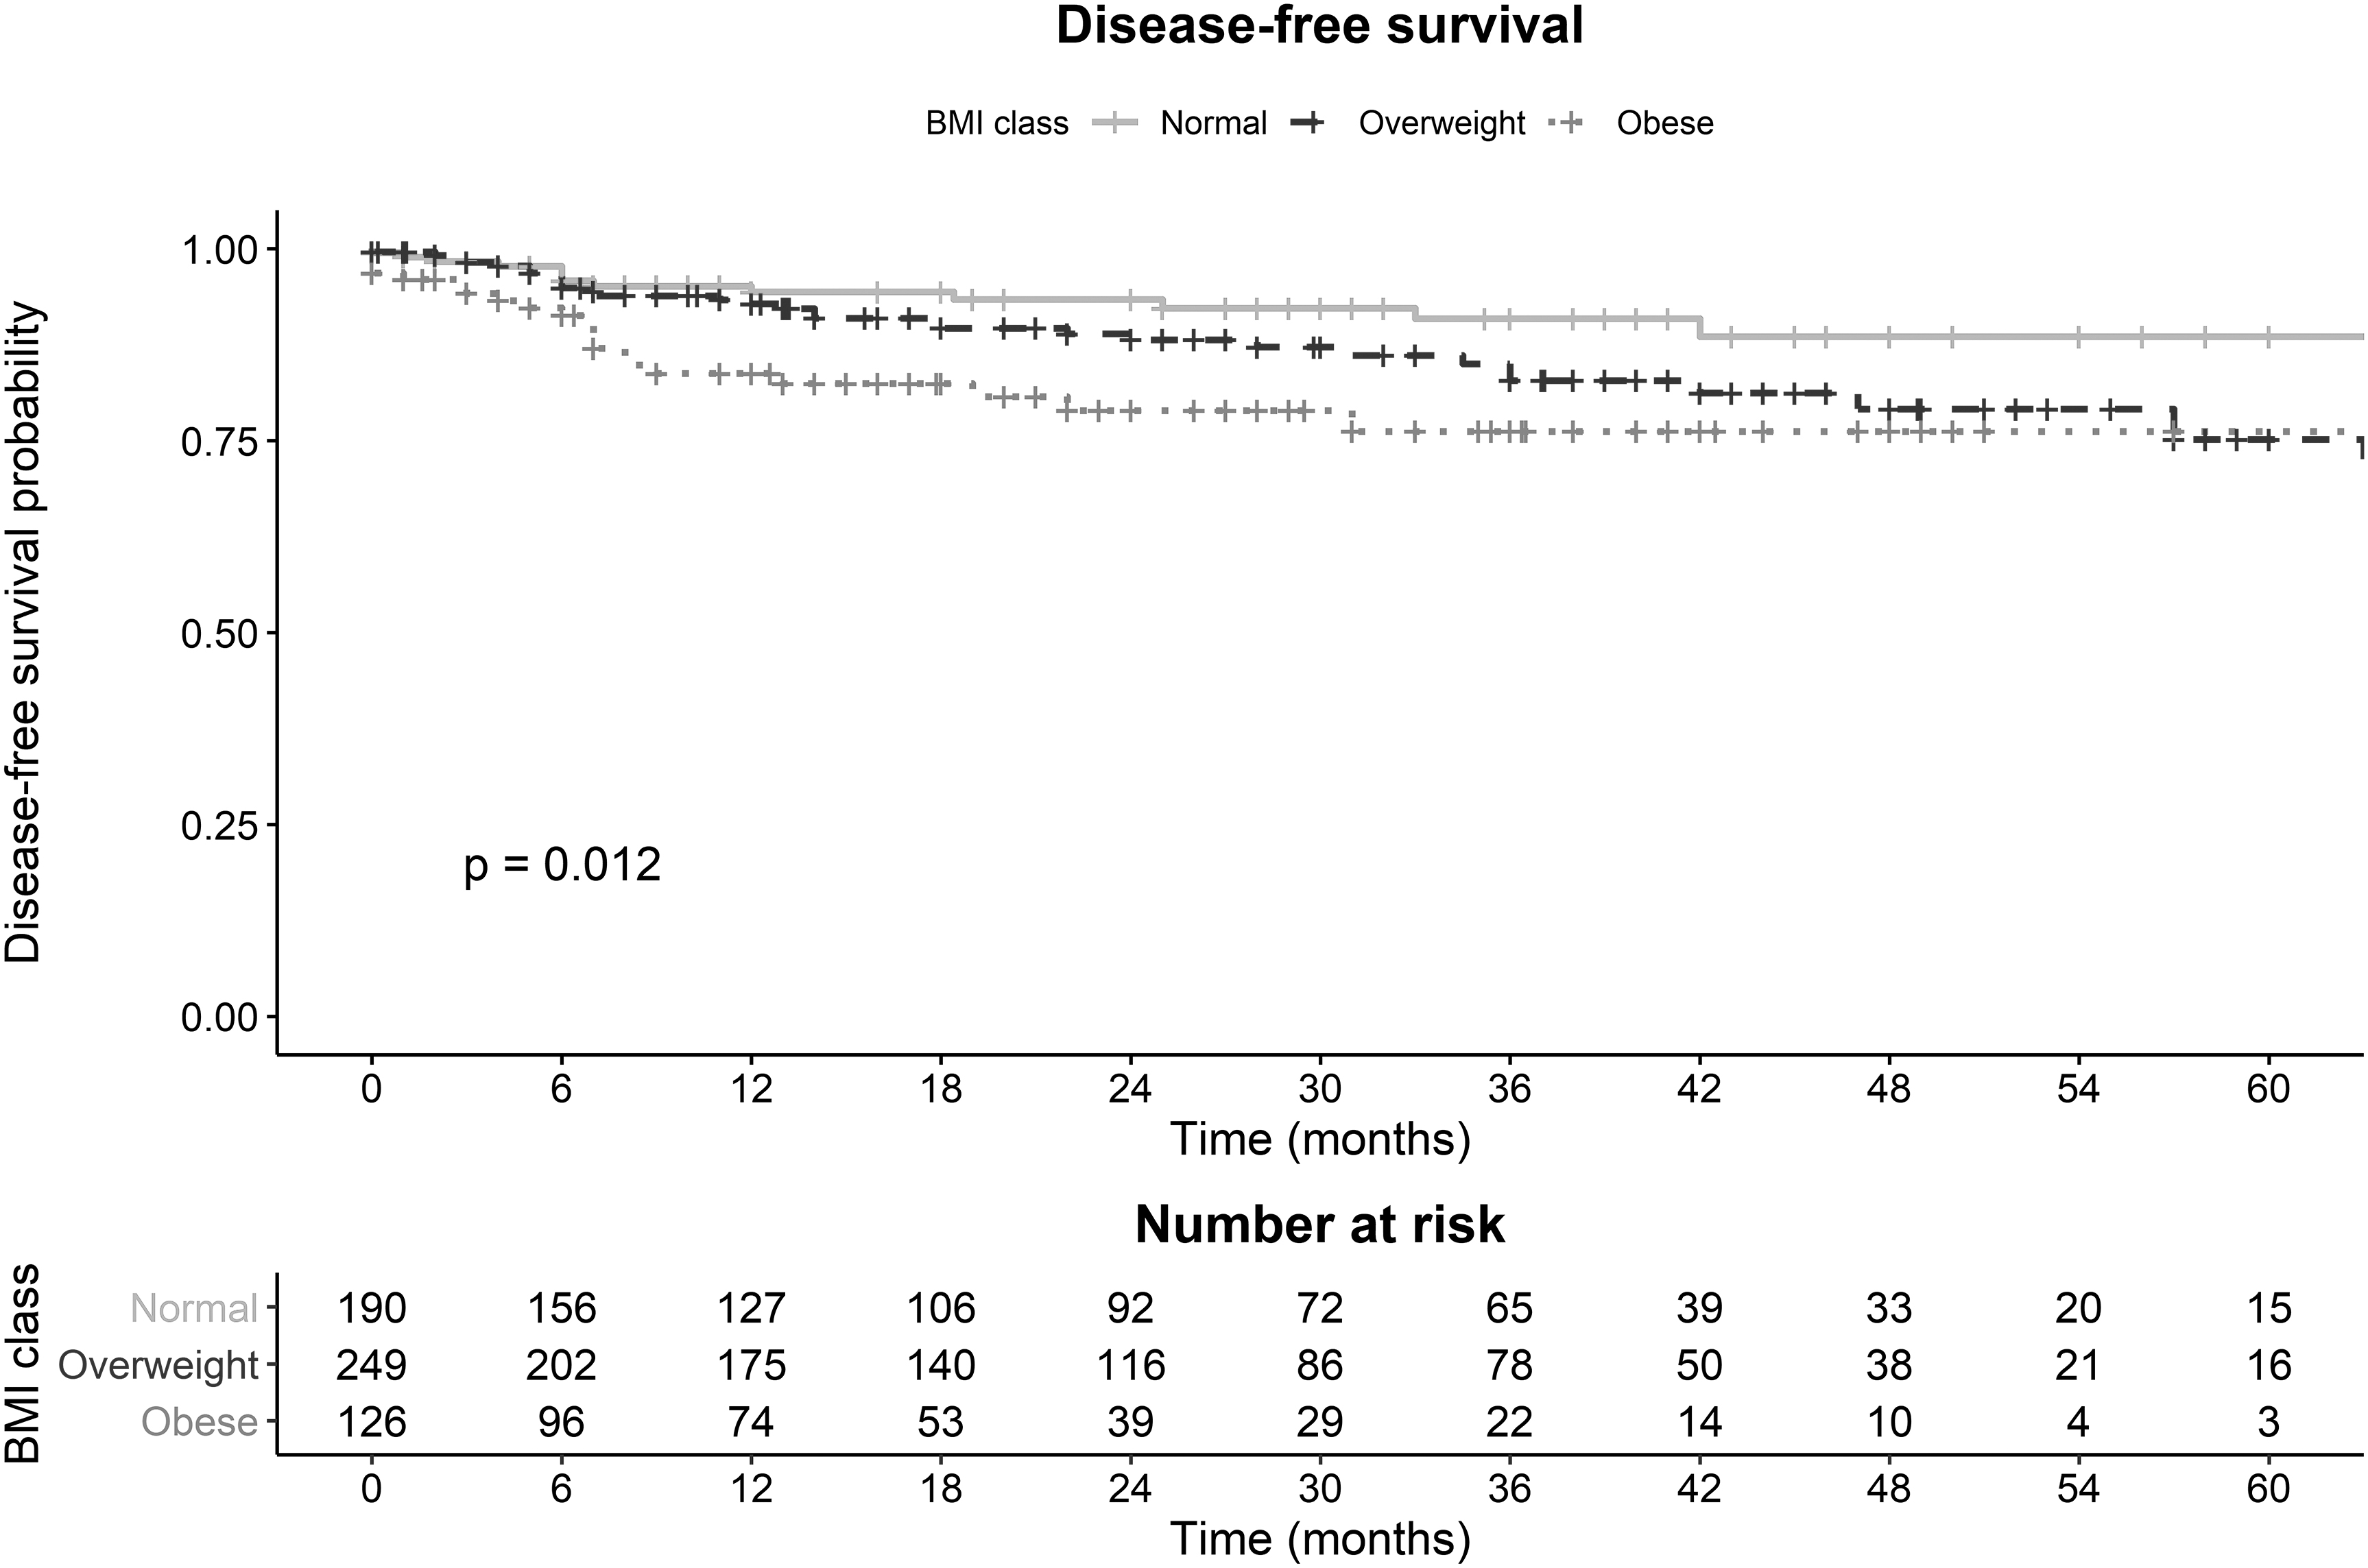
Kaplan–Meier curves depicting the disease-free survival overtime stratified according to the three body mass index groups (normal: solid line, overweight: dashed line, and obese: dotted line).
Discussion
We hypothesized that overweight and obese patients, found to have large renal masses, may experience worse outcomes after MIS compared to their normal weight counterpart. We tested these hypotheses in a large multicenter dataset, including large localized renal masses (
First, no statistically significant differences were shown in complication rates after MIS in obese and overweight patients. However, obese patients had longer operation time than normal weight, but similar blood loss, and even shorter length of stay. These findings are of interest from a clinical standpoint because they corroborate the safeness of MIS in obese patients with large renal masses. 10,11 Indeed, our analysis showed that only 3.3% of patients experienced major complications according to the Clavien-Dindo classification. Our results corroborate those of more historical analyses. 7,13 –15 Specifically, Sperling and colleagues investigated the effect of obesity on 30-day complication rates within the National Surgical Quality Improvement Project database. 13 Authors included more than 21,000 patients undergoing MIS. After multivariable adjustment, including comorbidity score, no statistically significant differences were shown in terms of any complication rates after renal MIS according to BMI. 13
Similarly, Rosen and coworkers relied on a multicenter dataset to review data about 2332 patients who underwent robotic partial nephrectomy. 7 Authors included patients with smaller renal masses compared to the current analyses (ranging between 2.7 and 3.0 cm). Authors showed an increased operative time in obese patients, but not higher complication rates. 7 Our results corroborate also those by Harris and colleagues that reported longer operation time in obese patients. 16 Taken together these findings, as well as ours, confirm the feasibility of MIS in higher BMI classes. However, ours is the first report to specifically test the hypothesis that BMI may have an effect on complication rates within patients with large renal masses. Our results showed that this may not be the case and that this surgery is safe also in obese patients; however, the recorded longer operation times may be the consequence of a more challenging procedure in those patients.
Furthermore, our analyses also showed no detrimental effect of overweight and obesity on renal function. These findings corroborated those of Rosen and coworkers, which also have shown no differences in eGFR decline per month according to the BMI categories after robotic partial nephrectomy, even if higher acute kidney injury rates were found in obese patients. 7 Taken together these findings suggest that overweight and obesity may be not the only factors associated with the detrimental effect of surgery seen in our, as well as in other, analyses. 17 Indeed, more important may be the percentage of healthy parenchyma left during partial nephrectomy and the effect of remaining kidney compensation 17 that could be impaired by the higher comorbidity burden in obese patients. However, in our multivariable models accounting for the ASA score, BMI categories were not the predictor of eGFR values after MIS.
In addition, overweight and obese patients experience higher OM rates than normal weight. Similarly, obese patients, but not overweight, had higher DR rates. Our findings corroborate those of previous analyses 18,19 but are in contrast with those showing a paradox effect of obesity on survival outcomes after kidney surgery. 20 However, results on this topic are conflicting; 21 indeed, a historical analysis by Schips and associates showed that obese patients had better OS and DFS, but not cancer specific survival, in univariable analyses. Nonetheless, after multivariable adjustment and patient stratification, this advantage was not statistically significant. 21 These considerations suggest that obesity may exert a role in combination with other factors. Several hypotheses were proposed to explain the obesity paradox in RCC patients, 20,22,23 and a nonlinear correlation between obesity and survivorship was observed. 22 In particular, findings from a recent meta-analysis suggested that cancer specific survival was higher among overweight and obese RCC patients, but the OS was higher in normal weight than overweight and obese patients. Interestingly, authors showed a reduction of OM risk for each BMI unit increase as much as a nadir of 25 kg/m2, whereas the OM risk increased for BMI values higher than the nadir. 22 Authors proposed several hypotheses to explain these conflicting results, including the correlation with more frequent health controls in obese patients. Moreover, they hypothesized that obesity and overweight could be associated with metabolic favorable conditions that prevent malnutrition disorders. 22 However, no conclusion can be drawn based on the current literature considering the high risk of selection bias in these analyses. 24,25 Moreover, BMI may be a suboptimal marker. Indeed other markers, such as visceral fat area, may be superior and less prone to be misinterpreted. 8
Several limitations apply to our study. First, its retrospective nature may be associated with selection bias and confounded by the presence of missing values among important covariates, such as positive surgical margins or eGFR at each time point. Furthermore, the multi-institutional nature of our dataset may represent also a limitation. Indeed, previous studies showed that the teaching institution status may affect complication rates. 6 In addition, within the same institute the different resident's involvement may also play a role. 6,26 Similarly, the hospital volume 27 may also have an effect on the examined outcomes. However, we relied on mixed models that accounted for the random effect of the belonging institute. We were not able to adjust for the effect of single surgeon experience, which may also influence measured outcomes. 28 Moreover, the effect of obesity could differ according to obesity classes. Unfortunately, we could not explore this hypothesis due to the limited number of patients within the highest obesity classes. In addition, the follow-up was relatively limited, and data maturity could be a concern. In consequence, we relied on univariable analyses when examining the survival outcomes. Thus, the observed detrimental effect could not be adjusted for the other confounders due to the limited number of events recorded. Moreover, we did not consider medication taken during the study period for conditions other than RCC. Finally, complication collection could be biased by the multicenter and retrospective nature of the study, although we relied on a standardized method for complications' reporting such as the Clavien Dindo.
Conclusion
Obese and overweight patients do not experience higher complication rates or worse eGFR after minimally invasive kidney surgery, which therefore can be deemed feasible and safe also in this subset of patients. Nevertheless, obese and overweight patients seem to carry a higher risk of OM, and therefore, they should undergo a strict follow-up after surgery.
Footnotes
Acknowledgment
Part of the results presented in the current article was presented during the Italian Urological Society national congress (Società Italiana di Urologia—SIU) as an abstract.
Author Disclosure Statement
No competing financial interests exist.
Funding Information
No funding was received for this article.