




Abstract
Purpose:
Stone burden has been reported as an independent predictor of stone-free rate after percutaneous nephrolithotomy (PCNL); however no consensus exists on a standardized method for measuring stone burden. Recently, stone volume has been advocated as the most accurate means of measuring stone burden. We aimed to compare different measuring methods of stone burden and to identify the predictive value of each for outcomes after PCNL.
Materials and Methods:
We performed a retrospective review of a prospective database of patients who underwent PCNL between 2006 and 2013. A preoperative CT and postoperative imaging at discharge were necessary for eligibility. Stone burden was assessed through four different ways on CT images: (1) cumulative stone diameter; (2) estimated SA (surface area) calculated as longest × orthogonal diameter × π/4; (3) manual outline of stone and computer SA calculation; and (4) automated 3D volume calculation using specific software. Primary outcome was stone-free status (SFS) at discharge. Secondary outcomes included operative time and the need for an ancillary procedure. Regression analysis and receiver operating characteristic curve analysis were used to evaluate the predictive value of each method.
Results:
Of 313 included patients, 69.6% were stone free at discharge. All measures of stone burden were independent predictors of SFS [OR and 95% CI of 1.027 (1.014, 1.040), 1.481 (1.180, 1.858), 1.736 (1.266, 2.380), and 1.311 (1.127, 1.526), respectively] and demonstrated similar predictive accuracy (area under the curve = 0.630, 0.630, 0.627, and 0.638, respectively). Stone burden by any measure was an independent predictor of operative time and secondary procedure.
Conclusions:
We demonstrated that measuring stone burden by manual outline or automated 3D volume on reformatted CT images had no added value compared with orthogonal measurement for predicting outcomes after PCNL.
Introduction
With an increasing prevalence and now affecting up to 9% of the population as of 2010, 1 nephrolithiasis remains a major source of morbidity and health care expenditure. 2
Given the various management options available in the treatment of nephrolithiasis, many patient- and stone-related variables need to be considered in routine preoperative assessment to ensure that patients are counseled on the appropriate treatment modality and on realistic expected outcomes.
When using urolithiasis clinical practice guidelines, predictive scoring systems, or nomograms, endourologists consider certain treatment options based on the stone burden to be treated and the stone location. 3 –6 For the management of large or complex renal stones, percutaneous nephrolithotomy (PCNL) is still considered the primary treatment modality according to the EAU and AUA guidelines. 3,4 Interestingly, although surface area (SA) and stone volume are considered more accurate measures of stone burden, a review of available guidelines demonstrates that cumulative stone diameter (CSD) or stone length is still used by most to direct treatment. 7,8 Despite the consistency among guidelines, Hyams and colleagues highlighted that there is marked heterogeneity in the types of imaging modalities used and the methods for measuring and reporting stone burden in the published literature. 9 Similar to standardization of outcomes reporting, the published literature would benefit from standardization of reporting preoperative variables as well. 10
Due to its superior sensitivity, as well as the added ability to characterize stone location, volume, and density/composition, noncontrast CT (NCCT) is considered the gold standard in the preoperative imaging assessment of nephrolithiasis. 8 Several reports have emerged, demonstrating that automated stone volume measurement on NCCT is a fast, reliable, readily available, and inexpensive method for stone burden assessment, reducing potential inter-rater variability of manual measurements. 8,11,12 As such, stone volume has recently been advocated as the gold standard for reporting stone burden. 13,14 Although automated stone volume assessment provides a more accurate measure of stone burden than one- or two-dimensional measures, 8 it is still unclear whether it can better predict patient important outcomes such as stone-free rate after surgery. Previous investigations examining the predictive accuracy of different methods of stone measurement have not consistently demonstrated the superior predictive value of stone volume. 15 –19
The aim of this work was to compare the most commonly used stone burden measures in an effort to identify the most accurate predictor of stone-free rate after PCNL.
Materials and Methods
Institutional Review Board approval was obtained from Western University (103440) and Lawson Health Research Institute (R-13-056). We performed a retrospective chart review of a prospective database of patients having undergone PCNL between January 2006 and December 2013 at our academic health care center. Patients with an available preoperative CT, not >6 months before the procedure, and who had postoperative imaging before discharge were included in the study. Only primary PCNL procedures were included in this study. Secondary procedures for treatment of residual fragments after the initial procedure were excluded from this analysis. All procedures were performed in a single academic referral center by experienced, fellowship-trained endourologists according to the previously described technique. 20
Measurements
All preoperative CT examinations were performed on a GE Discovery HD750 scanner (GE Healthcare, Waukesha, WI) and acquired helically in 1.25 mm slices using 120 kV voltage with an auto milliampere function. Stone measurements were performed by a single radiologist (B.R.N.), blinded to the results of the procedure, on source images archived to an AW VolumeShare 5 workstation (GE Healthcare). Stone burden was quantified for all patients on coronal images with magnified bone windows
21
using four different techniques: CSD, cumulating the longest diameters of all stones treated. Postprocessing slice thickness was increased to display the entire stone volume on a single image, ensuring that the largest possible diameter and SA were measured for methods 1, 2, and 3. Estimation of SA (estimated SA) using an ellipse formula (longest diameter × orthogonal diameter × π/4), where stone diameters were measured with digital calipers (Fig. 1A). Manual measurement of SA (measured SA) using digital free-hand calipers to trace the stone outline (Fig. 1B). Stone volume was measured with an automated software package (GE Healthcare) using a HU attenuation-based threshold method. Each set of images was subsequently reviewed to ensure that the measured volume accurately corresponded to the calculus and did not include surrounding renal parenchyma (Fig. 1C).
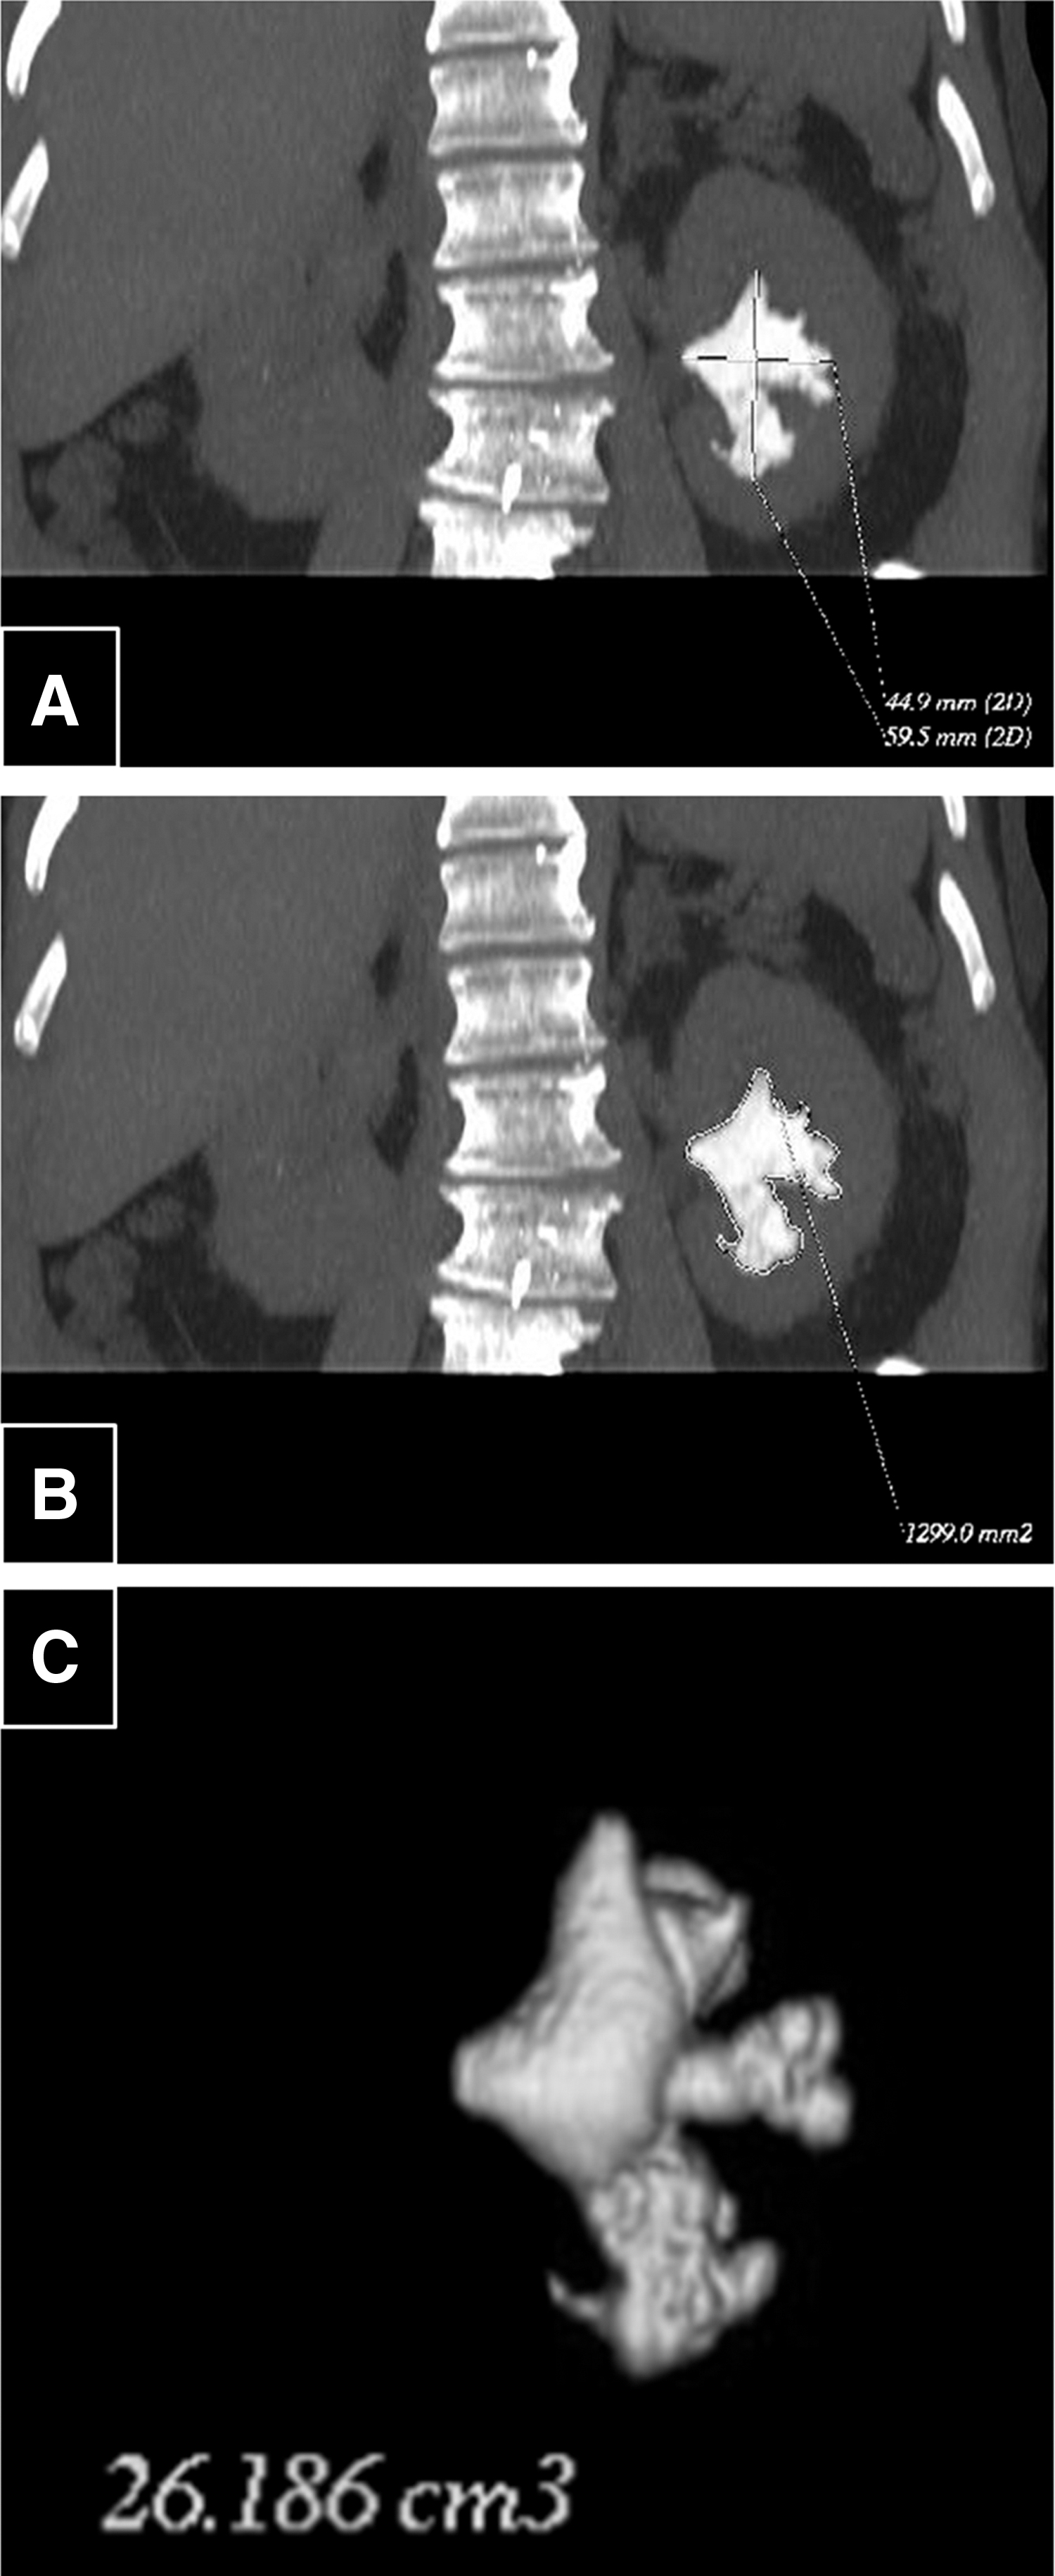
Postprocedure imaging for detection of residual calculi was performed using various techniques based on surgeon preference. These included kidneys, ureters, and bladder radiographs (KUBs) in conjunction with renal ultrasound or unenhanced CT. Stone-free status (SFS) was defined as a complete absence of stone on postoperative imaging.
Demographic and perioperative data
Preoperative data collected included patient-specific variables such as age, gender, and BMI. Stone-specific variables included SA (both estimated and manual measurements) in mm2, volume in cm3, location, number of stones, average HU density, staghorn morphology, and pre-existing urinary tract abnormality, defined as previously described. 22
Outcomes
Our primary outcome was SFS as documented by CT or KUB with renal ultrasound performed before discharge and at first imaging follow-up within 3 months postprocedure. SFS was defined by absence of residual stone or presence of clinically insignificant residual fragments (CIRF) using a cutoff value of <5 mm. This cutoff value was used as data were collected before a proposition of standardized reporting for postoperative variables with a 4 mm cutoff for CIRF. 10 Secondary outcome parameters included operative time and need for secondary procedure.
Statistical analysis
Continuous and categorical variables were compared with t-test and chi-squared or Fisher's exact test as appropriate between stone-free and not stone-free patients. Between-group comparison with adjusted p-value according to Holm was performed where necessary. 23 Paired sample t-test was performed to compare the different measurement methods. Where Levene's test for equality of variance showed heteroskedasticity, a Welch's t-test was used instead of a regular t-test. All analyses were performed using SPSS version 25.0 (IBM Corp., Armonk, NY).
To assess predictability of our primary and secondary outcomes, we performed univariable and multivariable logistic and linear regression analyses. A backward multivariable regression model was used to assess each parameter of stone burden against a predefined set of variables, including urinary tract abnormalities, number of stones treated, stone location, staghorn morphology, and average HU density. Predictive accuracy of each of the measurement methods was assessed using receiver operating characteristic (ROC) analysis and area under the curve (AUC) calculation.
Results
A total of 406 patients were identified having undergone a single prone PCNL procedure with an available preoperative CT. From those, 313 patients had a CT performed <6 months before treatment as well as immediate postoperative imaging to assess SFS at discharge. Approximately one-third of our cohort (94/313) had a noncontrast CT performed before discharge.
Our cohort was 59% male, with an average age of 55.7 years and a BMI of 31.1. Preoperative parameters were compared between the stone-free and not stone-free groups, and are demonstrated in Table 1. Stone burden, staghorn morphology, and stone location were found to be significantly different in the stone-free cohort compared with the not stone-free cohort. On post hoc analysis, full staghorn stones have a significantly lower stone-free rate compared with nonstaghorn stones (p = 0.0126), whereas none of the other post hoc analyses showed statistical significance. The respective mean ± standard deviation values for CSD, estimated SA, measured SA, and 3D volume in the stone-free and not stone-free cohort were 39 ± 18 mm vs 49 ± 22 mm, 583.0 ± 467.6 mm2 vs 821.1 ± 664.1 mm2 (p = 0.002), 497.9 ± 342.4 vs 683.9 ± 506.3 mm2 (p = 0.001), and 8.21 ± 6.96 vs 12.35 ± 11.92 cm3 (p = 0.002).
Preoperative Patient Demographics, Stone Variables, and Postoperative Variables
Boldface values <0.05 indicate statistical significance.
Means ± standard deviations where appropriate.
Welch's t-test.
Fisher's exact.
BMI = body mass index; HU = Hounsfield unit; SA = surface area.
A paired t-test analysis was performed to compare the estimated and measured SA values against each other (Table 2). Overall, the estimated SA was found to be significantly larger than the measured SA on reformatted CT images (655.3 ± 545 mm2 vs 554.3 ± 407.6 mm2) (p = 0.004). With increasing stone complexity from simple to staghorn formation and with increasing stone size (Fig. 2), there appears to be a larger difference between estimated and measured SA, with a 30.9% difference for staghorn stones.
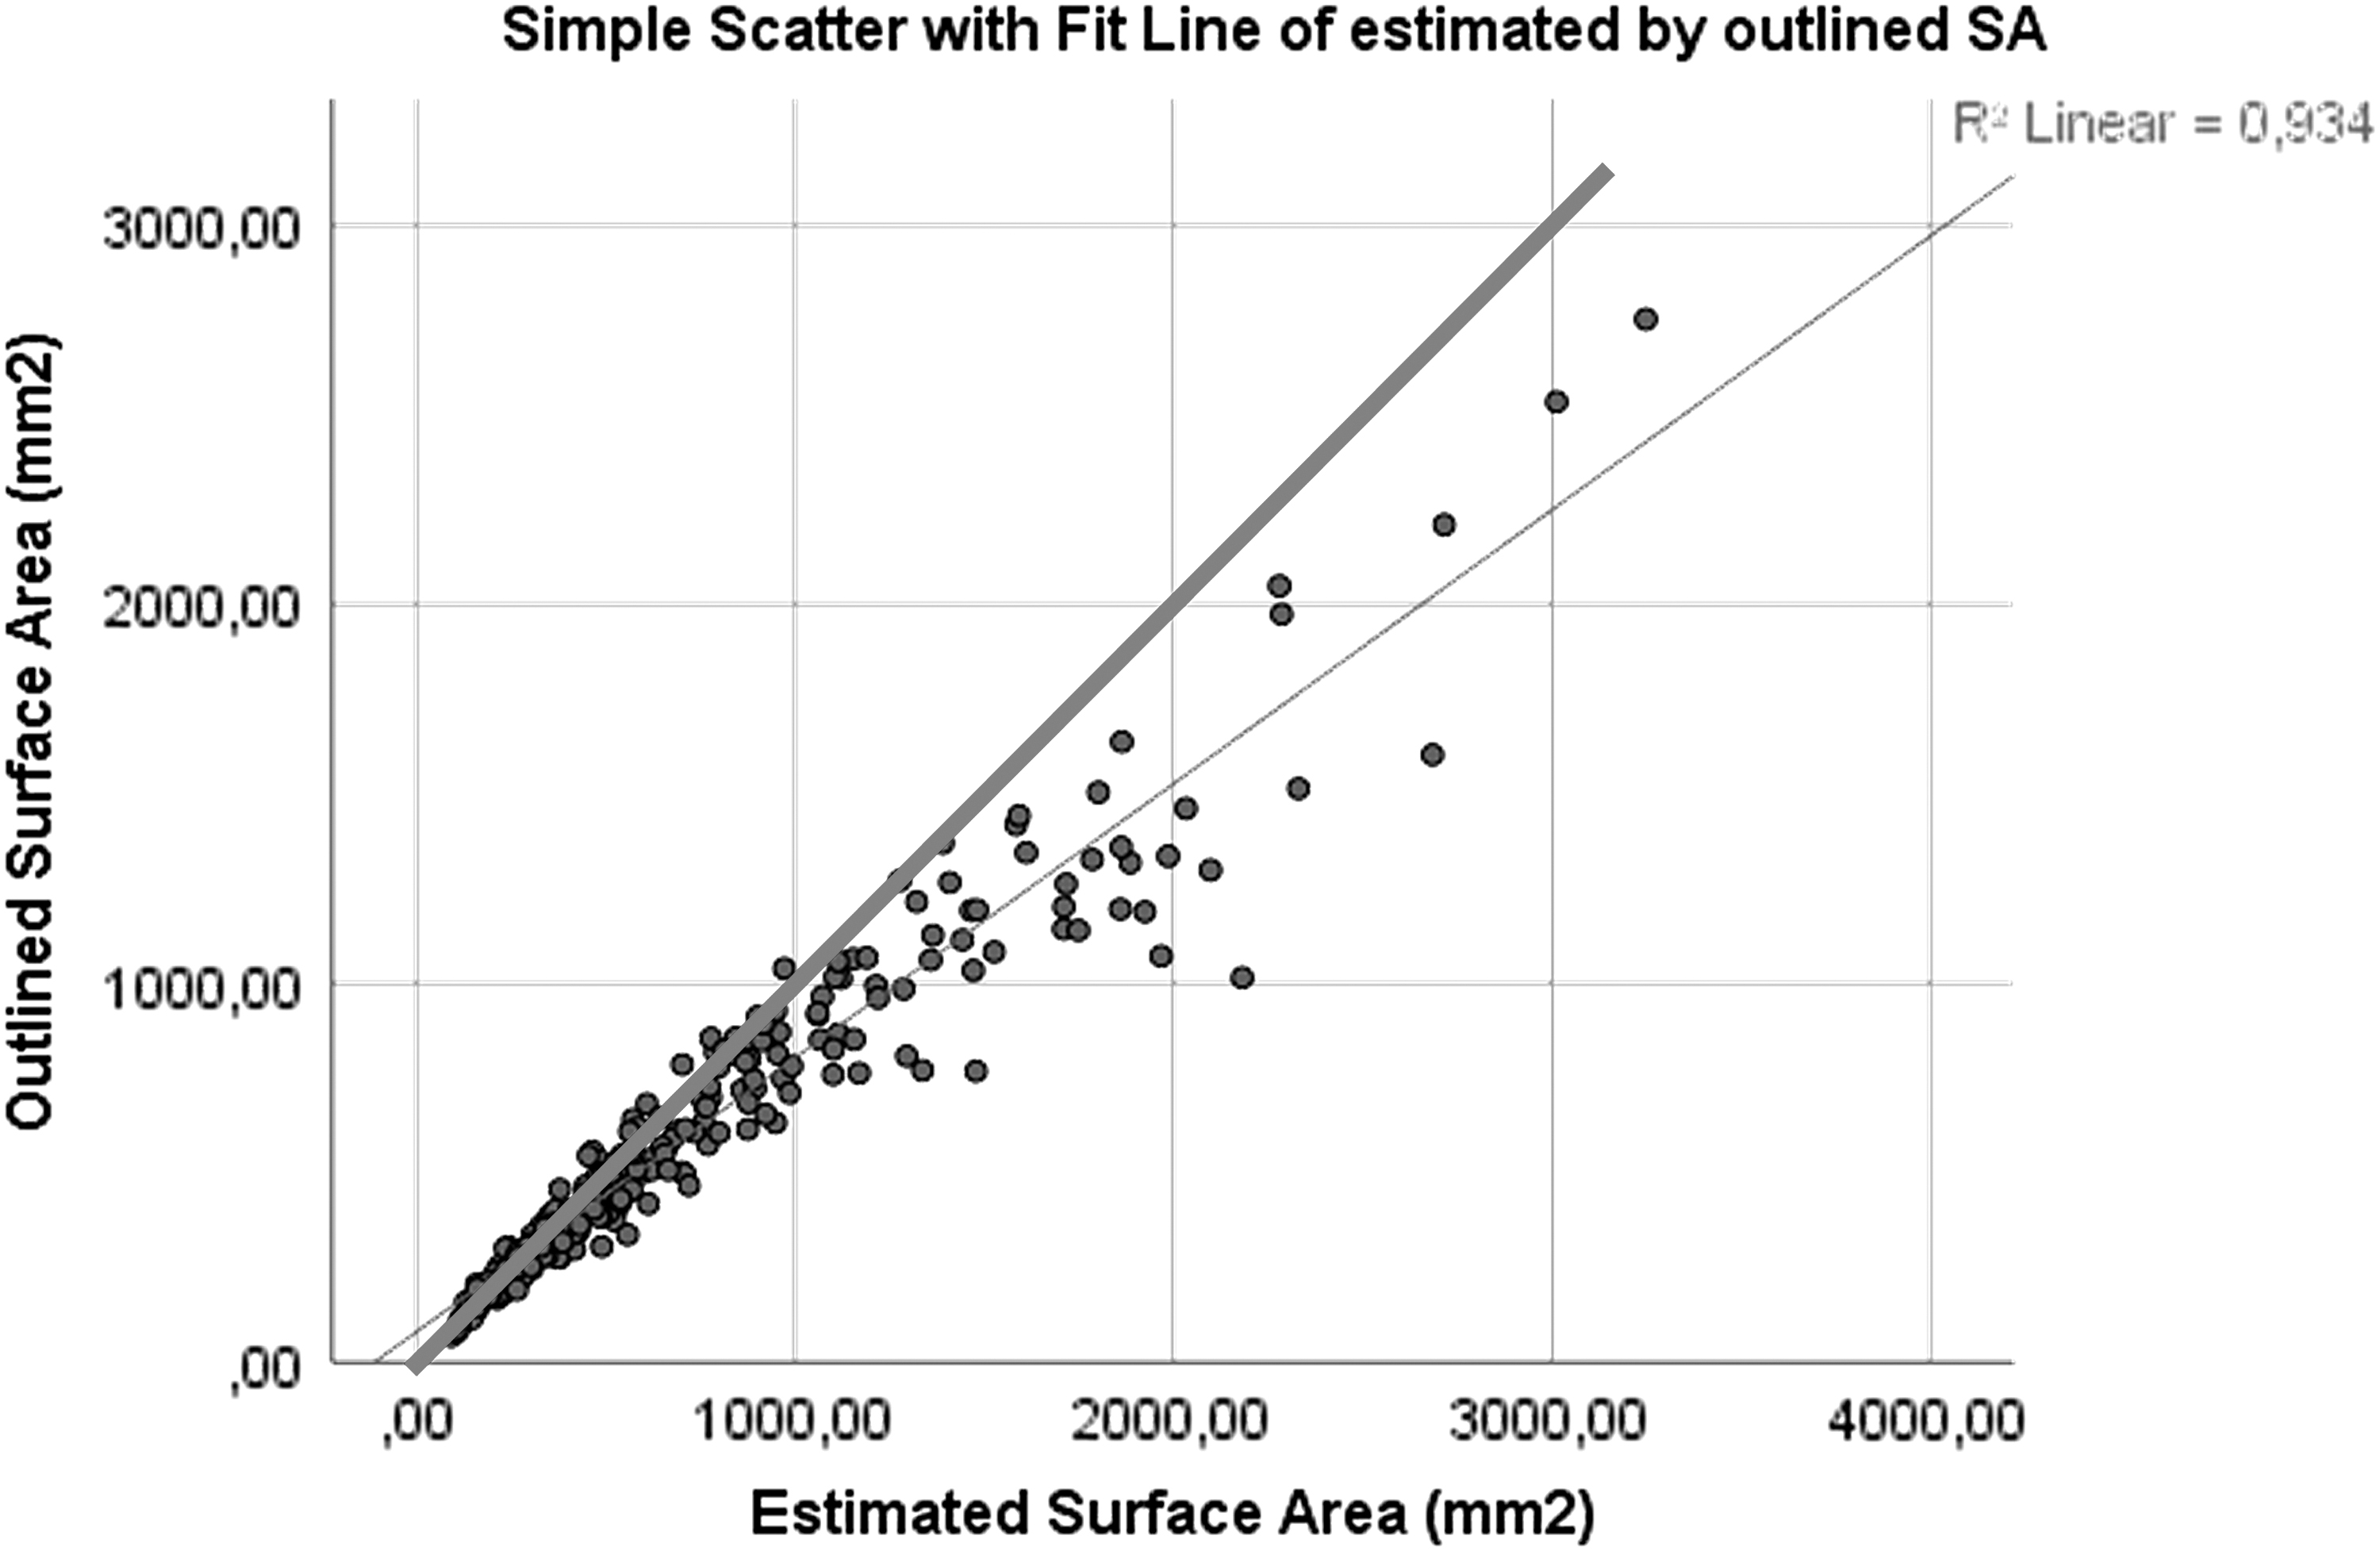
Scatter plot of estimated vs measured SA. The fit line deviates from the 1/1 line, demonstrating that with increased size, there is increased overestimation with the estimated SA.
Comparison of Estimated Surface Area vs Measured Surface Area for All Stones and Subdivided by Simple, Partial Staghorn, and Full Staghorn Stone with p-Values from Paired Sample t-Test
Means ± standard deviations.
Univariable logistic regression analyses demonstrated that all four measures of stone burden were predictors of SFS at discharge. When subjected to a subsequent multivariable analysis against a predetermined set of stone- and patient-specific variables, including number of stones, stone location, staghorn morphometry, American Society of Anesthesiologists (ASA) score, HU and urinary tract abnormality, all measures of stone burden appear to be independent predictors of SFS at discharge (CSD per mm: OR 1.027, 95% CI: 1.014, 1.040, p < 0.001; estimated SA per 500 mm2: OR 1.481, 95% CI: 1.180, 1.858, p = 0.001; measured SA per 500 mm2: OR: 1.736, 95% CI: 1.266, 2.380, p = 0.001; volume per 5 cm3: OR: 1.311, 95% CI: 1.127, 1.526, p < 0.001) (Table 3).
Multivariate Logistic Regression for Stone Free at Discharge, Accounting for a Measure of Stone Burden, Number of Stones, Location of Stone, Staghorn Formation, Average Hounsfield Units, Urinary Tract Abnormality, and American Society of Anesthesiologists
CSD per mm, estimated DA per 500 mm2, measured SA per 500 mm2, volume per 5 cm3.
CI = confidence interval; CSD = cumulative stone diameter; SA = surface area; OR = odds ratio.
ROC curve analysis for SFS at discharge revealed strikingly similar AUC values for CSD, estimated SA, measured SA, and volume (AUC = 0.630, 0.630, 0.627, and 0.638, respectively) (Fig. 3). Comparison of AUC according to Hanley and McNeil did not show any statistically significant difference. 24
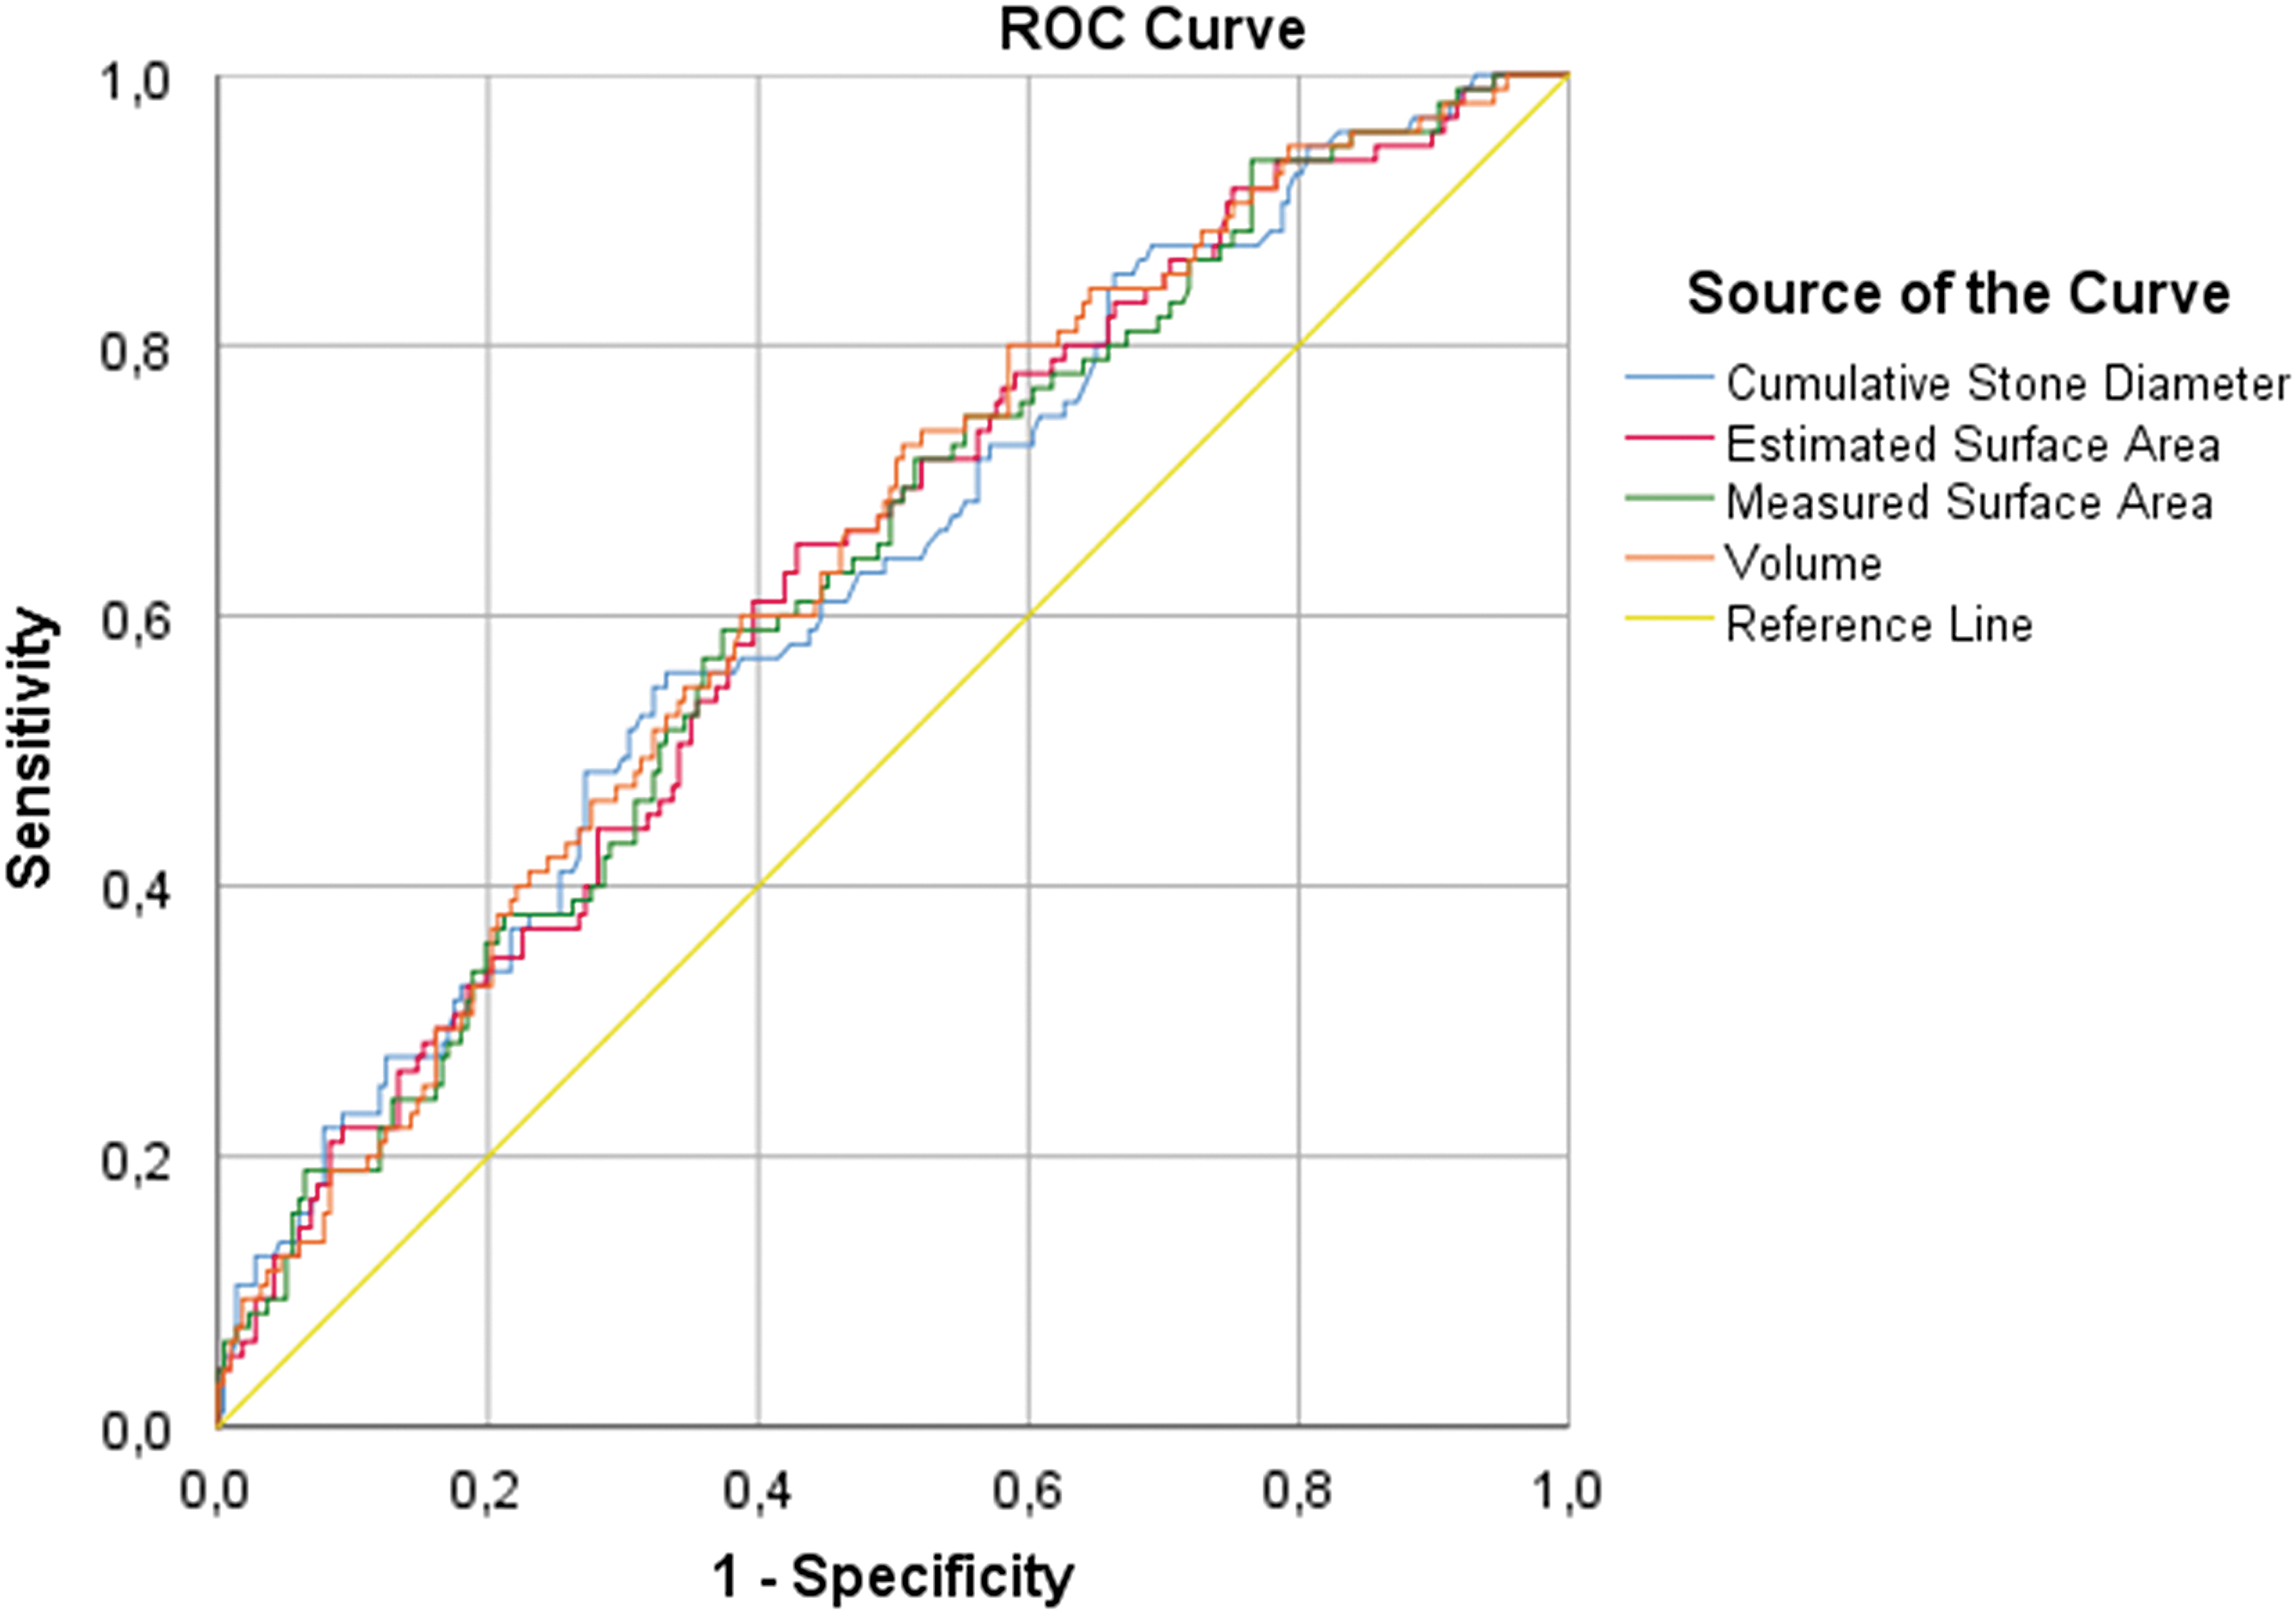
ROC curve analysis for stone free at discharge. ROC = receiver operating characteristic.
Regression analyses were similarly performed for all four measurement methods toward our secondary outcomes. On multivariate analysis, stone burden by any measure appears to be an independent variable influencing OR time (Table 4). Similarly, all measures of stone burden are strong independent predictors of the need for a secondary procedure (Table 5). All measures of stone burden appear to have near identical accuracy in predicting the need for secondary procedure (AUC = 0.773, 0.764, 0.756, and 0.744, respectively) (Fig. 4).

ROC curve analysis for secondary procedure.
Multivariate Linear Regression for Operative Time
Variables inserted include stone burden measurement, staghorn formation, number of stones, urinary tract abnormality, and Avg HU.
Multivariate Logistic Regression for Secondary Procedure
Variables inserted include stone burden measurement, staghorn formation, number of stones, urinary tract abnormality, Avg HU, and ASA.
ASA = American Society of Anesthesiologists.
Discussion
As expected, all measures of stone burden were predictive of the primary outcome, SFS, after PCNL. Despite the increased accuracy of measuring the true stone burden, the predictive accuracy was not significantly different between CSD, estimated SA, measured SA, and stone volume.
Although predictive nomograms employ the estimated SA, which is easier to obtain, the measured SA is likely a more accurate measure of stone burden. 5,6 When comparing the measured with the estimated SA from the stones in our cohort, it seems that with increasing stone complexity, the estimated SA increasingly overestimates the measured SA.
In multivariate analysis, measured SA and volume emerged as the only predictors of operative time. Stone complexity was only retained as a predictor of OR time in the model with CSD, the least accurate measure of stone burden. The overestimation with the estimated SA may be accounted for by the shape complexity of staghorn stones and may explain why complexity is not retained as a predictor in this model. Per every 500 mm2 increase of measured SA, the OR time increased by 18.6 minutes, whereas OR time only increased by 13.8 minutes per every 500 mm2 of estimated SA.
Only few reports have compared different stone measures for outcomes after stone management. 15 –19 Jendeberg et al. demonstrated only limited difference in the predictive value and accuracy of different measures of stone burden, including length and automated SA and volume. 15 In this study however, the stones measured were considerably smaller as they targeted ureteral stones and aimed to predict spontaneous passage. The authors advocated consistency in reporting, and highlighted that for smaller stones, stone volume may be an unnecessarily complicated way of reporting stone burden. 15
When comparing different measures of stone burden to predict success after extracorporeal shockwave lithotripsy (SWL) for renal stones, Bandi et al. demonstrated that stone volume was a strong predictor of success on univariate analysis, whereas maximum stone length on any CT plane was not. 16 They suggested routinely measuring and reporting stone volume derived from NCCT images before SWL treatment.
Both Ito et al. and Merigot de Treigny et al. compared the CSD with stone volume in patients undergoing ureteroscopy. 17,18 For larger stones, measuring >20 mm in CSD, they advocated using volume as a more accurate predictor of success after ureteroscopy (URS). 17,18 For smaller stones however, both groups demonstrated that CSD is as predictive of success as stone volume. When performing the same subgroup analyses on our patient cohort, we could not identify a difference in predictive accuracy between the different measures for a stone burden of >20 mm CSD. For smaller stones, none of the stone burden measures were an independent predictor of success. This is most likely a statistical issue, due to the small cohort of patients with stones <20 mm CSD (35) and the low number of patients with residual fragments (4/35). For larger stones, all models retained the measure of stone burden as an independent predictor of SFS.
Similar to measuring stone volume as a predictor of success, Atalay and colleagues calculated the ratio of stone volume to collecting system volume, thereby defining a new variable for stone burden assessment and for predicting success after PCNL. 19 In a multivariate analysis, all measures of stone burden, including CSD, calculated SA, and measured SA, appeared to be significant predictors of success. As the different measures were not compared with each other in different analysis models or with ROC curve analysis, superiority of one measure over another could not be assessed.
It appears that for predicting stone-free rate after PCNL, any of the currently available stone burden measurements can be used. For predicting operative time however, stone volume and measured SA can be considered more accurate predictors as no other variables were retained in our regression models. Although the number of stones and ASA scores appeared to have additional value in predicting the need for a secondary procedure, ROC curve analysis demonstrated all measures of stone burden to have similar accuracy in predicting this outcome.
Our retrospective review of this prospective database was limited by the lack of a standardized postoperative imaging protocol at our center. As such, the patients in our cohort were assessed for residual stones with either NCCT or a combination of KUB and ultrasound. Given the decreased sensitivity of plain film radiography and ultrasound compared with NCCT, 25 this could potentially affect our detection of small residual fragments in some patients. In fact, we recently identified that the stone-free rate has decreased, while the use of NCCT for follow-up imaging has increased over time in our center. 26 Further analysis demonstrated patients with stones with lower HU density to be more likely to get CT imaging postoperatively (NCCT group: 798 ± 368 HU vs non-CT group: 912 ± 350 HU, p = 0.01). To assess whether the imaging modality would impact our results, repeat analysis was performed and compared between the patients receiving a CT or other postoperative imaging. Interestingly, the AUC calculations were not significantly different between the NCCT and the non-CT groups (Table 6).
Comparison of Area Under the Curve Values for Stone Free at Discharge
Although we had expected a more accurate representation of stone burden to be a more accurate predictor of SFS post-PCNL, our statistical analysis indicated otherwise. As superiority could not be established for stone volume assessment, using the easiest obtainable measure of stone burden would seem adequate for stone burden assessment and reporting. However, the decision to treat a patient with SWL, URS, or PCNL is usually made after obtaining all the necessary information, including stone burden. As stone volume is a measure that can be obtained easily, accurately, reproducibly and has been shown to be a better predictor of success for larger stones when performing URS, it would still seem useful to report stone volume additional to any other measure of stone burden. 8,17,18 In addition, 3D reformatting of CT images can provide valuable information for PCNL planning. 27,28 Further research into the use of volumetric techniques for preoperative imaging in PCNL patients may therefore uncover other potential benefits for predicting/improving treatment outcomes.
Conclusions
PCNL is an effective procedure with a high stone-free rate. While measured SA and automated 3D stone volume are strong predictors of treatment outcomes, our results indicate that these advanced techniques provide no added value compared with simple manual measurements of stone burden with respect to SFS.
Footnotes
Author Disclosure Statement
No competing financial interests exist.
Funding Information
No funding was received for this article.