
Abstract
Background:
White light imaging (WLI) cystoscopy, a “gold standard” for diagnosis of nonmuscle invasive bladder cancer (NMIBC), can miss ∼25% of bladder cancers. Spectra A (SA) and Spectra B (SB) are virtual optical chromoendoscopy modes introduced by Storz.
Objective:
To evaluate whether SA and SB improve over WLI in diagnosis of NMIBC.
Design, Setting, and Participants:
Storz Professional Image Enhancement System (SPIES) modes allow side-by-side viewing of WLI and spectra images. Cystoscopy images of some patients with suspected NMIBC and some normal cystoscopy findings were cut in two parts: one WLI and the other SA or SB. Each individual image was sent to the 3721 members of Urological Society of India separately through online survey. Histologic diagnosis was considered final diagnosis.
Intervention:
The observers were asked whether they considered the image to be cancer; yes, no, or cannot say were the three response options.
Outcome Measures and Statistical Analysis:
Primary outcome measure was improved diagnosis of NMIBC. Diagnostic efficacy was analyzed through 2 × 2 tables, McNemar test, and Fleiss Kappa.
Results and Limitations:
A total of 273 observers participated in the study. The sensitivities of WLI, SA, and SB were 89.81, 91.15, and 88.81, respectively. The specificities were 73.18, 66.17, and 68.68, respectively. In patients with cancer, both SA and SB improved the diagnostic efficacy of WLI. SA added significantly to the diagnostic accuracy over WLI (χ2 = 12.23, p = 0.00046). SB also added significantly over WLI (χ2 = 11.76, p = 0.0006). With increasing cancer grade, the sensitivity and negative predictive value of all modes increased. The major limitation of this study is the online diagnosis based on still images.
Conclusions:
In patients with cancer, SA and SB significantly add to the diagnostic accuracy of WLI. As compared with the negative WLI, if SA and SB are negative, NMIBC would be less likely.
Introduction
White light imaging (WLI) cystoscopy is the mainstay in the diagnosis of nonmuscle invasive bladder cancer (NMIBC). Although it is said to be “the gold standard,” 1,2 it can miss ∼25% of the bladder tumors, 3 and also can miss changes such as dysplasia and carcinoma in situ (CIS). 4 To improve the diagnosis of suspicious bladder lesions, narrow band imaging (NBI) and photodynamic diagnosis (PDD) are the commonly used macroscopic optical enhancements. 2
Storz has introduced an image enhancement system called SPIES (Storz Professional Image Enhancement System). The term SPIES is currently replaced by image 1S. In this study, in addition to WLI, there are four different enhancements: Clara, Chroma, Spectra A (SA) and Spectra B (SB). 5 These digital enhancements do not need any special light source filters or telescopes. SA and SB are “virtual chromoendoscopy” modes because no photosensitizing agent is used. 6 In SA, there is improved observation of the vessels in the superficial mucosa and submucosa. 6 In the SB mode in addition to the vessels in superficial mucosa and submucosa, deeper tissue layers are also visible. 6 The literature is scant about the exact place of these modes, and the actual recommendation on the use of these modes is unclear. 7
Aims (research questions)
Primary objective
Whether SA and SB modes improve over WLI cystoscopy in diagnosis of bladder lesions suspected as NMIBC?
Secondary objectives
Do SA and SB add more value to WLI by decreasing the interobserver disagreement? Does the level of training of the observer has any bearing on the ease of diagnosis provided by SA and SB? Does grade of the tumor have any bearing on the ease of diagnosis provided by SA and SB?
Methodology and Study Design
This study involved web-based survey of cystoscopy images of suspicious bladder lesions (Fig. 1). All cystoscopies were performed in operating room by a single surgeon (P.M.) with rigid cystoscope on StorzSPIES camera (IMAGE1CONNECT [TC200] and IMAGE1H3-Link [TC300]; KarlStorz, Tuttlingen, Germany). SPIES modes allow side-by-side viewing of WLI and spectra images (SA and SB in Fig. 2). Images were stored on a pen drive. Images from patients with suspected or known urothelial carcinoma of urinary bladder with current or historical proof of presence or absence of cancer were included. All the slides were seen by the single histopathologist (P.G.). In addition, some patients with normal cystoscopy findings were included to prevent the study population being skewed. These were taken from patients who had undergone diagnostic cystoscopy for recurrent urinary infections, nonvisible hematuria, or obstructive and irritative lower urinary symptoms. These patients were not biopsied. Patients who have received intravesical bacille Calmette-Guerin in the past or patients with known invasive bladder cancer were not included in this study.
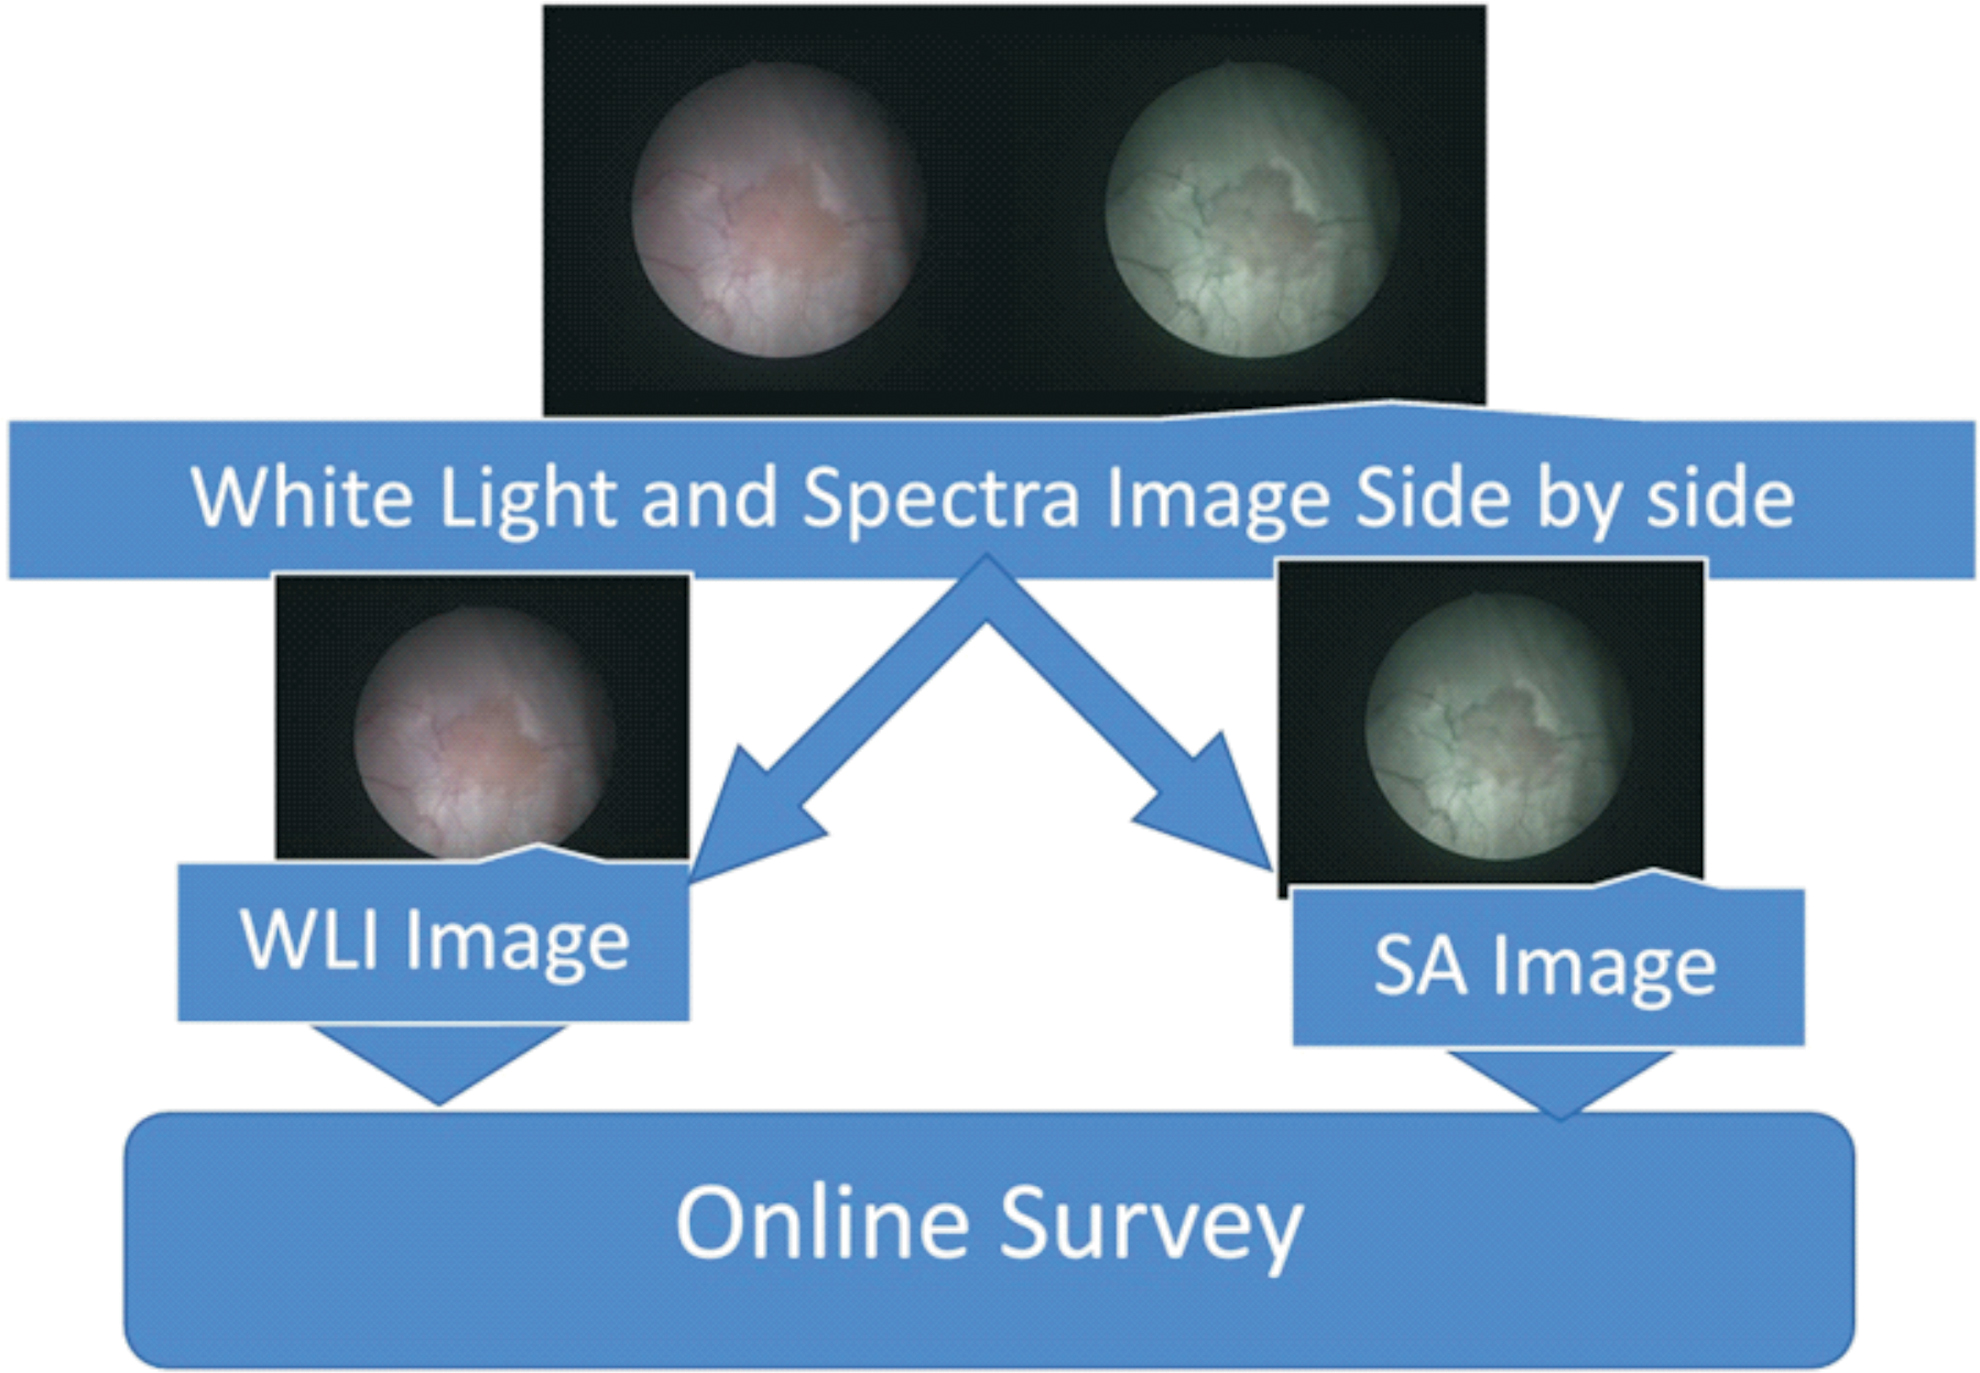
Study design. Color images are available online.
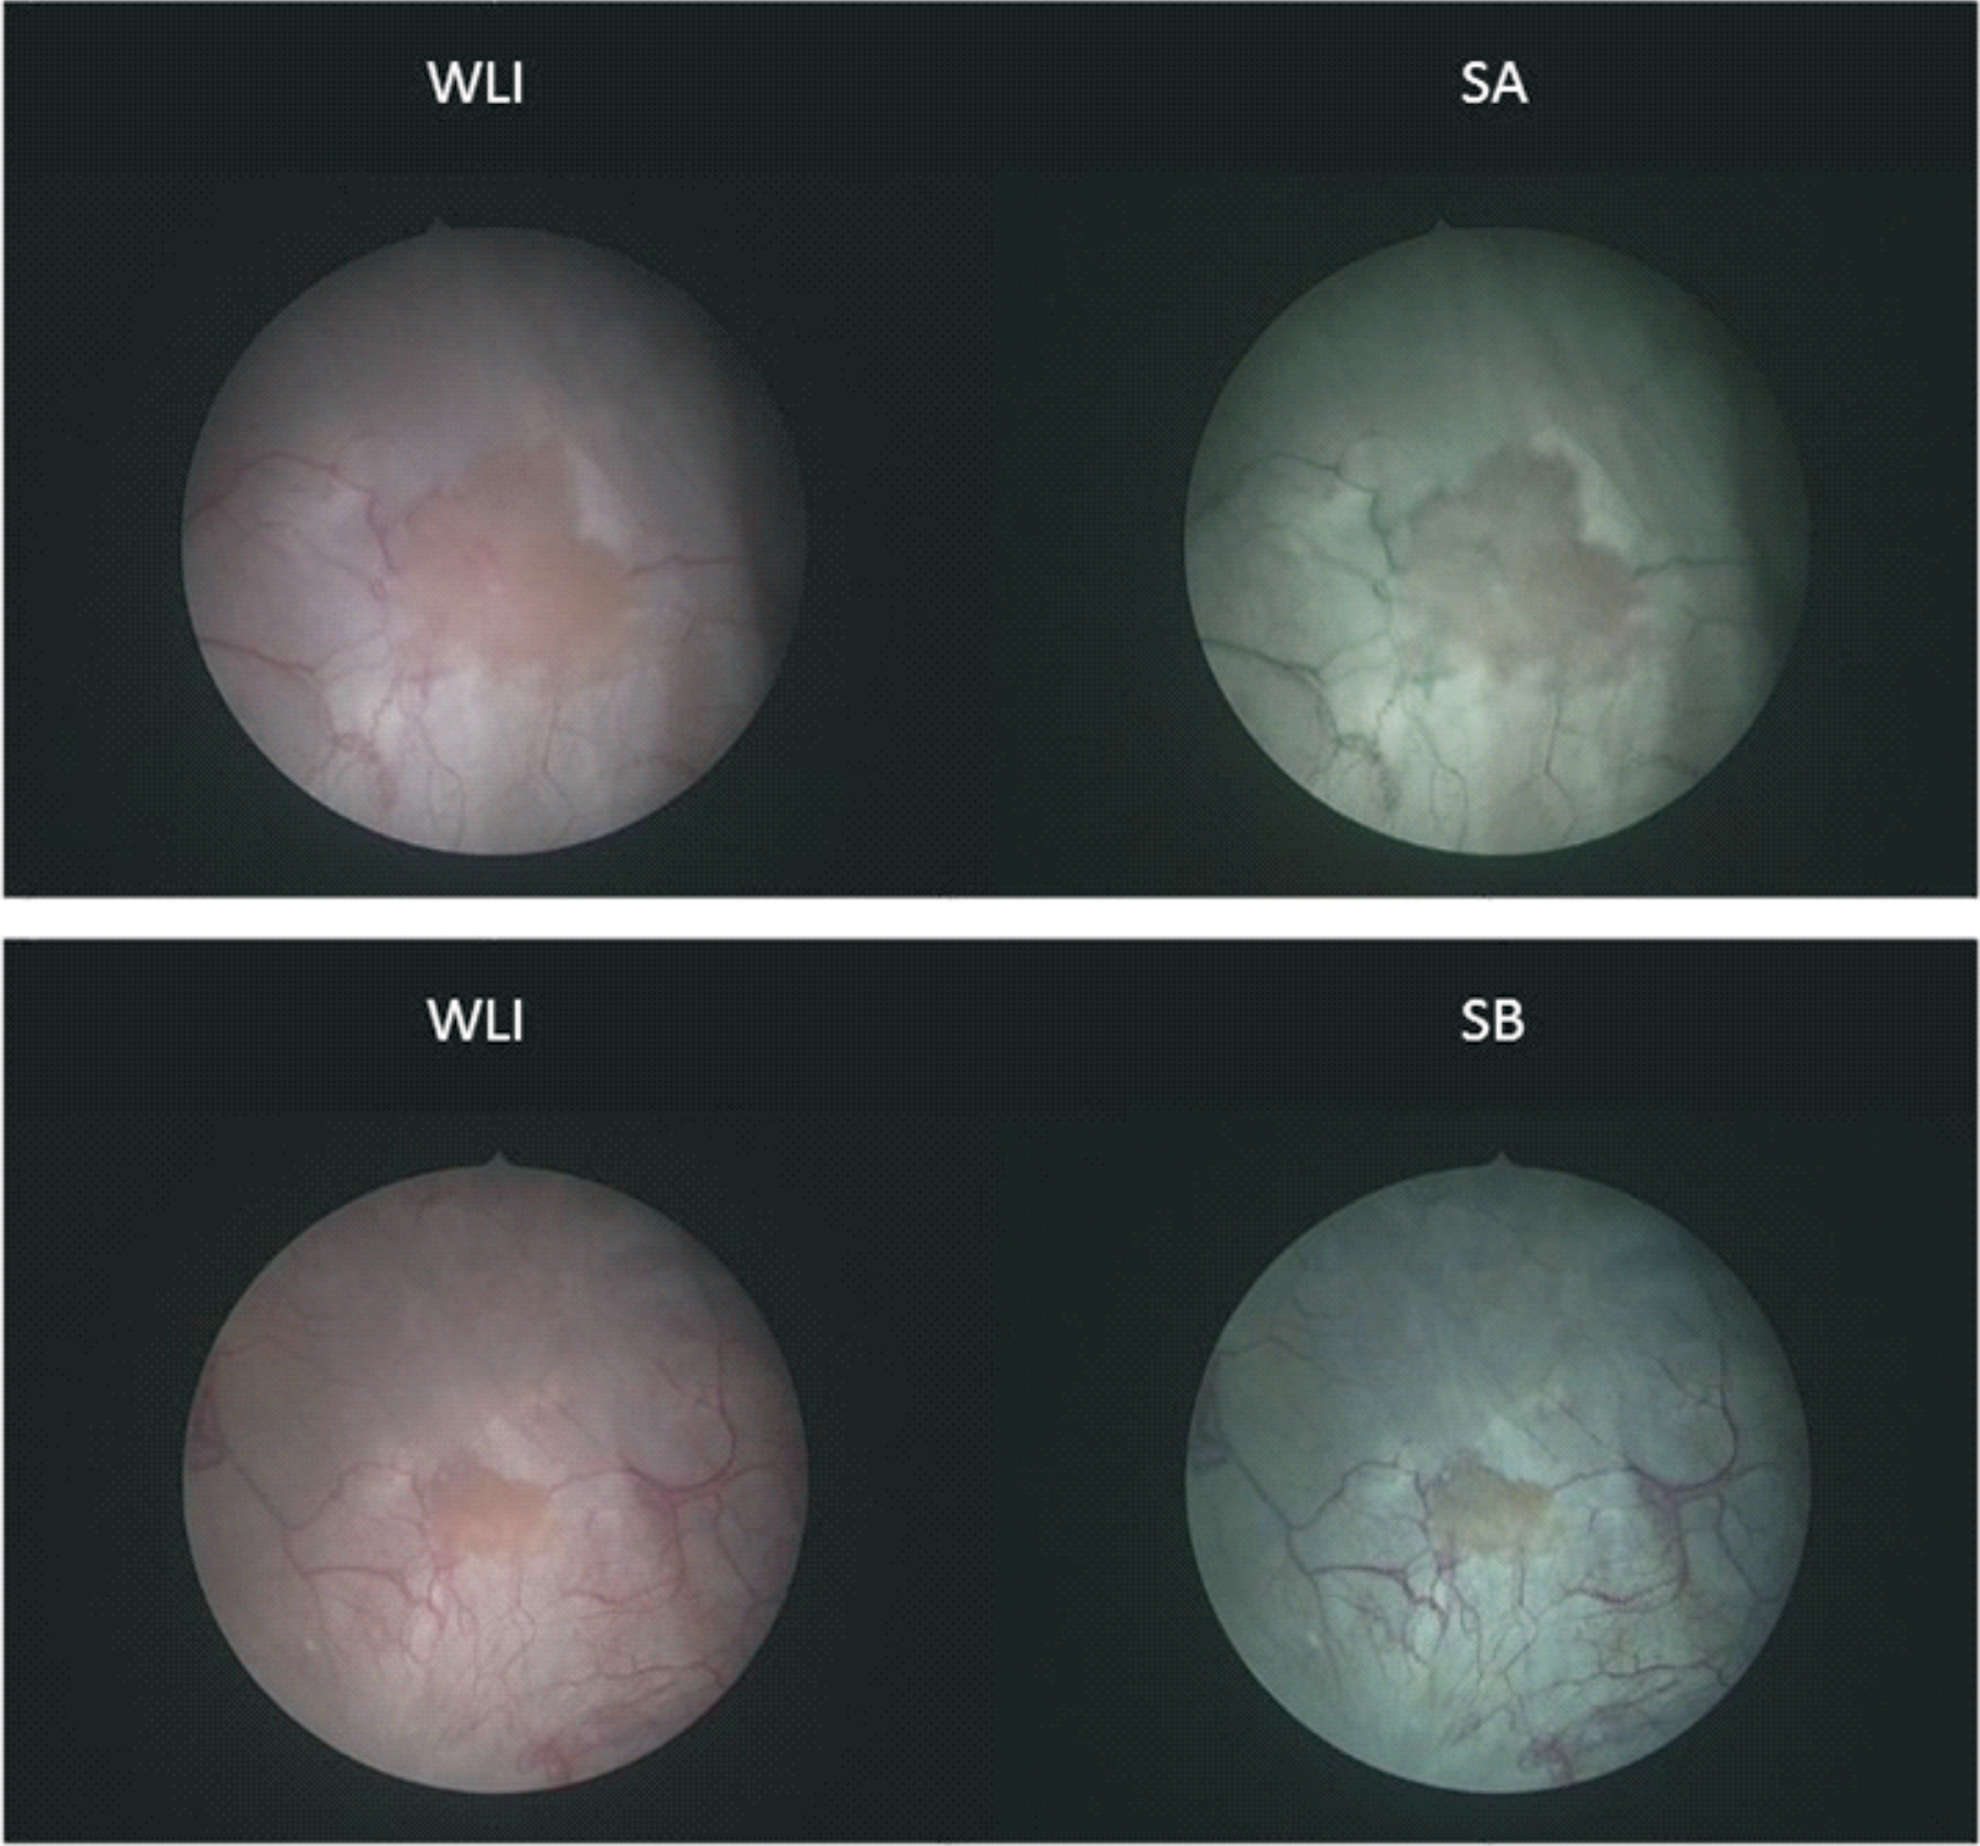
WLI and spectra images side by side. These images are seen (two at a time) side by side on the monitor. SA = Spectra A; SB = Spectra B; WLI = white light imaging. Color images are available online.
The images were cut into two parts: standard WLI and spectra image. The selected images were randomly numbered with number sequences generated from
The sample size of 45 was calculated as per the formula suggested by Naing 9 (Supplementary Material S1). The survey was live on internet through JISC online survey from November 18, 2018, to December 20, 2018. Images from 18 patients were selected for the survey. In all patients, one image was standard WLI and other SA or SB. Total images were WLI 18, SA 14, and SB 13. Observers comprised 3721 members of the Urological Society of India (USI) and 7 current students of ChM Urology, University of Edinburgh. These observers were invited to participate in the survey by e-mail and WhatsApp. We were expecting ∼200 responses. With 45 images and 200 members, we had projected 9000 responses for data evaluation.
Statistics
Sensitivity, specificity, positive predictive value (PPV), and negative predictive value (NPV) of WLI, SA, and SB were calculated by 2 × 2 tables. Survey observations with “cannot say” responses were excluded from analysis with 2 × 2 tables. For this, the histopathologic diagnosis was considered true and other modalities such as WLI, SA, and SB were judged against histologic diagnosis. The graphs and charts for the clinical accuracy were plotted using online tools by Fanshawe et al. 10 As the number of observers was more than two, an extension of the Cohen's kappa called Fleiss kappa was used. 11 The data analysis was generated using the Real Statistics Resource Pack 12 software by Charles Zaiontz. The resources given on this website were used for calculation of the Fleiss' kappa as well as other statistical parameters. Our study involved comparison of sensitivities and specificities of two diagnostic tests for paired binary observations. For the comparison of such observations, McNemar test 13,14 was used. McNemar's test is useful for assessment of the performance of the tests rather than for assessment of agreement. Online tools from SciStatCalc 15 site were used to calculate McNemar's test χ 2 . The receiver operating characteristic curves were plotted with Microsoft Excel® tools from statistics for everyone. 16 Diseased and nondiseased groups were evaluated separately. For this, the histopathology was considered gold standard. Patients with histopathology showing cancer (all grades and inclusive of CIS) were considered “diseased.” Patients whose biopsy was negative for malignancy and the patients with normal cystoscopy findings were considered “nondiseased.” WLI was considered the reference test and SA (and SB) was considered new test. The WLI cases and corresponding SA (or SB) cases were grouped together. While conducting the McNemar's test, all responses of “cannot say” either alone or in combination were excluded. That means if an observer has said yes (or no) for one modality and cannot say for other modality, this pair of observation was excluded. Paired observations of yes–yes, yes–no, no–yes, and no–no only were included for conducting McNemaer test. The time taken to complete the survey was recorded on the JISC survey. This time taken was correlated with the experience of the observer by analysis of variance. The protocol was approved by the institutional ethical committee of Government Medical College, Akola.
Results
Of these 18 patients, 16 patients had suspicious lesions in the bladder. These suspicious lesions were biopsied; five were negative, eight were grade I, and one each in grades II, III, and CIS as per World Health Organization (WHO) 1973 classification. A total of 273 observers completed the survey. Majority of the observers were in the age group of 30 to 40 years, majority of the observers (256/273, 93%) were from India and practicing general urology. A total of 178 (65.2%) observers had >5 years' experience after urology certification. Of the total 12,285 observations, 1499 “cannot say” were excluded. The overall percentages of “cannot say” observations did not differ statistically among the WLI, SA, and SB groups paired t test p = 0.14 (WLI vs SA) and p = 0.85 (WLI vs SB). The remaining 10,786 observations were included in 2 × 2 analysis (Supplementary Fig. S1).
Sensitivity and specificity were WLI 89.81, 73.18; SA 91.15, 66.17; and SB 88.81, 68.68, respectively (Supplementary Table S1). SA was more sensitive in detecting NMIBC as compared with WLI and SB. WLI was more specific in detecting NMIBC as compared with SB and SA. PPV was best with WLI. NPV was marginally better with SA and SB. On 2 × 2 table analysis, although the sensitivities and specificities of WLI, SA, and SB look almost similar, this does not imply that these tests are equivalent. McNemar test (Table 1) was used for evaluation of sensitivities and specificities of these two tests performed on same sets of individuals. This shows that if the patient does not have cancer, optical enhancement by SA and SB does not add much to the diagnostic accuracy of the WLI. But in those patients with cancer, these two enhancements added significantly to the diagnostic accuracy of WLI (Fig. 3 ROC curve and Fig. 4). With increasing tumor grade, the sensitivity and NPV of all modes increased. However, our study included only one patient each in grades II, III and CIS.

ROC curve for WLI, SA, and SB. In this curve, the WLI is the reference test and SA and SB are the new tests. There are two curves for WLI because the observations with either one or both “cannot say” were excluded. So, we have two sets of paired observations that are depicted in one graph. This curve is drawn using statistics for everyone online tools. Color images are available online.
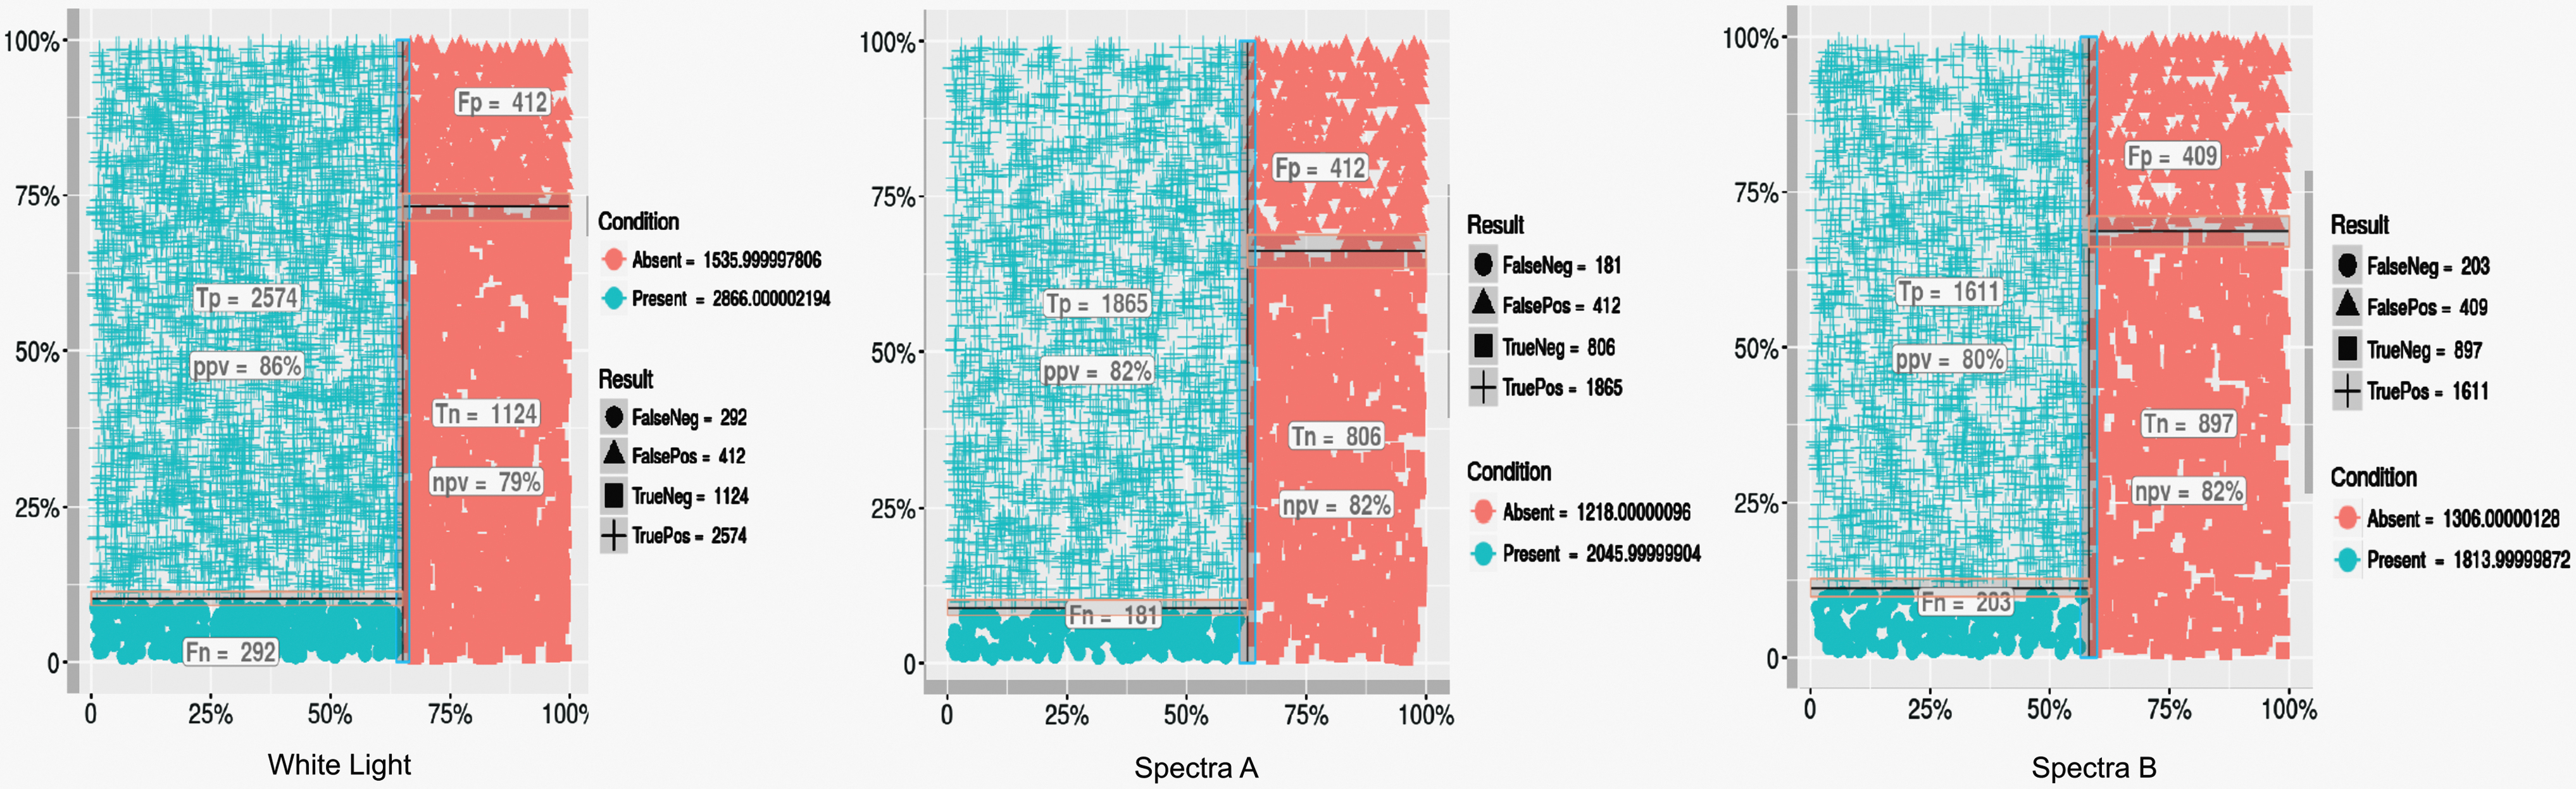
Test accuracy results of white light, SA, and SB. Color images are available online.
Dichotomous Paired Observations of Spectra A and Spectra B Against White Light Imaging
SA = Spectra A; SB = Spectra B; WLI = white light imaging.
In all (WLI, SA, and SB) modes, sensitivity, specificity, PPV, and NPV improved with the experience of the observers (Supplementary Table S2). Interobserver agreement was best with WLI cystoscopy. In patients with histologically proven cancers, SA and SB improved the agreement. (Supplementary Fig. S2: Fleiss Kappa). The time taken by the observers ranged from 304 to 27,034 seconds (5 minutes to 8 hours). Obviously, the observer cannot be working on this survey for 8 hours continuously. We presumed that if the survey took anything >30 minutes, probably the survey was not completed in one session, hence for the time taken analysis only, all observations <1800 seconds (30 minutes) were included (N = 247). We found that the time taken by the observers to complete the survey had an inverse correlation with their training status (Supplementary Fig. S3: Box and Whisker Plot).
Discussion
In our study, SA was the most sensitive modality and had a high NPV. WLI was most specific and had high PPV. Similar studies about SPIES are not available but are available for other optical enhancements such as PDD and NBI. A systematic review 17 and meta-analysis of bladder cancer detection of WLI vs PDD reported 92% (95% confidence interval [CI] 80–100) sensitivity for PDD and 71% (95% CI 49–93) for WLI. In contrast, the specificity for PDD was low at 57% (95% CI 36–79), for WLI it was 72% (95% CI 47–96). Zheng and colleagues 18 in their systematic review and meta-analysis of NBI reported a sensitivity of 94% (95% CI 91.4–96.4) for NBI and 85% (95% CI 80–89) for WLI. In contrast, the specificity of NBI was 85% (95% CI 81–88) and that for WLI was 87% (95% CI 83–90). Although the findings of these studies cannot be compared, it can be inferred that all these optical enhancements (SPIES, NBI, and PDD) would be beneficial in improving sensitivity by reducing false negatives. But lower specificity would bring in more false positives and hence additional biopsies and increased anxieties for the patient and family.
Interobserver agreement was moderate in all cases. When WLI, SA, and SB modes were analyzed separately, the agreement was better with WLI as compared with SA and SB. It might be partly because of familiarity of the observers with WLI. The junior observers took less time to complete the survey as compared with the senior observers, probably because of their familiarity with the online forms, which the seniors lacked. It is also possible that the more experienced observers had a more detailed look before they took a decision. With increasing tumor grade, the sensitivity and NPV of all modes increased. These modes, when negative, may rule out a high-grade lesion. But this needs to be verified through a study with larger number of high-grade lesions. Using McNemar's test, we observed that if the patient does not have cancer, optical enhancement by SA and SB did not add much to the diagnostic accuracy of the WLI, whereas in patients with cancer, these two enhancements added significant advantage over WLI. This is the precise reason why these optical enhancements were introduced.
Kamphuis et al. studied different SPIES image enhancement modes on iPad app. 5 Instead of the histologic diagnosis, assessment of the image by a panel of urologists was used as the control. In this study, the authors observed less variation in the interpretation in Chroma + Clara and SB than in WLI and SA in easy-to-delineate cases. The major plus point of our study is that we compared image interpretation with actual histologic diagnosis, something we are more keen on in real-life situations. In a study by Chondros and coworkers, 19 each patient underwent cystoscopy by two independent experienced urologists. In this study, SPIES cystoscopy identified significantly (p = 0.003) more (48/78, 61.5%) lesions than WLI (37/78, 47.8%). The advantages with SPIES were better viewing experience and better identification of suspicious lesions. This method does allow within-patient comparison of WLI and SPIES, but prolongs the operative time. Moreover, human error in observation cannot be ruled out. Soria et al. compared WLI, PDD, and SPIES through video recordings of cystoscopy procedures shown to urology residents. 20 Their responses were compared with those of experts. The authors reported lower rate of missed bladder cancer lesions with PDD as well as SPIES irrespective of the experience of the surgeon. Both PDD and SPIES decreased the chance of false negative cystoscopies with less experienced observers. This study is more representative of real-life situations as complete videos are observed by the observer and not the still images as used in our study. However, this study does not compare the performance of SPIES or PDD with histologic diagnosis. A multicenter trial of WLI and SPIES by Clinical Research Office of the Endourological Society (CROES) is underway. 21 The results are awaited.
Although we are not comparing SPIES with NBI, there are some possible theoretical advantages in using SPIES over the NBI. There is no need for a special light source, no time spent in switching from WLI to NBI, and availability of “control”’ WLI image for side-by-side viewing, hence overall saving of operative time and avoidance of second look bias as both images are available for side-by-side comparison. Similarly, unlike PDD, SPIES does not need instillation of any medication in bladder, hence there is neither any wait time for the medication to act nor any instillation-related adverse effects. Also there was no time lost in switching from WLI to PDD. PDD also needs procurement of new camera, telescope, and light carrier. The quality of video images and the motion artifacts 22 with PDD are also worth considering. If SA and SB modes are reliable and reproducible in the diagnosis of bladder lesions and found to be equivalent or noninferior to NBI or PDD, these modes do have a potential of replacing NBI and PDD. Our study is a pilot study and may form a basis of comparing it with these established modes in the future.
The strengths of our study are the within-patient comparison of different image enhancements, no risk of missed lesion as the same area is seen on WLI and SA/SB, no increase in operative time, no additional tests, no additional risk to the patient, high number of observations, and participants with varying level of experience. Moreover, the actual pathologic diagnosis is considered as a reference.
The weakness is there is no operating room environment. As the images to be used in the survey were “selected,” the prevalence of cancer in this study is not representative. The outcomes may not be directly extrapolated to the dynamic cystoscopy done by the urologist. We had no control over the experience and credentials of the participant or the resolution or display settings of the device used by the participant. Agreement or disagreement over the pathology slides is not taken into consideration. Moreover, we did not evaluate the recurrence and progression parameters.
Conclusions
In this online pilot survey of cystoscopy images, we found that if the patient does not have cancer, adding optical enhancement by SA and SB does not add much to the diagnostic efficacy of WLI. Whereas SA and SB significantly improved the diagnostic efficacy of WLI in those patients who had cancer. SA and SB if negative may rule out NMIBC more effectively than WLI alone.
Footnotes
Acknowledgments
Authors wish to thank Miss. Maitreyee Mulawkar (designing survey), Mr. Shashikant Chinchole (statistical analysis), Dr. Tobias Klatte (study design suggestions), Dr. Uzma Tufail Hanif (access to use JISC online Survey).
Author Disclosure Statement
No competing financial interests exist.
Funding Information
No financial support was sought for or received in conducting this study. Access to the JISC survey was provided free of cost by The University of Edinburgh.
Supplementary Material
Supplementary Material S1
Supplementary Figure S1
Supplementary Figure S2
Supplementary Figure S3
Supplementary Table S1
Supplementary Table S2
Abbreviations Used
References
Supplementary Material
Please find the following supplemental material available below.
For Open Access articles published under a Creative Commons License, all supplemental material carries the same license as the article it is associated with.
For non-Open Access articles published, all supplemental material carries a non-exclusive license, and permission requests for re-use of supplemental material or any part of supplemental material shall be sent directly to the copyright owner as specified in the copyright notice associated with the article.