
Abstract
Purpose:
The cumulative sum (CUSUM) approach has been adopted to evaluate surgical competence in various contexts. The CUSUM method comprises sequential monitoring of cumulative differences from a target level in performance quality over time, allowing the detection of deviations from the target. We use the CUSUM method in this study to derive both institutional and surgeon-specific learning curves for robot-assisted radical prostatectomy (RARP).
Patients and Methods:
We reviewed 540 patients diagnosed with localized prostate cancer (pathologic stage T2) who underwent RARP at our institution between September 2011 and December 2017. The CUSUM method was used to construct both institutional and individual-surgeon learning curves; the outcome was assessed based on whether a positive surgical margin (PSM) was present. The target PSM rate was 20%. Of seven surgeons performing robot-assisted resections for this period, four who performed ≥60 resections were assessed separately.
Results:
Of 540 patients, 74 (14%) had PSMs. The institutional CUSUM chart exhibited a downward trend for the first 54 cases and an upward trend thereafter. The CUSUM chart for the earliest adopter was similar to that for the institution; that is, learning was complete at 45 cases. Two adopters did not undergo a learning curve as they consistently performed well. The last adopter required 10 cases for initial learning. However, his CUSUM chart trend became negative at 46 cases and remained so afterward.
Conclusions:
CUSUM charts are useful for monitoring surgical quality. Long-term monitoring of the PSM rate of a surgeon who has become independent allows an attending surgeon to intervene if necessary; thus, long-term quality control is assured.
Introduction
Surgeons need time to become proficient in the use of novel techniques and medical devices; that is, the time is that reflected on a “learning curve,” usually defined as the number of cases treated before proficiency is evident. A learning curve reflects not only the skills of a new surgeon but also institutional factors. The cumulative sum (CUSUM) method is used by manufacturing industries to ensure quality control. In the 1970s, the CUSUM approach was adopted to evaluate surgical competence in various contexts, especially in cardiac surgery, 1 –3 and has recently been used to measure robotic surgery competency. 4 –6 CUSUM charts reflect sequential monitoring of the cumulative differences between demonstrated performance and target performance over time, revealing deviations from the target. Changes over time in the performance of a new surgeon are immediately apparent. A trainer can identify a trainee in difficulty, and institute immediate corrective measures. The collective team experience (both individual and those afforded by assisting learners) enhances team quality over time. The learning curves of new surgeons are affected by the overall experience of their team even as they go through the learning process individually. 7
Prostate cancer is common in men. Radical prostatectomy is the gold standard treatment for localized cancer. Traditionally, radical prostatectomy featured an open approach. However, minimally invasive approaches, including laparoscopic radical prostatectomy and robot-assisted radical prostatectomy (RARP), have become increasingly popular. RARP is now the primary treatment option in patients eligible for radical treatment. 8,9 However, this poses a challenge to many urologists as familiar techniques are supplanted by a new technique. Many parameters may be evaluated when analyzing an RARP learning curve. Several studies have focused on operative time, 7,10 –12 complications, 12,13 and blood loss. 10,14 Although these outcomes are certainly important in terms of whether urologists have mastered the surgical techniques, they are not necessarily relevant to the principal goal of oncologic surgery, which is cancer control. A positive surgical margin (PSM) after radical prostatectomy is considered one of the adverse oncologic outcomes, although its long-term impact on clinical progress is controversial. 15 Several reports have derived RARP learning curves using the CUSUM method. 13,16,17 However, to the best of our knowledge, no study has yet used CUSUM analysis to define both institutional and surgeon-specific RARP learning curves using PSM as the outcome. Hence, we investigated this topic in this study.
Patients and Methods
We enrolled consecutive patients diagnosed with localized prostate cancer (pathologic stage T2) who underwent RARP between September 2011 and December 2017. All patients were treated in St. Luke's International Hospital using the da Vinci S or Xi surgical systems (Intuitive Surgical, Sunnyvale, CA). All primary prostate adenocarcinomas were histopathologically confirmed in our department of pathology. No patient underwent preoperative radiation or neoadjuvant androgen deprivation therapy. Our internal review board approved all study procedures; we assessed 540 patients retrospectively.
Surgical and presurgical data (from medical records) included patient age, height, weight, pretreatment prostate-specific antigen (PSA) level, National Comprehensive Cancer Network risk group membership, 18 surgical Gleason score, nerve-sparing status, operative time, blood loss, complications graded using the Clavien–Dindo classification, 19 and PSM status. All prostatectomy specimens were processed according to International Society of Urological Pathology (ISUP)/American Joint Committee on Cancer guidelines. The several pathologists analyzed each specimen and all final decisions were made by the director of the department of pathology. Body mass index (BMI; kg/m2) was calculated. Operative time ran from trocar placement to application of surgical dressings after closure of the surgical incisions. During the study period, seven surgeons performed robot-assisted resections, but three surgeons performed only 3, 9, and 11 resections, respectively. We performed institutional and surgeon-specific (four surgeons) analyses; all surgeons performed ≥60 resections.
Statistical analysis
We used the CUSUM method to create institutional and surgeon-specific learning curves. CUSUM analysis has been described by Noyez 3 ; it comprises sequential monitoring of cumulative performance over time, thus identifying the subtle slow sustained degradation of a process that is thought to be controlled. Reward or punishment reflects the risk. The initial target event rate is set to s. For each success, the reward is s points; for each failure, the punishment is minus (1 − s) points. The chart commences at 0; with each success, s is added to the previous CUSUM value. For each failure, 1 − s is subtracted from that value. An upward-trending slope indicates that the average success rate over time is greater than that targeted; a downward-trending slope suggests the opposite. A CUSUM chart connects CUSUM values over time.
The mean PSM rate is 9% (range, 4%–23%) in patients with pT2 cancers. 8 Experience with about 400 cases is required before the pT2 PSM rate plateaus, 20 and >1600 cases must be treated before the PSM rate falls to <10%. 21 Thus, it is impractical to set the target PSM rate to 9%. In the initial phase of our study, we set the expected PSM rate to 20% (the approximate meta-analytical upper limit). We compared the PSM risk factors (ISUP Gleason grade group, risk classification, PSA level, and BMI) in patients treated by four surgeons. The chi-squared test was used to compare categorical variables, and the Kruskal–Wallis test was used to compare continuous variables. A p-value <0.05 was considered to denote statistical significance. All statistical analyses were performed with the aid of SAS software (SAS Institute, Cary, NC).
Results
Patient age ranged from 47 to 82 years (mean, 66 years). The median BMI and preoperative PSA level were 23.7 kg/m2 and 6.6 ng/mL, respectively. The low-, intermediate-, and high-risk groups contained 87 (16%), 254 (47%), and 199 (37%) patients, respectively. The median operative time and blood loss were 298 minutes and 100 mL (data for one patient were missing), respectively. In terms of the ISUP Gleason graded, 91 (17%), 260 (48%), 76 (14%), 64 (12%), and 49 (9%) patients were classified as grades 1, 2, 3, 4, and 5, respectively. Unilateral and bilateral nerve-sparing was achieved in 192 (36%) and 283 (52%) patients, respectively.
Of the 540 patients, 74 (14%) exhibited PSMs, most commonly at the apex (57%), followed by the proximal (24%), posterior (12%), lateral (4%), and anterior (3%) regions. The PSM rates were 12%, 14%, 12%, and 20% for surgeons 1, 2, 3, and 4, respectively (p = 0.336). The PSM risk factors did not differ among the surgeons (Table 1).
Differences in Risk Factors for Positive Surgical Margins Among the Four Surgeons
IQR = interquartile range.
The institutional CUSUM curve exhibited a decreasing trend for the first 54 cases, followed by an increasing trend thereafter (Fig. 1). Surgeon 1, the earliest adopter of the robotic technique, performed most of the first 50 resections. The CUSUM curve for surgeon 1 was similar to that for the institution (Fig. 2A). Surgeon 1 achieved competency, as exhibited by the learning curve, at 45 cases. At about this time (when surgeon 1 had treated 39 cases), surgeon 2 started using the robotic technique (Fig. 2B). Surgeons 2, 3, and 4 began performing robot-assisted resections later than did surgeon 1, under the guidance of surgeon 1. Surgeons 2 and 3 consistently performed well, although the PSM incidence never fell below zero (Fig. 2B and 2C), but the curve associated with surgeon 4 was clearly different (Fig. 2D). For surgeon 4, the learning curve associated with PSM incidence exhibited a decreasing trend for the first 9 cases, an increasing trend from cases 10 to 45, and a continuous decreasing trend staring from case 46. Of the 89 patients experiencing complications, 9%, 6%, and 1% were classified as having grade-1, -2, and -3 complications, respectively.
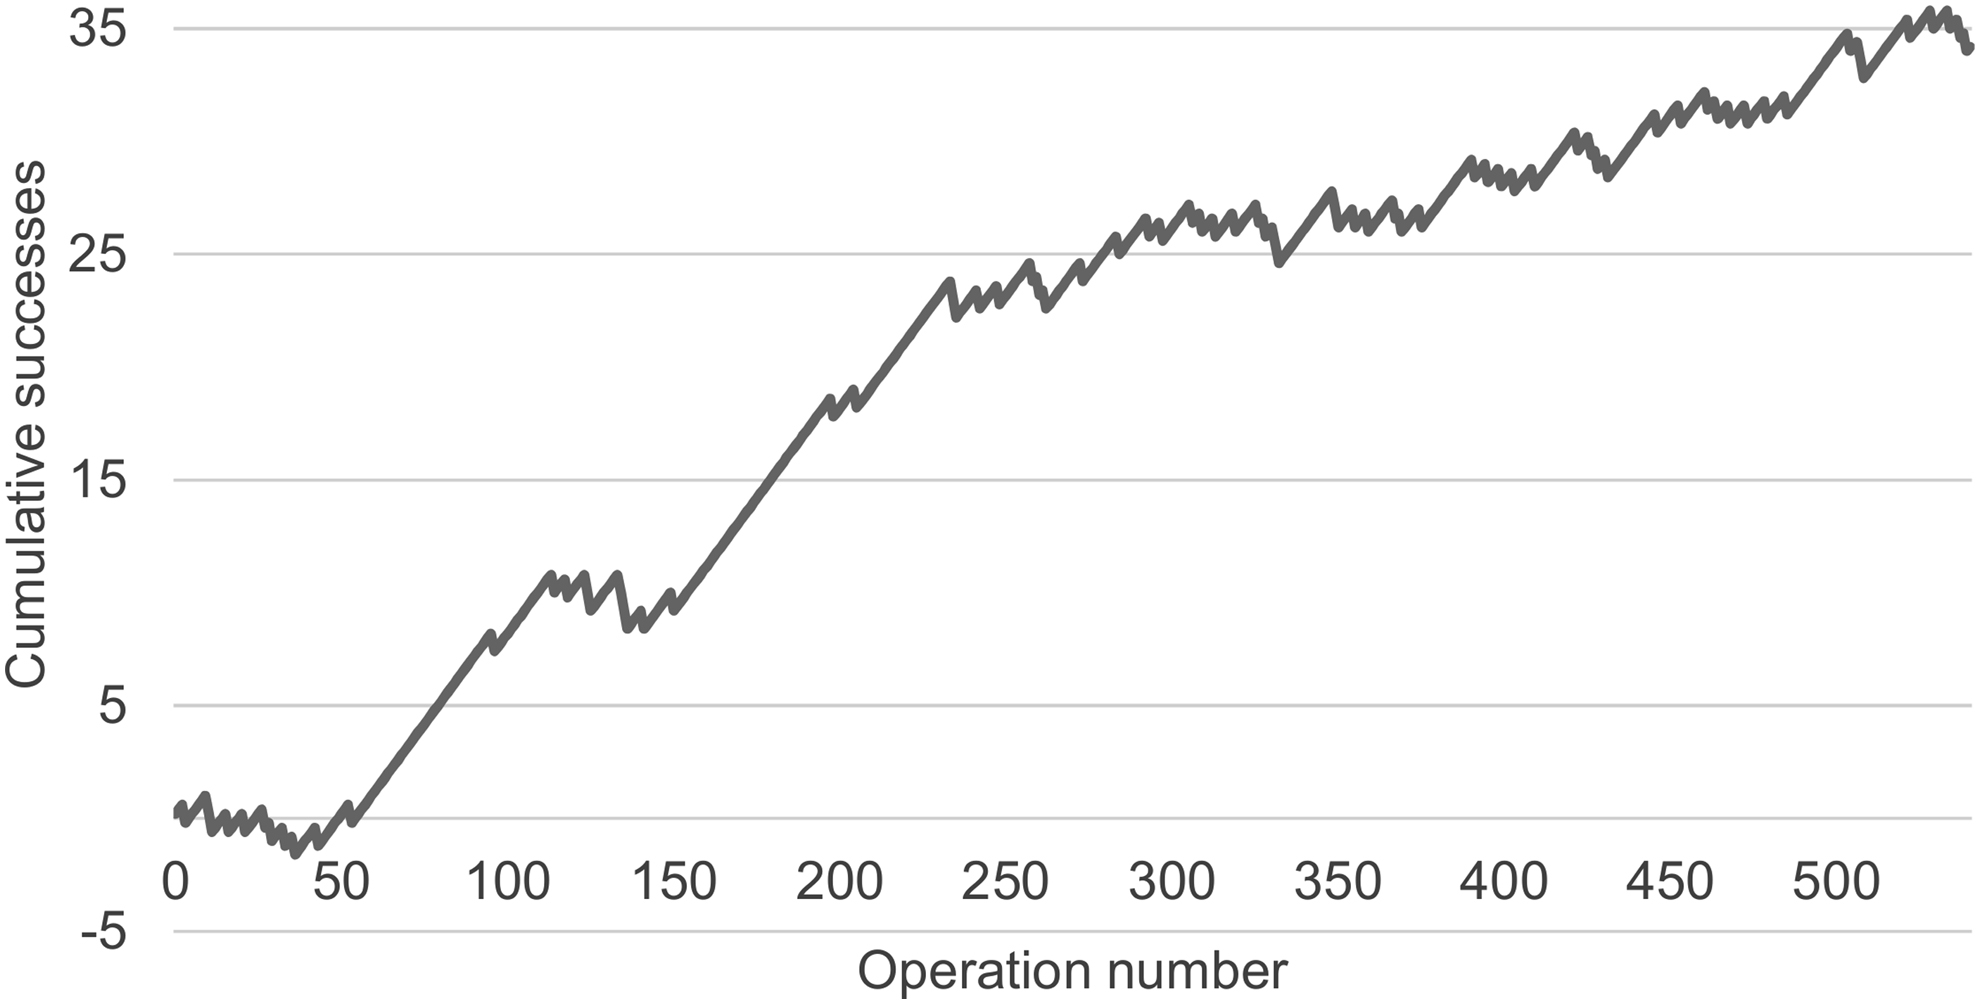
CUSUM graph of whether the target outcome was met in surgeries performed by all surgeons in the institution for the study period, with the target positive margin rate set to 20%. CUSUM = cumulative sum.
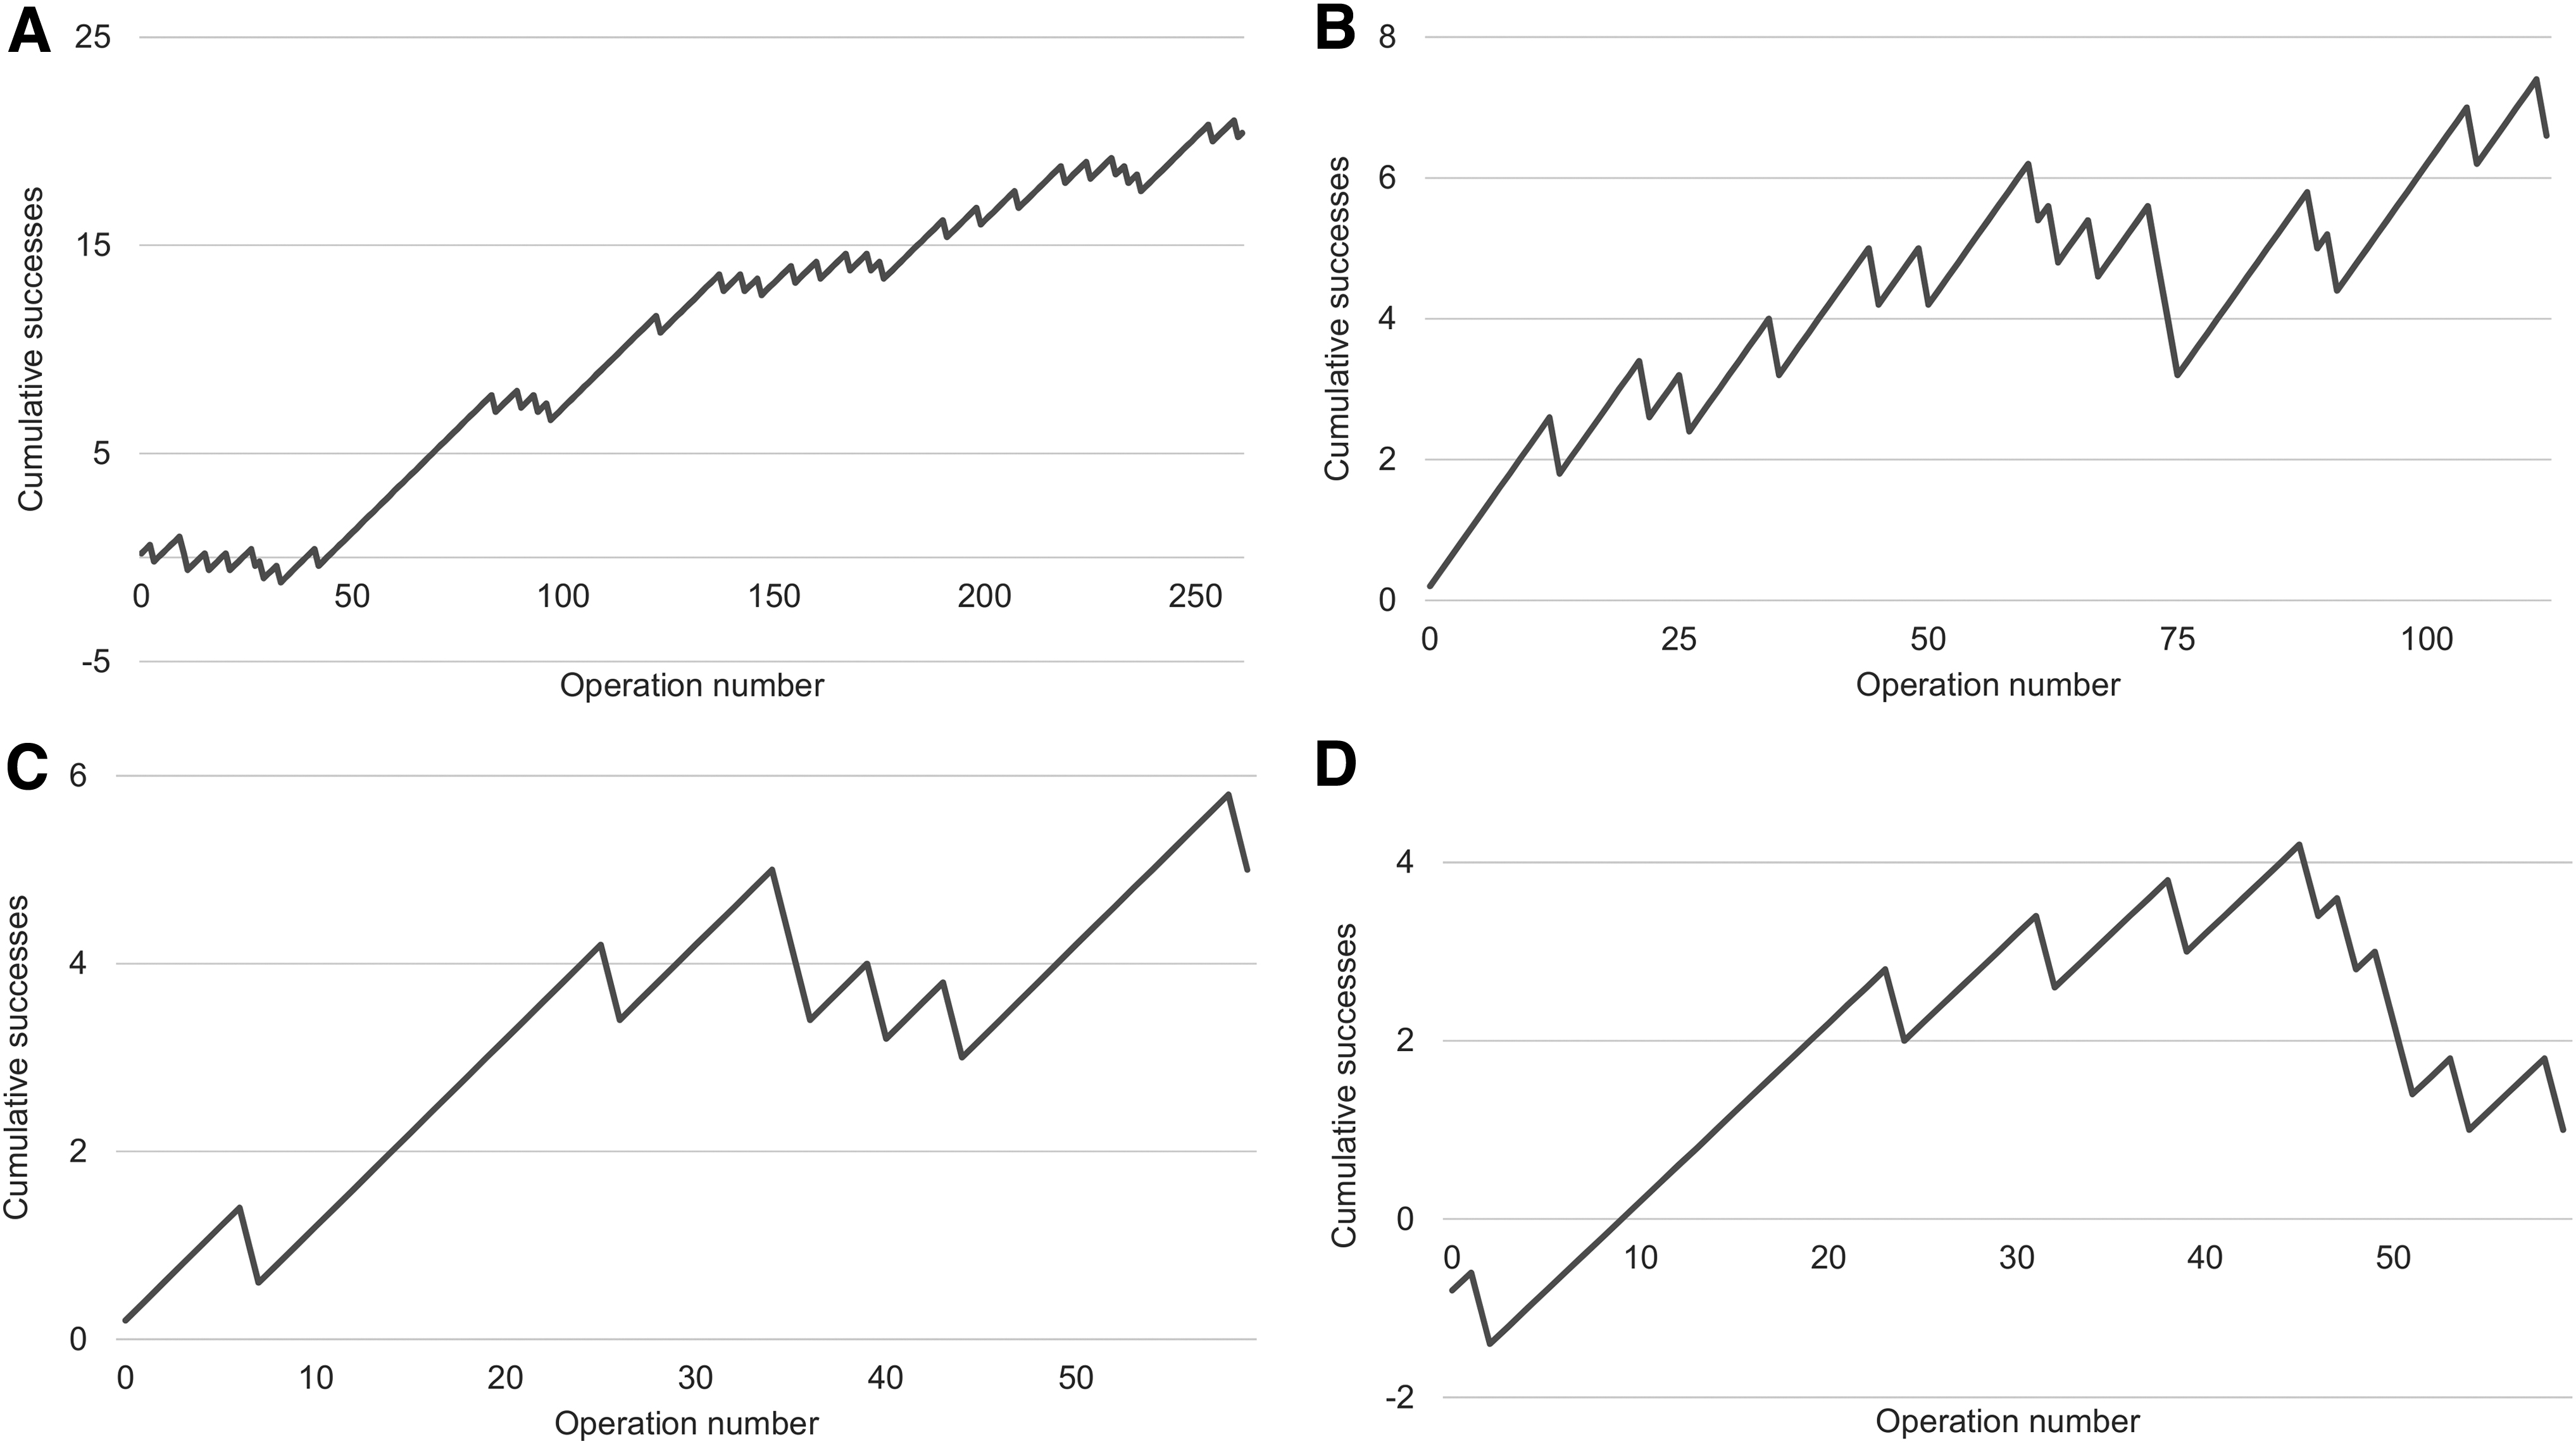
CUSUM graphs of whether the target outcome was met in surgeries performed by surgeons 1
Discussion
We analyzed the first 540 RARPs performed in our institution. We used the CUSUM method to draw institutional and individual RARP learning curves (in terms of PSM incidence) when patients with localized prostate cancer were treated. After the introduction of RARP, 55 resections were required before the institution attained competency; 45 resections were required for surgeon 1. Surgeons 2, 3, and 4 thus benefited from the experience of surgeon 1, and institutional quality was assured this way. Surgeons 2 and 3 attained competency immediately. Surgeon 4 required nine cases to attain competency, but later regressed and remained in a learning phase. By monitoring the PSM rate of a surgeon who has become independent using CUSUM analysis, an attending surgeon can decide to intervene if necessary. Hence, the CUSUM method allows for long-term quality control.
Many RARP learning curve studies have been published. 7,10 –14,16,17,20 –26 The CUSUM method was also used in several articles. 13,16,17 CUSUM charts allowed us to readily monitor changes in the RARP PSM rate when patients with pT2 prostate cancer were treated. To the best of our knowledge, we are the first to use CUSUM analysis to obtain both institutional and single-surgeon learning curves using PSM incidence as the outcome.
We evaluated the influence of a team on individual surgical performance during learning. It is likely that team experience and assistance from more senior surgeons help younger operators. Surgeons 2 and 3 did not go through a learning curve, perhaps reflecting the team experience. However, the curve associated with surgeon 4 was different. Thus, team experience is not the only factor associated with individual learning.
There is no perfect learning marker as many markers can be employed when drawing RARP learning curves; these include PSM incidence, 11,14,16,17,20 –25 operative time, 7,10 –12 complication rate, 12,13 blood loss, 10,14 biochemical recurrence, 17,22,23 length of hospital stay, 10 –13 and a need for adjuvant radiation. 13 However, direct cause-and-effect relationships between surgical quality and markers are often difficult to define. In patients with organ-confined tumors, the PSM risk is minimized when the surgeon does not breach the prostate capsule. A PSM is reported to be associated with a 1.7- to 3.7-fold increased risk of biochemical recurrence, 15,27 with the PSM risk strongly affected by the surgeon's experience, although its long-term impact on clinical progress is controversial. 15 Urologists performing RARP must minimize the PSM rate to prevent disease recurrence. PSM incidence can be readily incorporated (as a binary variable) into a CUSUM chart. Thus, the PSM rate is clinically relevant, and patients with pT2 disease constitute an ideal population in which to monitor changes in surgical competence.
The CUSUM method features relatively simple calculations, facilitating quality control as successes and failures can be counted easily. The standard CUSUM method requires the specification of a target rate, which may be a real institutional rate, a published figure, or based on expert consensus. Our PSM target rate was the maximum rate reported in a recent review. 8 Establishing a target PSM rate is difficult as the rates reported in previous studies varied widely. 28,29 It is difficult to compare PSM rates among studies because of the variation in patient populations and differences in the emphasis placed on nerve-sparing. Our PSM rate (14%) was similar to that of a previous study (13%) that used the CUSUM method to monitor patients with pT2 disease who underwent RARP. 16 A target PSM rate should be set by each institution by referencing the time that has elapsed since the introduction of robotic surgery.
Our study has several limitations. The study was retrospective in nature, and all data were from a single institution. We used the PSM rate as a surrogate marker of oncologic outcome; we concede that both oncologic and functional outcomes (such as urinary continence and erectile dysfunction) should be considered when evaluating RARP success. 30 However, such functional outcomes cannot be assessed soon after RARP. PSM monitoring in real time helps to ensure quality control. Surgical learning curves may be influenced by interindividual differences in surgical skills.
Conclusion
CUSUM charts are useful as they allow surgeons to monitor their technical ability. Although the PSM rate can be influenced by many factors (e.g., the PSA level, BMI, and Gleason score), a surgeon's experience also affects that rate, which improves as the surgeon becomes more proficient. CUSUM analysis reveals whether a procedure is well controlled or not. The institution and individual surgeons can monitor their results relative to target PSM rates. A trainer can evaluate trainee performance and follow-up by telling him/her to stop or by scheduling further education or a period of observation.
Footnotes
Author Disclosure Statement
No competing financial interests exist.
Funding Information
No funding was received for this article.