




Abstract
Introduction:
Relative supersaturation (SS) for calcium oxalate (CaOx), calcium phosphate (CaP), and uric acid (UA) has been used for assessing urinary crystallization and estimated by programs, including EQUIL, Joint Expert Speciation System (JESS), and Lithorisk. We compared outputs from these programs and their correspondence with stone composition.
Materials and Methods:
SS of CaOx, CaP, and UA, using EQUIL, JESS, and Lithorisk were calculated from stone-forming patients. Pearson correlation coefficients were used to ascertain the correspondence between the outputs. Fractional regression models evaluated the relationship between SS and the percentage of each compound in the stones.
Results:
Two hundred eleven patients were included. Pearson correlation coefficients for CaOx (r ≥ 0.96), CaP (r ≥ 0.99), and UA SS (r ≥ 0.99) showed a high correspondence between all programs. We observed a significant correspondence between CaOx SS and the percentage of CaOx dihydrate in the stone (p < 0.001), as well as between the percentage of brushite and apatite and CaP SS. UA SS showed the strongest correspondence with the percentage of UA in the stones (p < 0.001).
Conclusions:
Good correlation between EQUIL, JESS, and Lithorisk was observed and good correspondence with stone composition. The magnitude of the association demonstrated by fractional regression models supports evidence for applying SS in clinical practice.
Introduction
The relative supersaturation (SS) of urinary salts has been extensively used for assessing the risk of stone formation. 1 An important question concerns the relative reliability of the different methods for determining SS. In terms of crystallization, the independent roles of urinary pH, volume, and excretion rates of 24-hour urine chemistries, such as calcium (Ca), phosphate (P), oxalate (Ox), citrate (Cit), sodium (Na), uric acid (UA), and sulfate, have been used to predict the risk of stone formation, 2 –5 but it is the interdependence of these factors that ultimately determines supersaturation levels and the risk of stone formation per se.
In view of that, SS of urinary salts has been used to estimate the risk of crystallization and can be determined experimentally, but it is cumbersome and time consuming. To overcome this, computer programs have been developed. These programs take into account the concentration of individual components and their tendency to form different chemical species in solution. 6 Examples of such programs are EQUIL2, 7 Joint Expert Speciation System (JESS), 8 and Lithorisk. 9
EQUIL has been the most extensively used in kidney stone research; its outputs provide SS values of stone-forming urinary salts. JESS's outputs include qualitative and quantitative descriptions of a wide range of chemical speciation, which prevails in the urine and generates values of the saturation index, an equivalent of SS. 8,10 Lithorisk calculates parameters called “betas,” which are a measure of the SS for calcium oxalate (CaOx), calcium phosphate (CaP), and UA, and graphically represents risk profiles of stone formation. 9
An alternative to the use of sophisticated speciation software is provided by the Tiselius activity product ratios AP(CaOx) and AP(CaP). 11,12 These are empirically derived formulae, which require only 5 urinary parameters as opposed to 12 to 15 required parameters depending on the speciation software and have been extensively used in stone research. 13,14
Since these methods are widely used for determining the SS of urinary stone-forming salts, a relevant question is whether they yield SS values, which agree for the same urine sample. Studies in this regard have differed with respect to the number and types of methods under comparison and the absence or strength of the correlations tested. 15 –18 Data on the relative reliability of these methods are therefore scant and further investigation is warranted. This defines the first objective of the present study.
Another equally important question is whether there exists a compelling correlation between SS and stone composition per se, given that SS is recognized as the driving force of stone formation and growth. Only one study has investigated this question previously. 19 In this study, the authors reported good matches for most of their comparisons obtained from EQUIL program, which were significantly elevated relative to a control group, with stone composition. However, stone types were divided into five groups based on their major compound and did not take into account different CaOx subtypes and all phases of CaP, including apatite (HAP) and brushite (BRU). 20 As such, the fundamental question posed in the first sentence of this paragraph regarding the correspondence between stone composition and SS values has not yet been fully answered. This defines the second objective of the present study.
Materials and Methods
Participants
Two hundred twenty-five stone formers from Federal University of Rio de Janeiro, Brazil who submitted at least one stone to physical analysis and underwent 24-hour urine collection before any treatment were recruited from March to September 2019. Urine samples which had been collected at least 60 to 90 days since the patient's most recent stone episode and before the commencement of any treatment were included. Urines were checked for complete collection (urinary excretion of creatinine (Cr) in the range of 15–20 mg/kg/24 hour) and patients were advised to not change their usual dietary habit patterns during this baseline collection. Anthropometric information, including age, sex, weight, height, and body–mass index, were obtained. Recurrence status was defined as self-reported stone passage, new stone detected by imaging, or previous episode with urological surgery. The study was approved by the local Ethics Committee (CAAE17123519.0.0000.5257).
Stone analysis
Renal stones eliminated spontaneously or removed by surgery were analyzed combining morphologic examination of the renal stone surface and section with infrared (IR) spectroscopy to identify the different crystalline phases, according to Daudon's methodology. 21 All calculi were examined by the same investigator using stereoscope Opton TNG 01B and IR spectrometer FT-IR Alpha (Bruker, Germany). The total percentage of each component in the stone was determined by IR spectroscopy. For the purpose of this study, stones were divided in groups, 22 as follows: calcium oxalate monohydrate (COM); calcium oxalate dihydrate (COD); mixed HAP with COD; BRU; HAP without struvite or BRU; UA, and mixed UA with COM.
Using the morphoconstitutional criteria described by Daudon and colleagues, 21 conversions from COD to COM were identified and classified as COD in their origin. Stones made by COM with just small amounts of COD in their surface were classified as COM.
Urine analysis and SS calculation
A single 24-hour urine sample was collected from each participant using sterile plastic bottles with Thymol. Urinary volume and pH (glass-electrode) were measured in each sample. Cr was measured using the Jaffe method; Ca, magnesium, and P using colorimetric methods; UA, Cit, Ox, and urea using automated enzymatic methods; and Na and potassium using ion-selective electrodes.
Urine parameters were used to calculate the SS of CaOx, BRU, and UA, using EQUIL2, JESS, and Lithorisk computer programs.
7
–9
The ion-activity product indices AP(CaOx) and AP(CaP) developed by Tiselius
11,12
were also calculated. An updated version of JESS, developed specifically for the calculation of urinary SS (JESS Urine Expert version 8.7.2) was used (
Statistical analyses
Categorical variables were expressed as numbers and percentages. For continuous variables, after assessing the normality of the data using histograms, QQ-plots and the Shapiro–Wilk test, variables were reported as means and standard deviations.
To evaluate the agreement between different computer-derived methods, we used scatterplots and the Pearson correlation coefficient. For the graphics, we used the EQUIL program as the reference. We also constructed Bland–Altman charts, using the difference between SS calculated by two different programs on the y-axis, and the mean of the two SS values on the x-axis. 23
The relationship between stone type and SS was visually examined by constructing three-dimensional (3D) graphs with SS of CaOx, CaP, and UA along the axes, in accordance with the procedure followed by Parks and colleagues. 19 Separate plots were constructed from the outputs of EQUIL, JESS, and Lithorisk. In addition, we developed fractional regression models to evaluate the strength of the association between the percentage of COM, COD, HAP, BRU, and UA in each stone with the correspondent SS values. In all cases, we used all three programs for SS calculations, and the outputs provided by EQUIL were used as reference, as follows: CaOx SS, BRU SS, and UA SS. Then, for stones comprising CaOx, we considered CaOx SS in the regression model; for stones containing CaP, BRU SS was taken into account in the model, whereas for UA, UA SS was considered. R software version 3.6.1 was used for all statistical analyses.
Results
Two hundred eleven patients were included in the final analysis. Of those, 185 (87%) were recurrent stone formers. Stone composition was found to fall into seven discrete groups. Anthropometric data and distribution of stone types are reported in Table 1. Cystine and struvite stone formers were excluded (14 patients).
Anthropometric Measures and Distributions According to Stone Type (n = 211)
BRU = brushite; COD = calcium oxalate dihydrate; COM = calcium oxalate monohydrate; HAP = apatite; SD = standard deviation; UA = uric acid.
Figure 1 shows the scatterplots and Bland–Altman charts for CaOx SS using the outputs from EQUIL, JESS, and Lithorisk. The activity products of Tiselius, AP(CaOx and APCaP), were also evaluated and compared with EQUIL program (Fig. 2). All correlation coefficients for CaOx SS were ≥0.96 for all comparisons, including Tiselius index AP(CaOx). For CaP SS comparisons (Fig. 3), all correlation coefficients were higher than 0.99 for all programs, but AP(CaP) did not reach the same high correlation as that achieved with EQUIL (r = 0.78) (Fig. 2). Correlation coefficients for UA SS obtained from the three programs (Fig. 4) were high in all cases (r ≥ 0.99). In reference to Bland–Altman charts (Figs. 1–4), a proportional bias between the methods was observed (i.e., the points of the chart are not all distributed around a difference of zero) indicating that although the results are highly correlated, the values themselves are not the same in all programs. 24

Scatterplots and Bland–Altman charts for CaOx supersaturation SS(CaOx) using outputs from EQUIL, JESS, and Lithorisk. CaOx = calcium oxalate; SS = relative supersaturation.
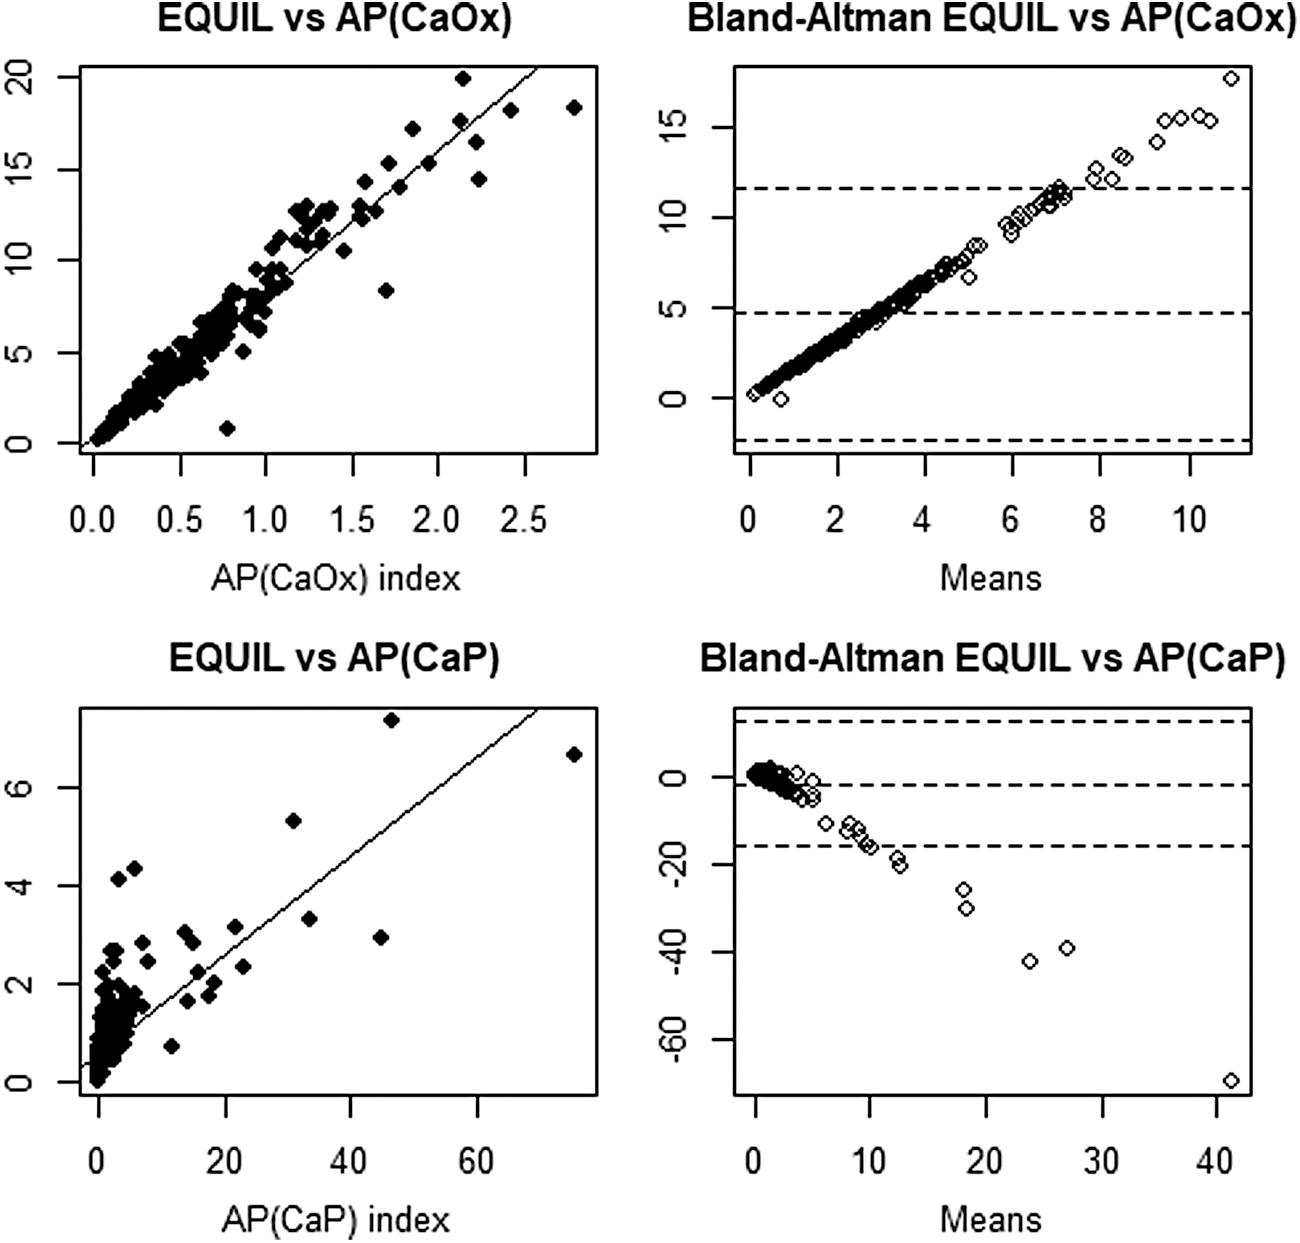
The correspondence between the ion-activity product index AP(CaOx) and AP(CaP) and the outputs provided by software (EQUIL).
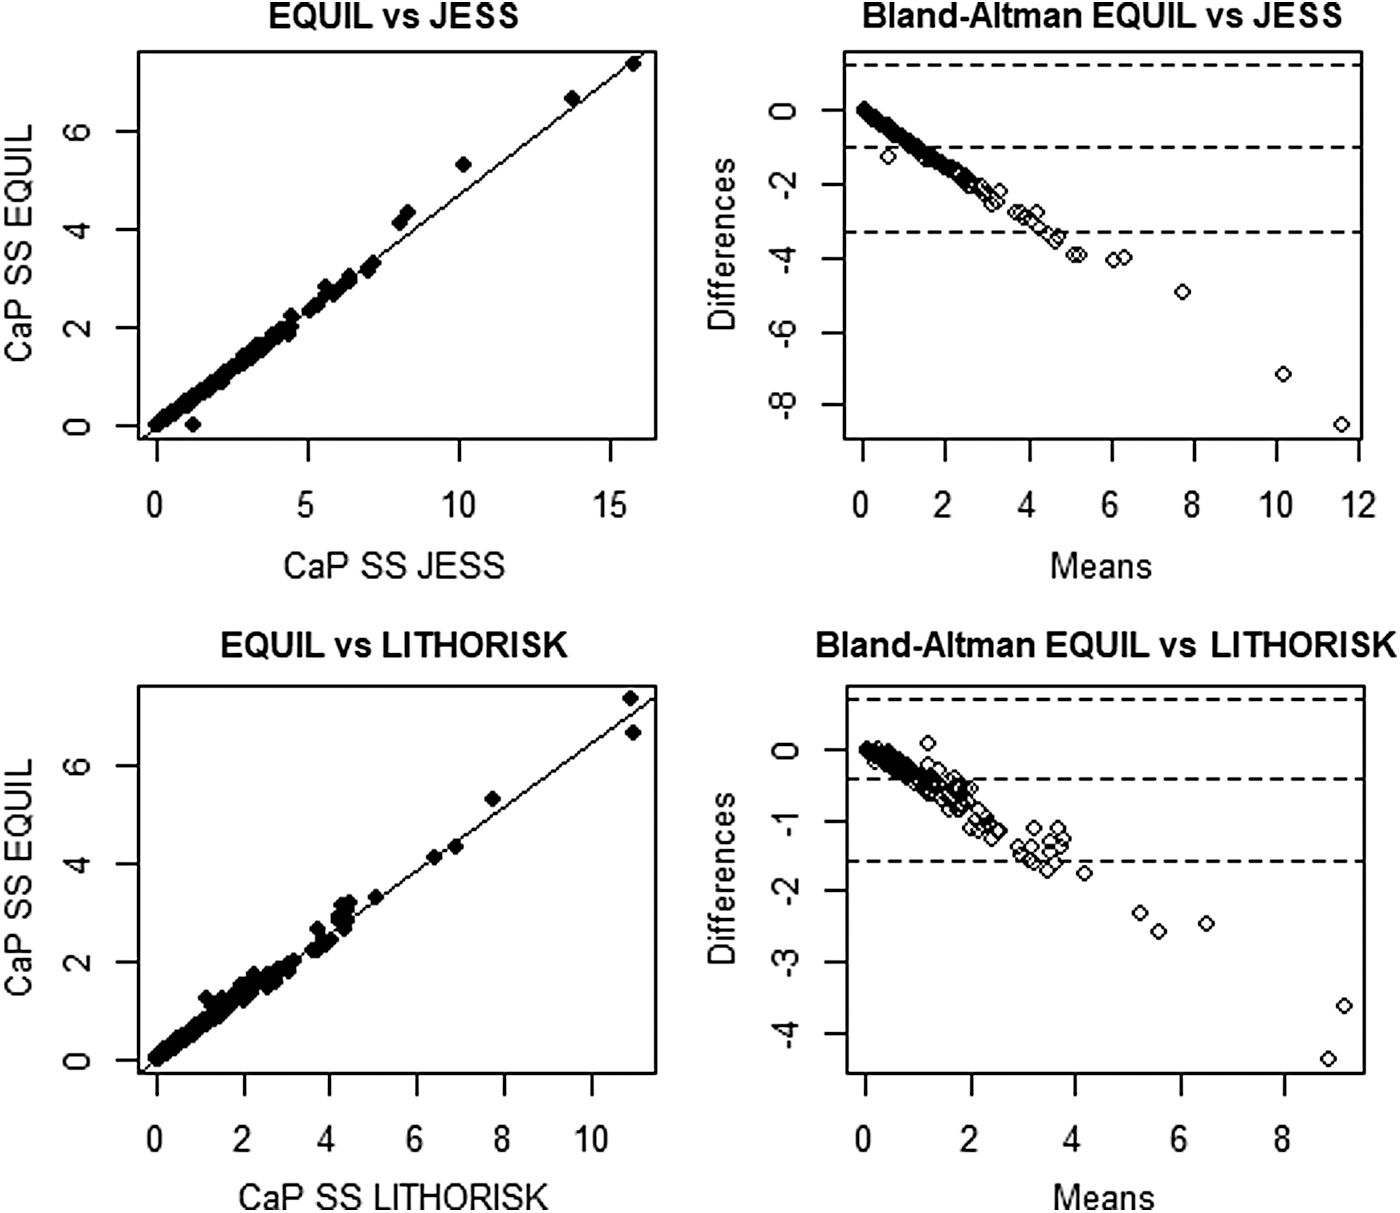
Scatterplots and Bland–Altman charts for CaP supersaturation SS(CaP) using outputs from EQUIL, JESS, and Lithorisk. CaP = calcium phosphate.
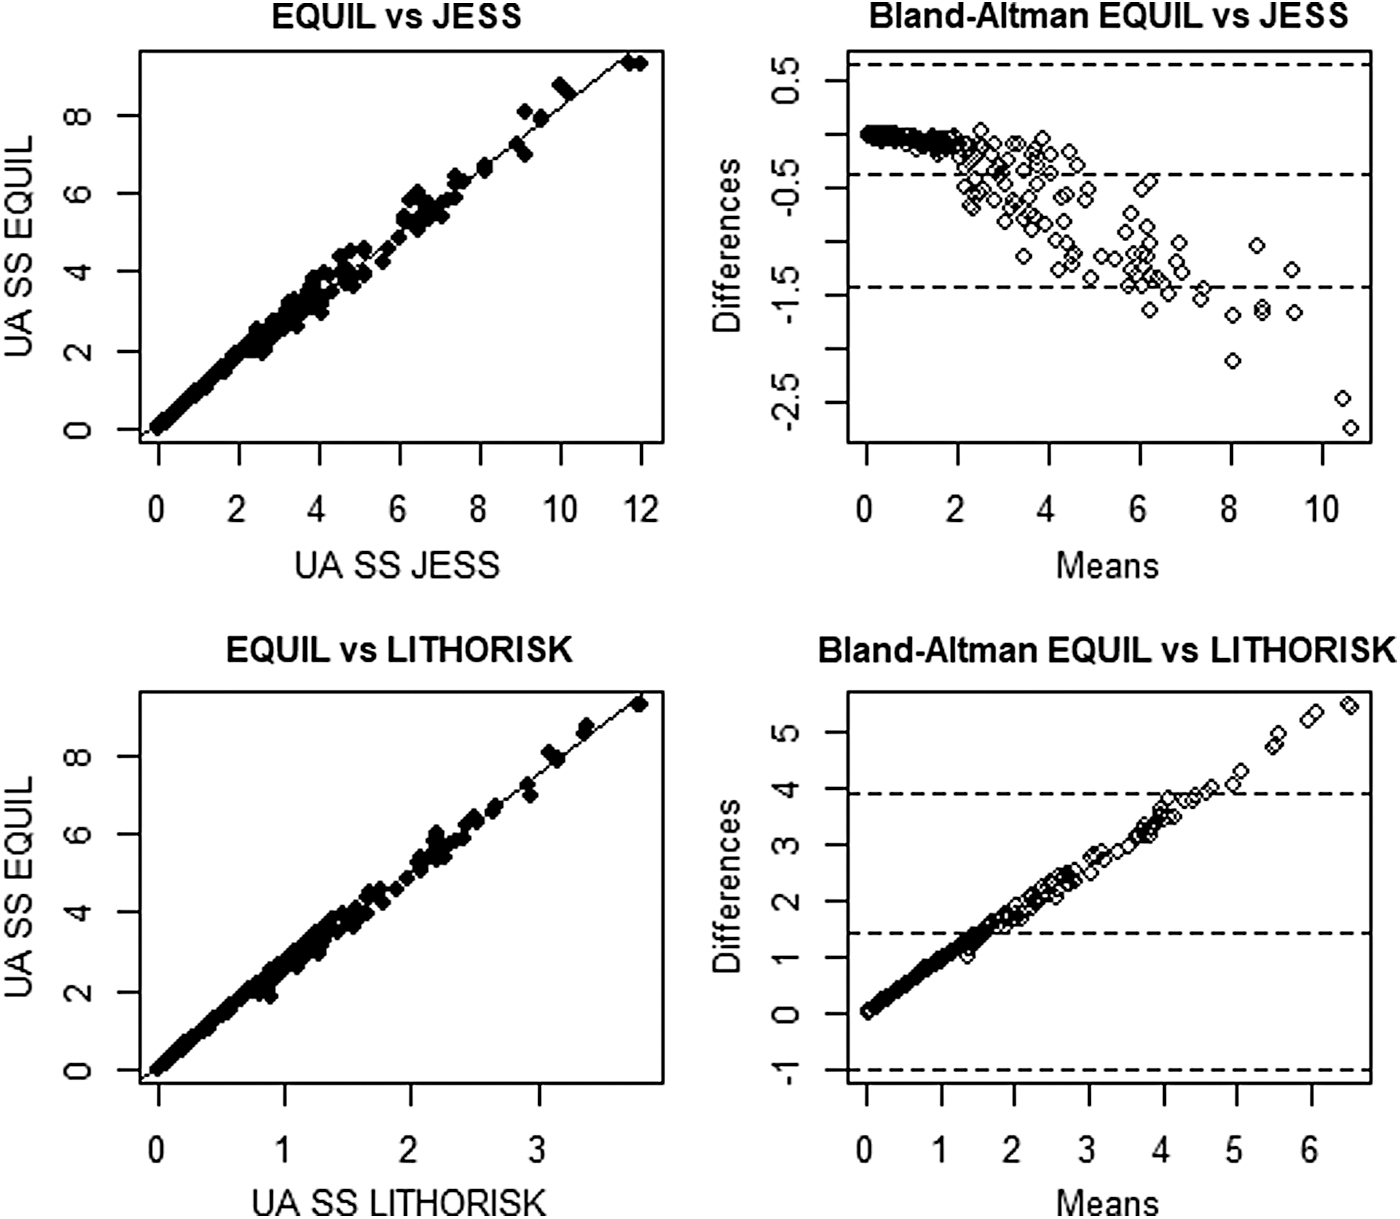
Scatterplots and Bland–Altman charts for uric acid supersaturation SS(UA) using outputs from EQUIL, JESS, and Lithorisk. UA = uric acid.
With regard to stone composition, 3D graphs were designed using the mean urinary SS provided by each program. Figure 5 represents the 3D graph using mean SS for CaOx, CaP, and UA obtained from EQUIL program along three axes and sorted according to stone type. The same pattern was observed using JESS and Lithorisk (Supplementary Figs. S1 and S2). Good correlation between stone composition and SS was observed in all 3D graphs included for mixed compositions.
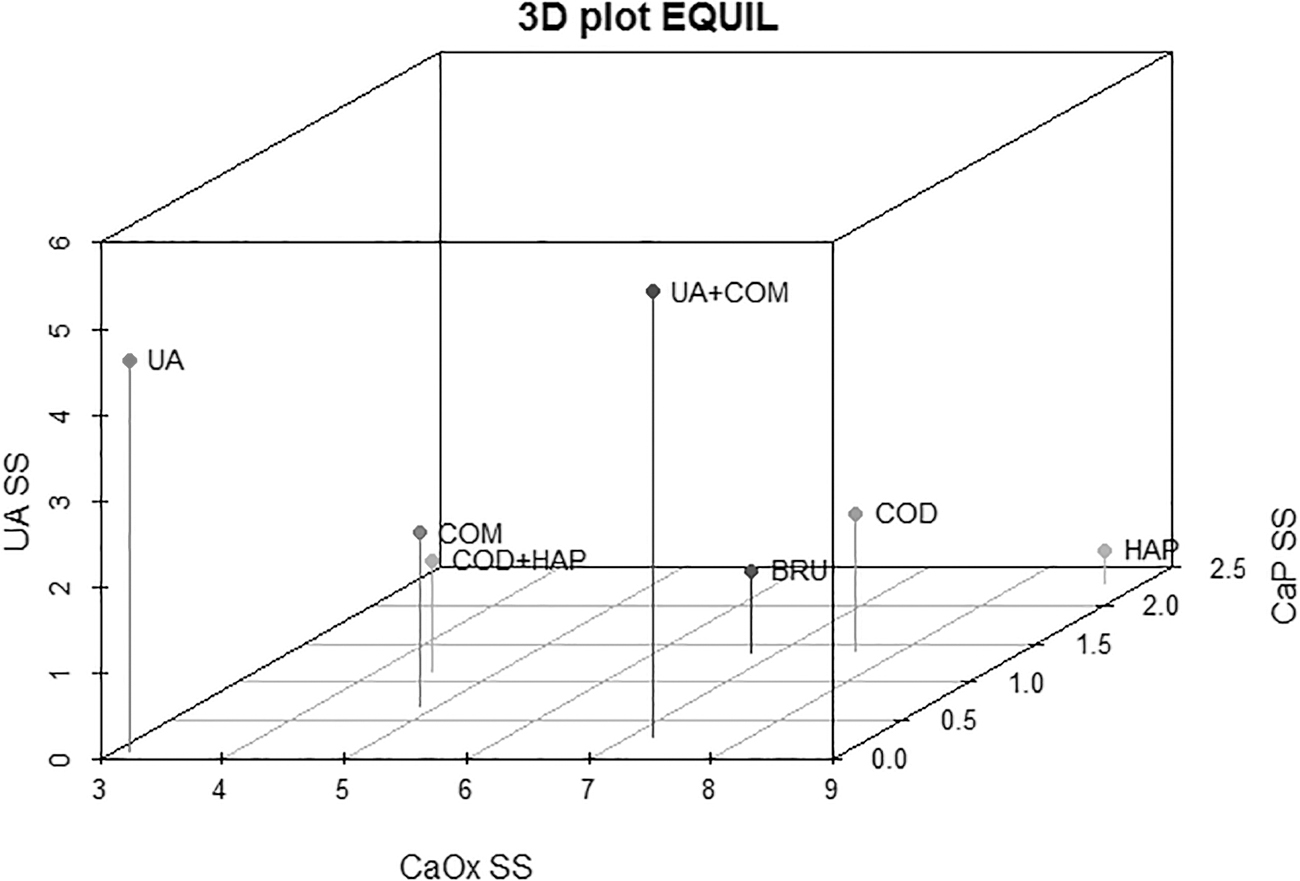
3D graph using supersaturation means for CaOx, CaP, and UA obtained from EQUIL program and sorted according to stone type. 3D = three-dimensional; BRU = brushite; COD = calcium oxalate dihydrate; COD+HAP: mixed HAP with COD; COM = calcium oxalate monohydrate; HAP = apatite; UA = uric acid; UA+COM: mixed UA with COM.
Fractional regression models were performed to evaluate the relationship between the percentage of each compound in the stone (COM, COD, BRU, HAP, or UA) and the relative SS from the three speciation programs (Table 2). CaOx SS values did not show a significant correspondence with the percentage of COM in the stones for any of the three programs as indicated by p-values >0.05. On the other hand, CaOx SS showed significant correspondence with the percentage of COD in the stones (p < 0.001) for all programs. Similarly, correspondence of BRU SS with the percentage of BRU and HAP in the stones was significant, as was that for UA SS and UA stones. The strongest correlations 25 occurred between UA SS and the percentage of UA in the stones (R 2 : 0.382, 0.433, and 0.413, respectively).
Fractional Regression Models to Evaluate the Relationship Between the Percentage of the Compound in the Stone and Supersaturation Obtained from All the Programs
CaOx = calcium oxalate; CaP = calcium phosphate; SS = relative supersaturation.
Discussion
The results of the present study are important for three reasons. First, we have shown good correlations between three programs, which are widely used for calculating urinary SS values. This has not been previously reported. The proportional bias between the methods revealed by our Bland–Altman charts for SS calculations demonstrates that the values generated are themselves not the same in all programs. We suspect that this anomaly is due to differences in the databases of the programs with respect to the number of complexes, which are cataloged and the validity of their respective thermodynamic stability constants. 18 The magnitude of each thermodynamic constant is crucial but may vary from one program to another, depending on whether the respective databases are regularly updated. Consequently, it has been argued that absolute SS values are of little importance and that relative values should be the focus of attention when making intergroup comparisons. 1 Because of this anomaly, we recommend that within any laboratory, the same in-house program should be used to compare SS values over time and across patients.
Our finding in the present study that AP(CaOx) 11 yielded very good correspondence with EQUIL disagrees with that of Ogawa and Hatano who reported a weak correlation in this regard. 16 However, the correspondence observed for AP(CaP) in our studied population was suboptimal.
In summary, we believe that our finding of good correlation between EQUIL, JESS, and Lithorisk will be reassuring to stone researchers who may be concerned about inconsistent results across programs. That the programs do not agree quantitatively is not important provided that individual centers remain consistent with their program of choice.
Second, we are aware of only one other study to have directly investigated the relationship between stone composition and SS. 19 In agreement with this previous study, a very good match was observed between stone type and urinary SS in our 3D plots. For example, pure UA stones corresponded with very high UA SS and low CaOx and CaP SS. On the other hand, mixed UA with COM stones corresponded with very high CaOx SS values besides high UA SS. This is consistent with the previous finding using EQUIL program. 19 Our results extend this finding to JESS and Lithorisk programs.
The third factor we highlighted in the present article is that we quantified the magnitude of the correspondence between stone composition and urinary SS using fractional regression models. Using these models, we found statistically significant associations for all our comparisons, except for that between the percentage of COM in the stone and CaOx SS. Also, COM stones were associated with lower CaOx SS values compared with COD stones in our 3D graphs. This is in accordance with previous analyses of large datasets from Daudon and colleagues, which demonstrated that COD stone formers tend to present with higher levels of calciuria compared with COM stone formers. 26 A possible explanation for the null association in COM stone formers could be the presence of more complex mechanisms involved in COM crystallization besides urinary SS, especially those regarding the role of the Randall's plaque and macromolecules, which represent important risk factors for the formation and growth of this type of stone. 27
We also found a strong association between the percentage of UA in the stone and the UA SS suggesting that such programs are very reliable for estimation of risk among UA stone formers. This is not surprising since the mechanism of UA crystallization is very well defined and mostly dependent on low urinary pH for SS and thus crystallization. 28 Although showing lower R2 values in their models, the same pattern was observed for CaP SS and the percentage of HAP in the stone, probably due to its dependence on high urine pH resulting in higher CaP SS. 29
Interestingly, although BRU stone formers also presented high CaOx SS values observed in our 3D graphs, the fractional regression models based on the percentage of BRU in the stone was also significant for CaP SS in all programs. This is in accordance with the recent findings of Dhayat and colleagues 30 suggesting not only one major factor for BRU stone formers, but also other complex mechanisms involving renal P leak associated with higher urinary calcium excretion. Many other synergies, not covered in our present study, are likely to be also at play.
We identified that most of our patients were recurrent stone formers. Supersaturation values in previous stone episodes were not available. As such, correlation of our supersaturations with values at first and subsequent episodes, as well as with the number of stone episodes per se were not feasible. Such correlations would have added value to our study.
Despite these limitations, we believe that the results of the present study are important for several reasons. First, only one study has previously investigated the relationship between stone composition and urinary saturation. As such, our findings are of interest ab initio. Second, unlike the previous study, the test group in our analysis predominantly comprised recurrent stone formers and the urines in our study were analyzed 2 to 3 months after each patient's stone event, rather than immediately after. Given these conditions, our findings suggest that stone recurrence in our test group might be related to ongoing urinary pathogenic factors, which prevail and can be detected long after the stone episode per se. Our finding that different programs present good correspondence in their outputs is reassuring to stone researchers who may be concerned about inconsistencies between such programs.
Conclusion
Good correlation between EQUIL, JESS, and Lithorisk was observed. Our demonstration of the relationship between stone composition, urine composition, and clinical pathogenic factors lends confirmation to the importance of these analyses in stone work-up and research. The magnitude of the association between the type of the stone and the SS values demonstrated by fractional regression models strengthens the evidence for applying SS in stone field.
Footnotes
Author Contributions
A.R.: Study design, data analysis, article writing and review, and final approval; T.D.S.C.: study design, data extraction, article writing and review, and final approval; A.L.R.: study design, article writing and review, and final approval; G.G.: study design, article review, and final approval; P.M.F.: study design, data analysis, article writing and review, final approval, and supervision.
Acknowledgments
The author is grateful to “Fundación Alfonso Martín Escudero” for the funding of a postdoctoral fellowship. The author thanks the South African National Research Foundation, the South African Medical Research Council, and the University of Cape Town for research funding.
Author Disclosure Statement
P.M.F. is a consultant for BioHealth Italia (developers of Lithorisk software). The rest of the authors have no conflict of interests.
Funding Information
No funding was received for this article.
Supplementary Material
Supplementary Figure S1
Supplementary Figure S2
Abbreviations Used
References
Supplementary Material
Please find the following supplemental material available below.
For Open Access articles published under a Creative Commons License, all supplemental material carries the same license as the article it is associated with.
For non-Open Access articles published, all supplemental material carries a non-exclusive license, and permission requests for re-use of supplemental material or any part of supplemental material shall be sent directly to the copyright owner as specified in the copyright notice associated with the article.
