
Abstract
Background:
Renal-cell carcinoma is the most common kidney cancer and the 13th most common cause of cancer death worldwide. Partial nephrectomy and percutaneous ablation, increasingly utilized to treat small renal masses and preserve renal parenchyma, require precise preoperative imaging interpretation. We sought to develop and evaluate a convolutional neural network (CNN), a type of deep learning (DL) artificial intelligence (AI), to act as a surgical planning aid by determining renal tumor and kidney volumes through segmentation on single-phase CT.
Materials and Methods:
After Institutional Review Board approval, the CT images of 319 patients were retrospectively analyzed. Two distinct CNNs were developed for (1) bounding cube localization of the right and left hemiabdomen and (2) segmentation of the renal parenchyma and tumor within each bounding cube. Training was performed on a randomly selected cohort of 269 patients. CNN performance was evaluated on a separate cohort of 50 patients using Sorensen–Dice coefficients (which measures the spatial overlap between the manually segmented and neural network-derived segmentations) and Pearson correlation coefficients. Experiments were run on a graphics processing unit-optimized workstation with a single NVIDIA GeForce GTX Titan X (12GB, Maxwell Architecture).
Results:
Median Dice coefficients for kidney and tumor segmentation were 0.970 and 0.816, respectively; Pearson correlation coefficients between CNN-generated and human-annotated estimates for kidney and tumor volume were 0.998 and 0.993 (p < 0.001), respectively. End-to-end trained CNNs were able to perform renal parenchyma and tumor segmentation on a new test case in an average of 5.6 seconds.
Conclusions:
Initial experience with automated DL AI demonstrates that it is capable of rapidly and accurately segmenting kidneys and renal tumors on single-phase contrast-enhanced CT scans and calculating tumor and renal volumes.
Introduction
Renal-cell carcinoma (RCC) is the most common kidney cancer and the 13th most common cause of cancer death worldwide, 1 with an estimated 74,000 new cases and 15,000 deaths each year in the United States. 2 RCC remains largely diagnosed incidentally. 3 With increased utilization of medical imaging, mainly CT, incidental RCC diagnoses occur more frequently, at smaller tumor sizes, and with improved prognosis. 4 Nevertheless, up to a third of patients have metastases at initial presentation and in patients with localized disease, recurrence after surgical resection occurs in 20%–40% and carries a poor prognosis. 5,6
Surgical intervention with partial or radical nephrectomy and percutaneous ablation are the only treatments for definitive cure. 7,8 With both extirpative and ablative techniques, surgical planning is based on axial imaging, which enables assessment of target lesion, delineation of blood vessels, evaluation of presence of metastases or tumor thrombi, and definition of adjacent organs. 9 Successful surgical intervention is dependent on surgeons' understanding of the local anatomy. Recently, Tapiero and colleagues 10 demonstrated that even experienced surgeons have limited ability to discern renal anatomy precisely. As such, there is clear need for novel technologies to facilitate image interpretation.
Artificial intelligence (AI) tools could streamline preoperative image evaluation. AI assumes that the process of human thought can be mechanized. 11 Deep learning (DL), a type of AI, can generate a program from data and its own output. A specific DL architecture called a convolutional neural network (CNN) has gained momentum in digital image processing. 12 CNNs approximate the visual cortex by layering digital simulations of neuronal architecture in a feed-forward manner, such that, with each pass through a layer, the input is rendered into a more abstract depiction. 13 These abstractions allow for unsupervised learning and autonomous selection of image feature maps while training.
Initial studies of CNNs for segmenting the kidney, detecting lesions, and segmenting lesions have shown promising results. 14 –16 In 2019, a public dataset of annotated multiphasic CT scans with segmented kidneys and renal lesions was made available as part of the International Conference on Medical Image Computing and Computer-Assisted Intervention Kidney Tumor Segmentation (KiTS) Challenge. This challenge yielded excellent results, with winning mean Dice scores (a measure of overlap between AI prediction and ground truth) of 0.97 for kidney segmentation and 0.85 for tumor segmentation. 17 While impressive, these results rely strictly on the KiTS dataset, which came from a single institution and may not be generalizable to different patient populations or applicable to more commonly obtained single-phase CT examinations.
In the current study, we propose a DL model for kidney and tumor segmentation and individual volume determination for RCC on single-phase CT images. We aim to employ AI as a clinical adjunct to preoperative planning, especially for the lesion volume to kidney volume ratio. Current three-dimensional (3D) postprocessing software to accurately evaluate kidney and lesion volumes is cumbersome, manual, and time consuming. As such, we sought to evaluate a CNN to streamline the task of evaluating the lesion volume to kidney volume ratio.
Materials and Methods
Patients, Cohorts, and Annotation
The University of California, Irvine (UCI) Institutional Review Board approved this study. Patients came from two separate sources: UCI Medical Center (UCIMC) and the KiTS open-source dataset, which comprised patients from the University of Minnesota Medical Center (UMMC). A total of 319 patients were used: 109 consecutive patients from UCIMC between May 1, 2013 and May 1, 2017 and 210 patients from UMMC between 2010 and 2018. Inclusion criteria were patients who underwent partial or radical nephrectomy for one or more kidney tumors. Exclusion criteria were patients who had (1) unavailable venous-phase imaging and (2) tumor thrombus that extended beyond the primary site and had ambiguous boundaries. To achieve uniformity in protocols between UCIMC and UMMC-KiTS data, this study only utilized venous-phase images of either dataset.
Patients from UCIMC and UMMC were combined and then randomly assigned to training, validation, and test cohorts. The training and validation sets consisted of 269 patients. After algorithm convergence and hyperparameter optimization, final top-performing models were evaluated using the final 50 patient (100 individual kidneys) test set.
For data annotation, the highest resolution venous-phase series was subsampled to a slice thickness of 3 mm. After manual voxel-level annotation of both renal parenchyma and tumor, segmentation masks were resampled back to the original acquisition resolution using simple linear interpolation and a 3 × 3 × 3 kernel Gaussian blur. This strategy improved overall annotation speed and reproducibility. Annotators had access to both radiology and pathology reports to facilitate accurate localization of tumors and exclusion of cysts. Annotations were performed by medical students, radiology residents, and abdominal imaging fellows under direct supervision of an abdominal imaging board-certified radiologist at UCIMC (Roozbeh Houshyar) and an experienced fellowship-trained urologic oncologist who specializes in kidney tumors at UMMC (Christopher Weight). 17
Algorithm overview
Two separate CNN algorithms were created for: (1) bounding cube localization of the right and left hemiabdomen and (2) segmentation of renal parenchyma and tumor within each individually cropped hemiabdomen (Supplementary Figs. S1 and S2). This two-step strategy improved consistency of the algorithm input field-of-view (e.g., original raw volumes comprised variable craniocaudal coverage) and facilitated a full 3D segmentation architecture (i.e., original full-resolution volumes cannot readily fit into a graphics processing unit [GPU] memory).
Step one: Hemiabdomen localization
Our CNN-based algorithm used full original acquisition volume to localize the right and left hemiabdomen bounds. The hemiabdomen field-of-view was defined to include anywhere kidney and associated tumor may feasibly be located. Approximate boundaries included lateral, anterior, and posterior abdominal wall; ipsilateral vertebral body margin; inferior-most hemidiaphragm; and superior pelvic wing.
The algorithm was implemented as a binary two-dimensional (2D) CNN classifier that was trained to recognize whether a given 256 × 256 image slice contained part of either hemiabdomen (Fig. 1). A total of 18 convolutional layers were used, each with a filter size of 3 × 3, with a progressive increase in channel depth from 16 to 48. Subsequently, the final feature map was flattened, and a fully connected matrix multiplication layer was used to map to final logit scores. Subsampling was mediated through strided convolutions without pooling. The leaky rectified linear unit (Leaky ReLU) was used as an activation function. Batch normalization was added after each convolutional layer and before the activation function.
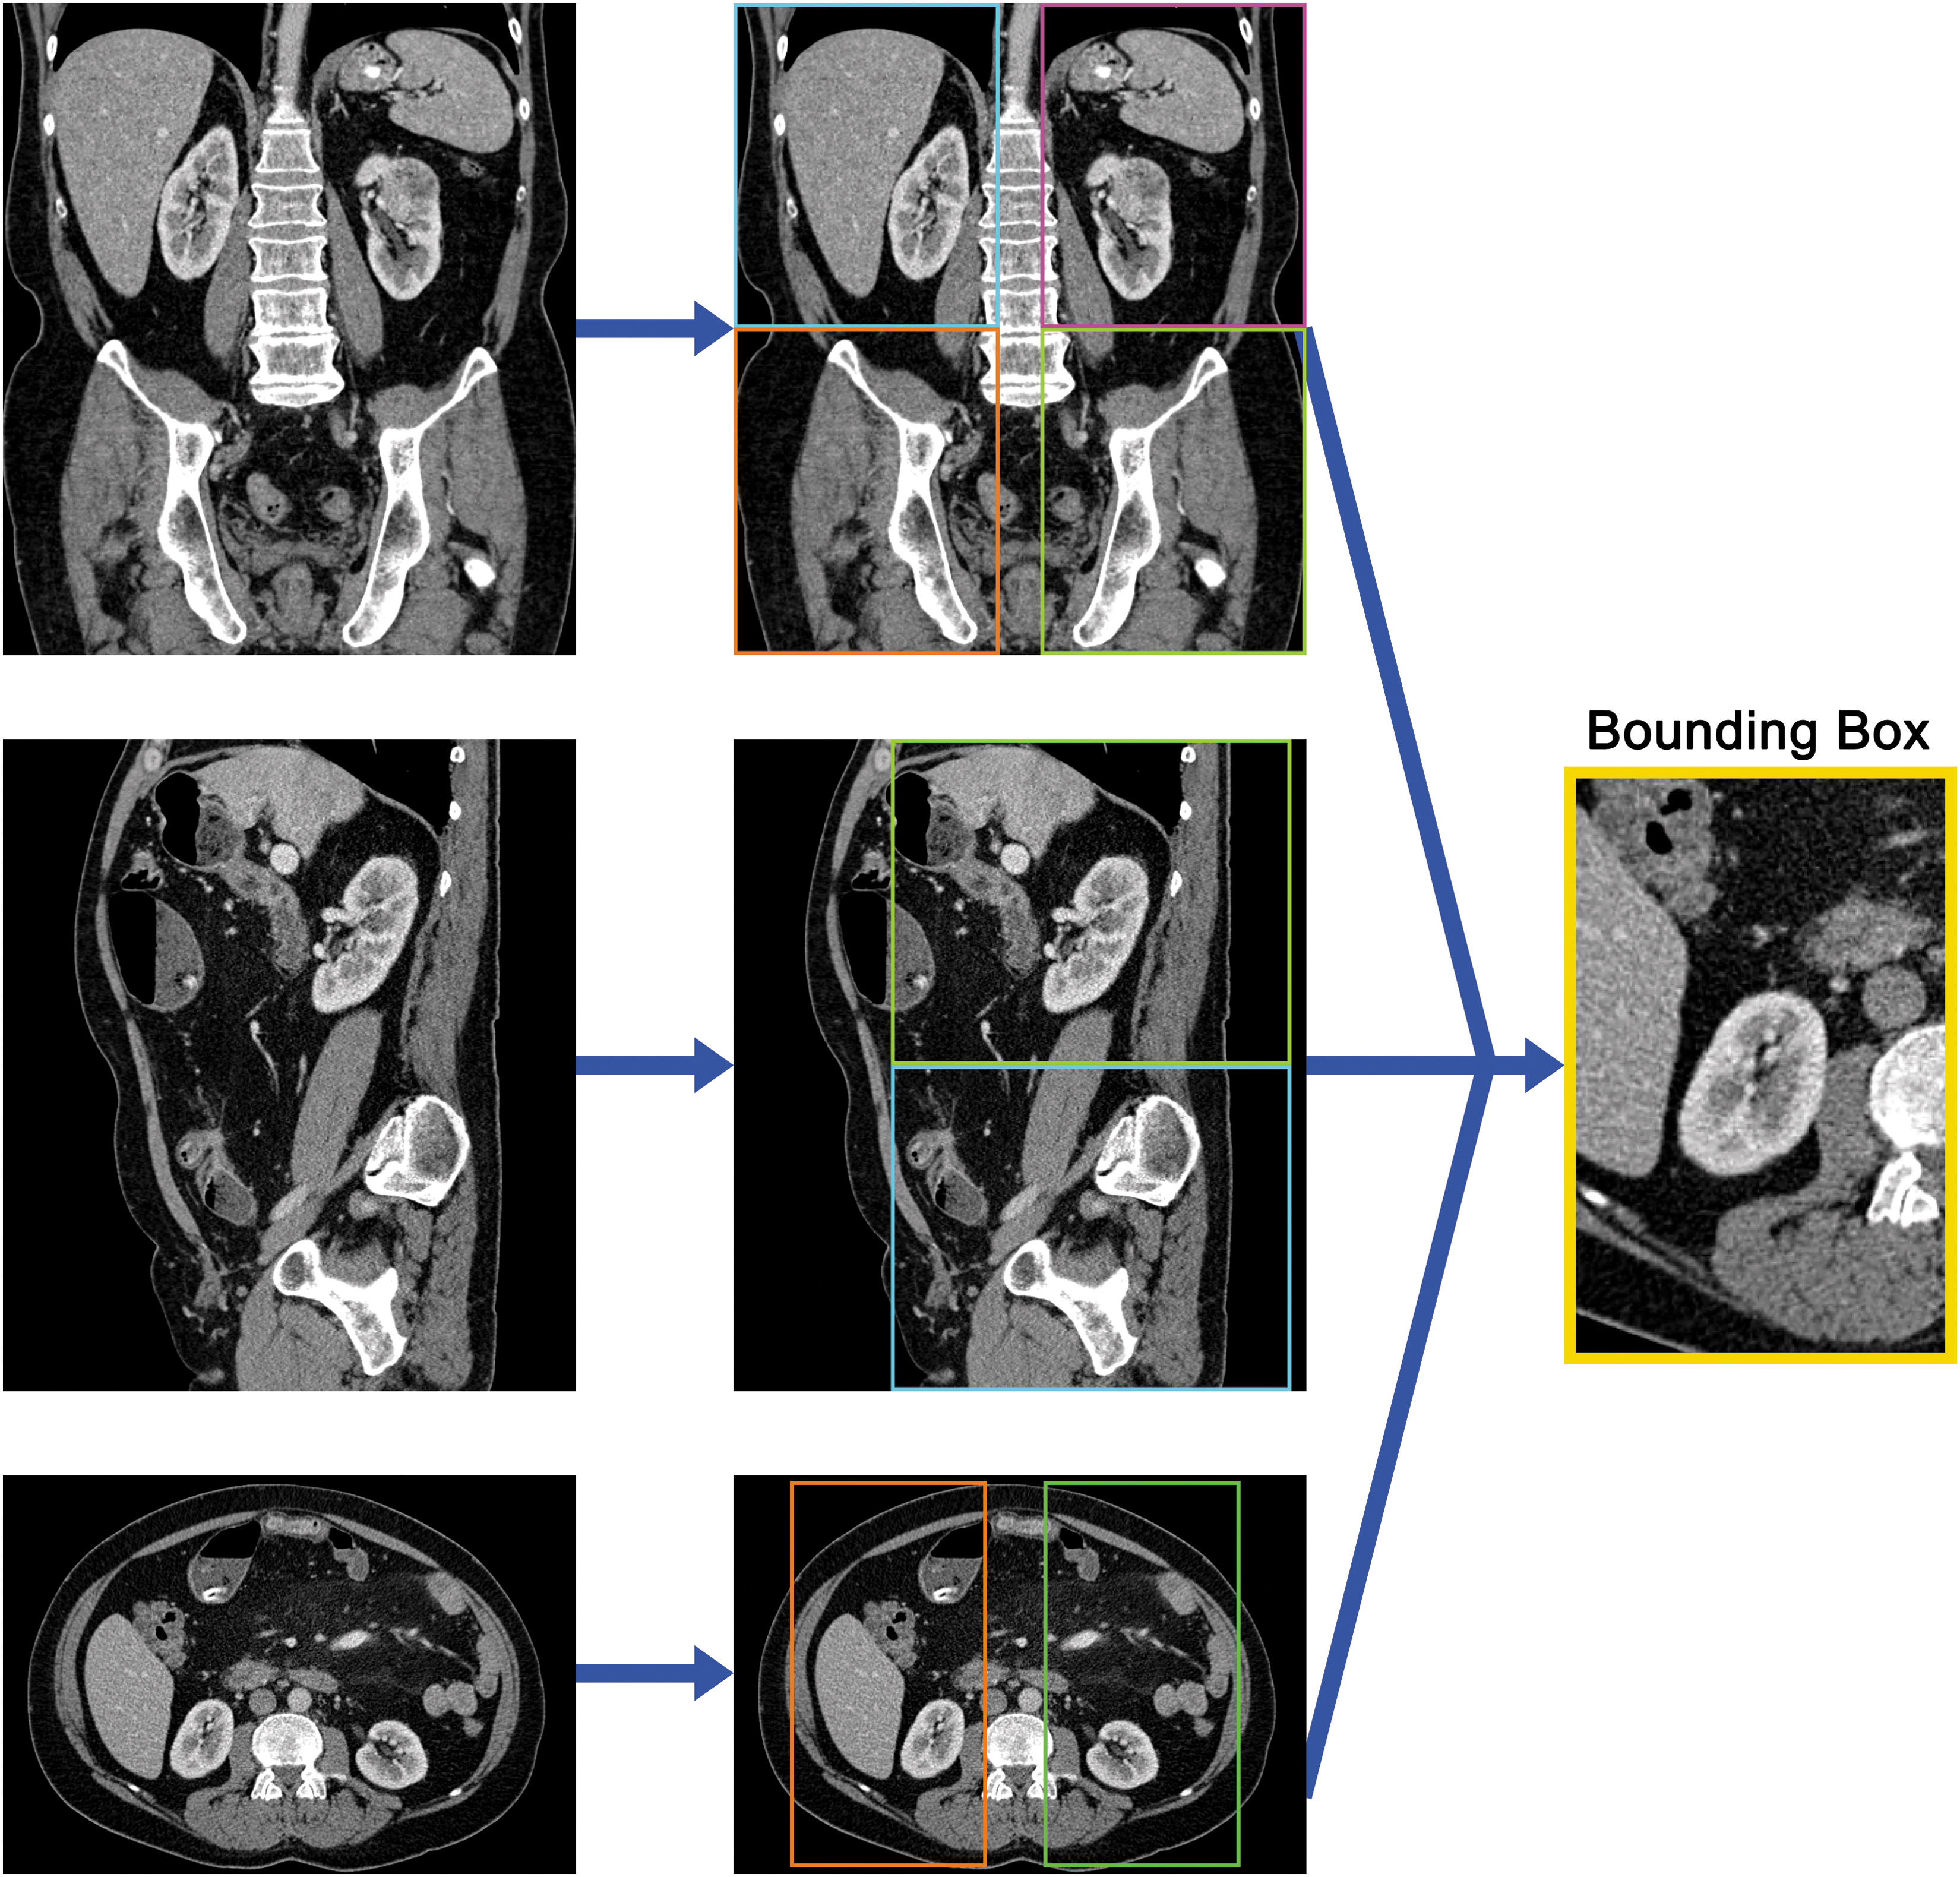
Bounding boxes. To identify a bounding box around the kidney and its associated tumor, three CNN classifiers were trained on coronal, sagittal, and axial orientations. CNN = convolutional neural network.
As input, the algorithm used slices reconstructed in all three orientations (axial, coronal, and sagittal). Based on these orthogonal prediction vectors, final bounds of the right and left hemiabdomen were propagated in all three dimensions.
Step two: Parenchyma and tumor segmentation
Next, our CNN-based algorithm used individually cropped volumes of the right and left hemiabdomen to perform voxel-level segmentation of normal renal parenchyma and tumor. The algorithm was implemented as a 3D fully convolutional contracting/expanding CNN classifier that was trained to map a 96 × 96 × 96 input volume to a corresponding 96 × 96 × 96 output mask (Fig. 2). A total of 19 convolutional layers were used, each with a filter size of 3 × 3, with a progressive increase in channel depth from 16 to 48. Skip connections were implemented using residual (addition) operations instead of concatenations. Subsampling was mediated through strided convolutions without pooling. Leaky ReLU was used as an activation function. Batch normalization was added after each convolutional layer and before the activation function.
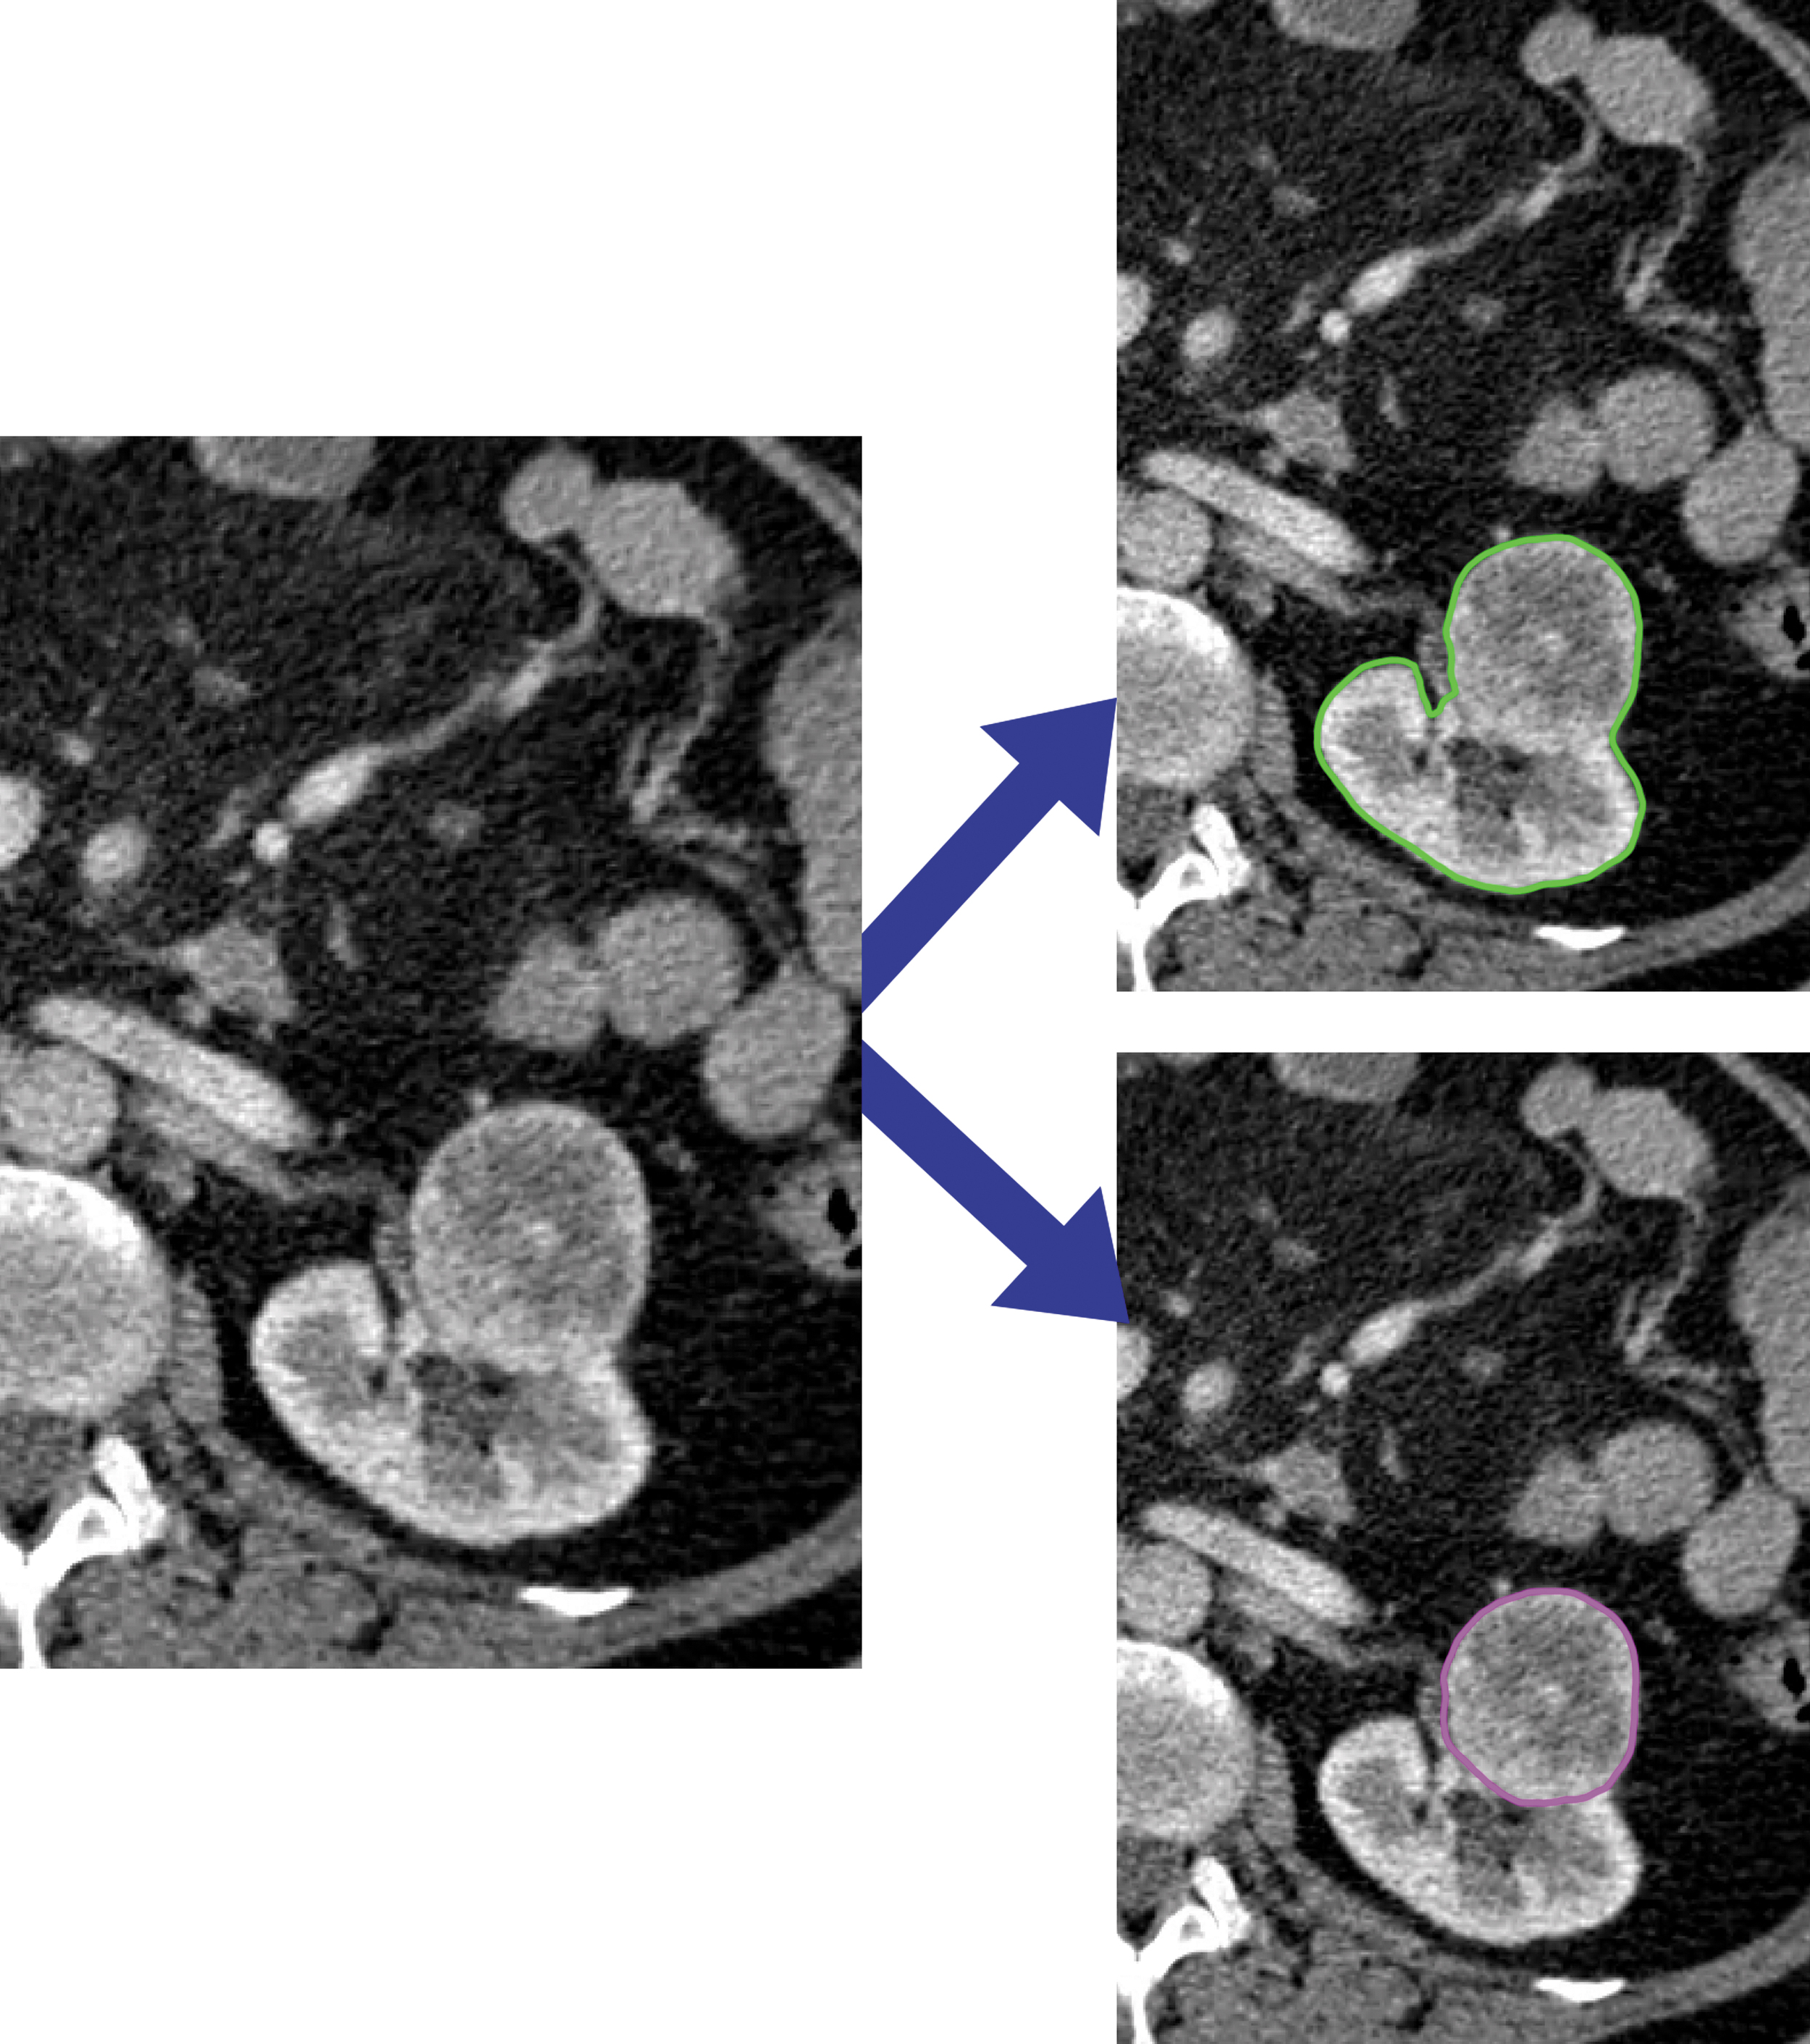
Renal parenchyma and tumor segmentation. This CNN was trained on the bounding boxes that were created previously (Fig. 1). It classified each voxel as renal parenchyma, renal tumor, or background.
Data preprocessing and augmentation
For the first step, all data were resampled to an isotropic volume with a matrix size of 256 × 256 × 256. As described above, input 2D images were reconstructed from axial, coronal, and sagittal slices for this volume. For the second step, cropped volumes of the right and left hemiabdomen were resampled to an isotropic volume with a matrix size of 96 × 96 × 96.
Real-time data augmentation was applied during training to improve model generalizability. These strategies included: Application of random affine transformation resulting in random scaling (80%–120%), rotation (−30° to +30°), and translation (−16 to +16 voxels). Addition of random offset i on the interval of −10 to 10 HU to each input volume. Addition of random Gaussian image noise applied independently at each voxel location, modeled with a distribution mean (μ) of 0 HU and variable standard deviation (σ) chosen randomly on an interval of 0 to 10 HU (i.e., 0 = no image noise; 10 = maximum image noise).
Data postprocessing
Using 3D connected components analysis, the largest contiguous mask for each individual right and left kidney (defined as the composite of any region containing renal parenchyma or tumor) was retained. After final prediction of renal parenchyma and tumor, each cropped right and left segmentation mask was resampled back to the original acquisition resolution using simple linear interpolation and a 3 × 3 × 3 kernel Gaussian blur.
Implementation details
The CNN was trained from random weights initialized using the heuristic described by He and coworkers 18 Gradients for backpropagation were estimated using the Adam optimizer, an algorithm for first-order gradient-based optimization of stochastic objective functions based on adaptive estimates of lower-order moments. 19 An initial learning rate of 2–4 was used and annealed (along with an increase in minibatch size) whenever a plateau in training loss was observed.
Software code was written in Python 3.5 using the open-source TensorFlow r1.9 library (Apache 2.0 license). 20 Experiments were performed on a GPU-optimized workstation with a single NVIDIA GeForce GTX Titan X (12GB, Maxwell architecture).
Statistical analysis
The primary endpoint was the algorithm's ability to accurately estimate renal parenchyma and tumor segmentation masks. Renal parenchyma mask was defined as any region containing either normal kidney or tumor. Tumor mask was defined as the isolated tumor mask itself.
Statistical analysis was run for the test set cohort only, with significance set as p-value <0.05. The CNN-generated mask accuracy was evaluated using three metrics. First, predicted binary masks of renal parenchyma and tumor were individually compared with manual segmentations using a Dice score coefficient:
Second, CNN-predicted volumes of renal parenchyma and tumor were compared with operator-annotated volumes using Pearson correlation coefficient (r).
Results
Kidney and renal tumor characteristics
The median, mean, standard deviation, minimum, and maximum for kidney size and tumor size are detailed in Table 1.
Characteristics of Kidney and Tumor Volume by Site
KiTS = Kidney Tumor Segmentation; UCIMC = UCI Medical Center; UMMC = University of Minnesota Medical Center.
Renal detection and parenchymal segmentation
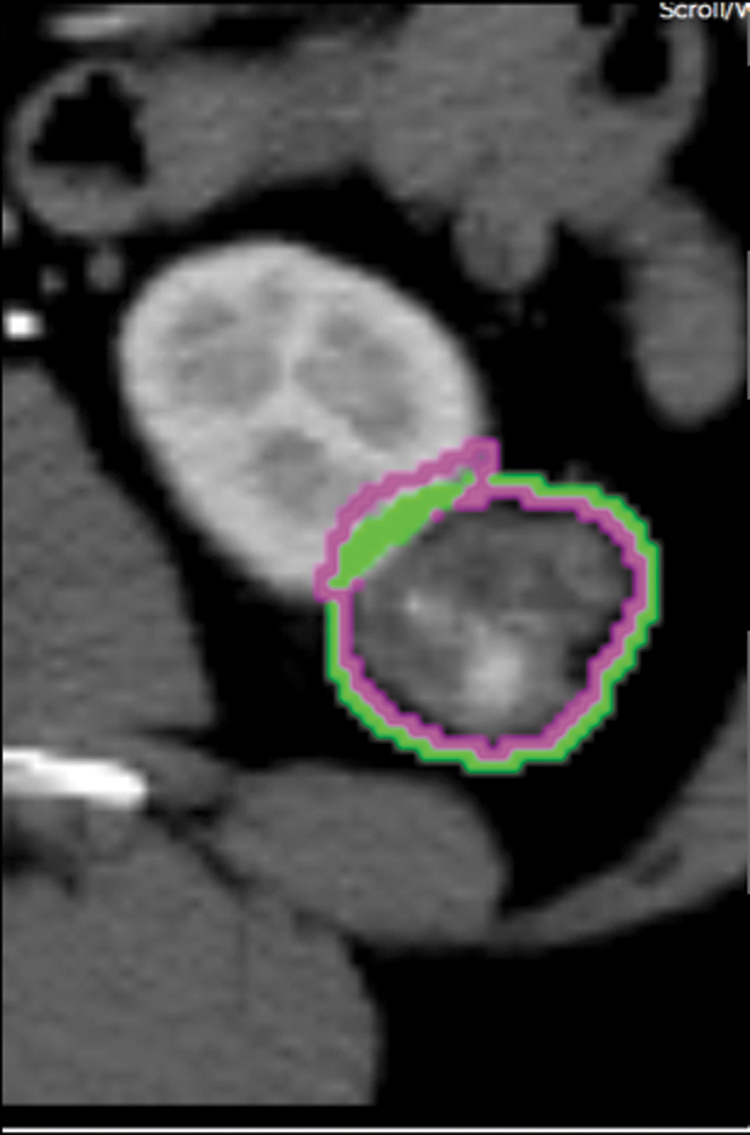
Final Dice score median, mean, and standard deviation for renal parenchyma segmentation were 0.970, 0.960, and 0.032, respectively (Fig. 3). Renal segmentation Dice score distribution for the validation set ranged from 0.91 to 0.99 (Fig. 4). Pearson correlation coefficient of CNN-derived estimates of renal parenchyma volume against gold-standard human annotations was 0.998 (p < 0.001).

Kidney segmentation. An illustration of a Dice score of 0.93 for the slice is shown. Green is the ground truth annotation. Purple is the CNN's prediction.
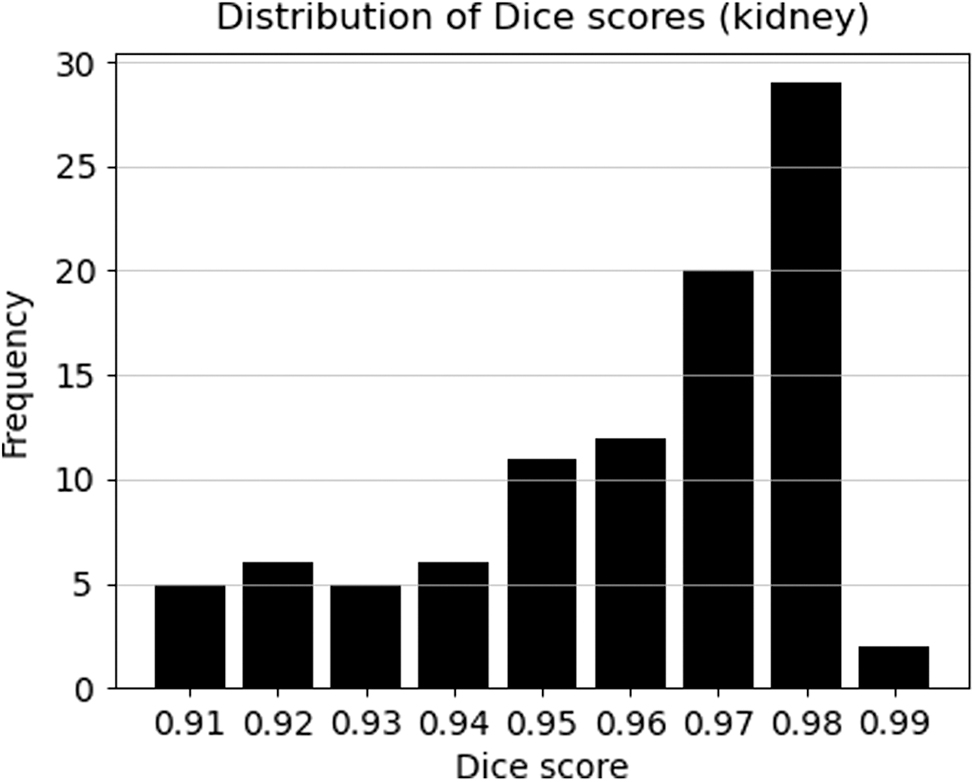
Dice score distribution for kidneys on the validation set. The Dice score for renal segmentation ranged between 0.91 and 0.99.
Tumor detection and segmentation
Dice score median, mean, and standard deviation for tumor segmentation were 0.816, 0.591, and 0.366, respectively (Fig. 5). The distribution of Dice scores was skewed to the left with a wide range (Fig. 6). Pearson correlation coefficient of CNN-derived estimates of tumor volume against gold-standard human annotations was 0.993 (p < 0.001).
Renal tumor segmentation. An illustration of a Dice score of 0.62 for the slice is shown. Green is the ground truth annotation. Purple is the CNN's prediction.
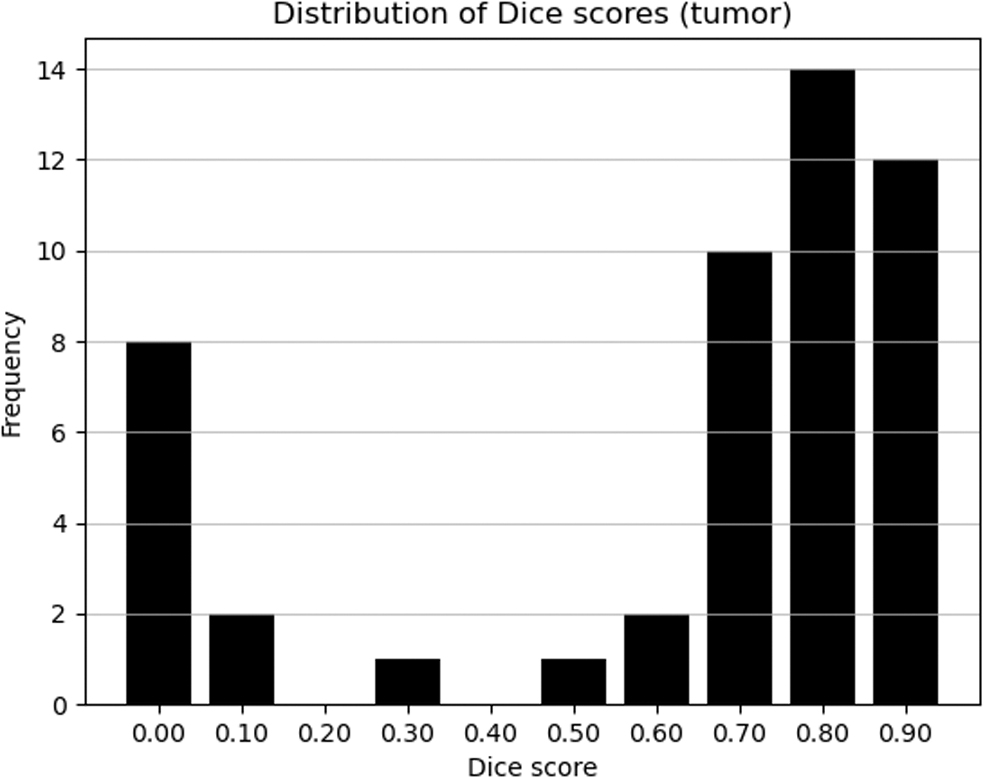
Dice score distribution for tumors on the validation set. Dice scores for tumor segmentation were skewed in both directions with a wide range.
Network statistics
The CNNs for both bounding cube localization and segmentation trained for ∼100,000 iterations before convergence. The end-to-end trained CNN performed renal parenchyma and tumor segmentation on a new test case in an average of 5.6 seconds.
Discussion
We created an AI framework capable of accurately segmenting kidneys and renal tumors on single-phase contrast-enhanced CT scans, with median Dice scores of 0.97 and 0.81 for renal and lesion segmentation, respectively. These results imply that our CNN could automate certain components of preoperative evaluation for RCC, including delineating kidney from tumor and outlining the boundary separating kidneys from adjacent organs. It also automatically extracts tumor and renal volumes, and mimics a reading radiologist, as Pearson correlation coefficients were significantly high for both renal and tumor volumes. Therefore, it has the potential to automate these measurements and programmatically automatically generate the lesion volume to kidney volume ratio, an essential value for preoperative planning.
The lesion volume to kidney volume ratio can be calculated multiple ways, 21 –24 and CT-based methods overestimate tumoral dimensions. 25 Our AI framework solves this problem and streamlines volumetric evaluation of renal tumors and normal renal parenchyma. Knowledge of these key volumes guides treatment decision making, surgical planning, and follow-up. 26 It also acts as a predictor of survival 27 and residual glomerular function. 24 Additionally, volumetric assessment is integral to targeted radiotherapy administration, 28 which allows for delivery of higher relative density to affected tissues without collateral damage to surrounding renal parenchyma. 29 Our CNN's renal segmentation feature coupled with lesion segmentation would describe the exact location and volume of the lesion juxtaposed with normal renal parenchyma. This capability is fundamental to optimizing radiotherapy delivery.
Our results extend and build upon existing literature regarding AI evaluation of RCC. Although other groups have performed renal segmentation with CNNs, their work is limited by suboptimal training data, which does not reflect the heterogeneity of clinical practice. 16,17,30 Therefore, their mathematically impressive results (high Dice scores) often do not translate into high accuracy when tested on clinical datasets. Additionally, studies utilizing small single-center datasets often fall victim to overfitting, where memorization of data and lack of heterogeneity in training or testing leads to flawed unrealistically high accuracy models. These models do not perform well on new data. In contrast, we believe the clinically diverse training data and large training set used to create our model represents a better approximation of real-world renal imaging.
Prior work by Skalski and coworkers 30 employed CNN feature vectors for kidney tumor detection and segmentation on CT data. They reported a Dice score of 0.85 for tumor segmentation but had a small sample size of five patients, which likely limited their model by overfitting. Our study used 319 patients to reduce the risk of overfitting and increase clinical generalizability. Jackson and colleagues 16 applied a single 3D CNN to detect contours of the left and right kidney on noncontrast CT scans with excellent results (mean Dice score 0.91 and 0.86 for right and left kidneys, respectively). However, their CNN performed poorly when presented with cystic kidneys, which limits clinical application of this model, given the clinical prevalence of renal cysts. Conversely, our AI framework was trained and tested with a large dataset of morphologically mixed kidneys, including cystic kidneys, to simulate a more realistic clinical setting. Even with a more morphologically complex dataset, our model performed highly accurate renal segmentation (mean Dice score 0.96).
The KiTS Challenge produced high Dice scores for kidney and lesion segmentations (mean Dice scores 0.97 and 0.85, respectively). 17 However, it was predicated on a single dataset, curated for competition purposes. These data comprised multiphasic imaging and did not assess volumetric correlation, which limits clinical applicability of models developed using it. In contrast, our CNN framework was developed using a noncurated dataset of single-phase contrast-enhanced CT scans obtained from two different medical centers. Because of broad inclusion criteria, our dataset comprised morphologically varied tumors.
The increased variety of tumors in our dataset yielded skewed tumor detection and segmentation results. This is presented in a histogram of our validation tumor segmentation Dice scores (Fig. 6). The difference in median and mean Dice scores is likely attributable to the presence of outlier complex cystic lesions that were misinterpreted as solid renal lesions, resulting in low Dice scores. These cystic lesions were seen at a higher rate in the UCIMC clinical dataset. Upon further inspection, 5 out of the 10 validation set cases with Dice score of <0.20 (50%) were from the UCIMC cohort; however, UCIMC accounted for only one-third of the dataset. These differences in training cases likely play a significant role in the lower Dice scores for kidney lesions in the combined dataset.
Another factor that impacted our algorithm performance was variability of tumor size. The range of tumor sizes from the UCIMC cohort was wider (Table 1), and on average the UCIMC tumors were larger than the UMMC-KiTS cohort (median tumor volume 23.115 cm3 vs 3.558 cm3, respectively). When comparing the two cohorts, the UMMC-KiTS cohort demonstrates more uniformity across tumor volumes (standard deviation 318.869 cm3 at UCIMC vs 14.774 cm3 at UMMC-KiTS). These differences in tumor sizes reflect real-world clinical variability in renal masses and highlight the importance of using noncurated clinical datasets in developing and training AI algorithms.
Tumors that were either extremely small or very large were relatively more difficult to detect by our model. In fact, some tumors in this category were missed altogether. By their nature, small tumors are more subtle, making them harder to detect (Fig. 7). Large tumors present a different challenge as they may leave little or no normal renal tissue for context (Fig. 8). While failure to detect large tumors will likely have minimal clinical impact as they are readily recognized by radiologists, small tumors present a significant perceptual challenge and will require future research before they can be reliably identified.
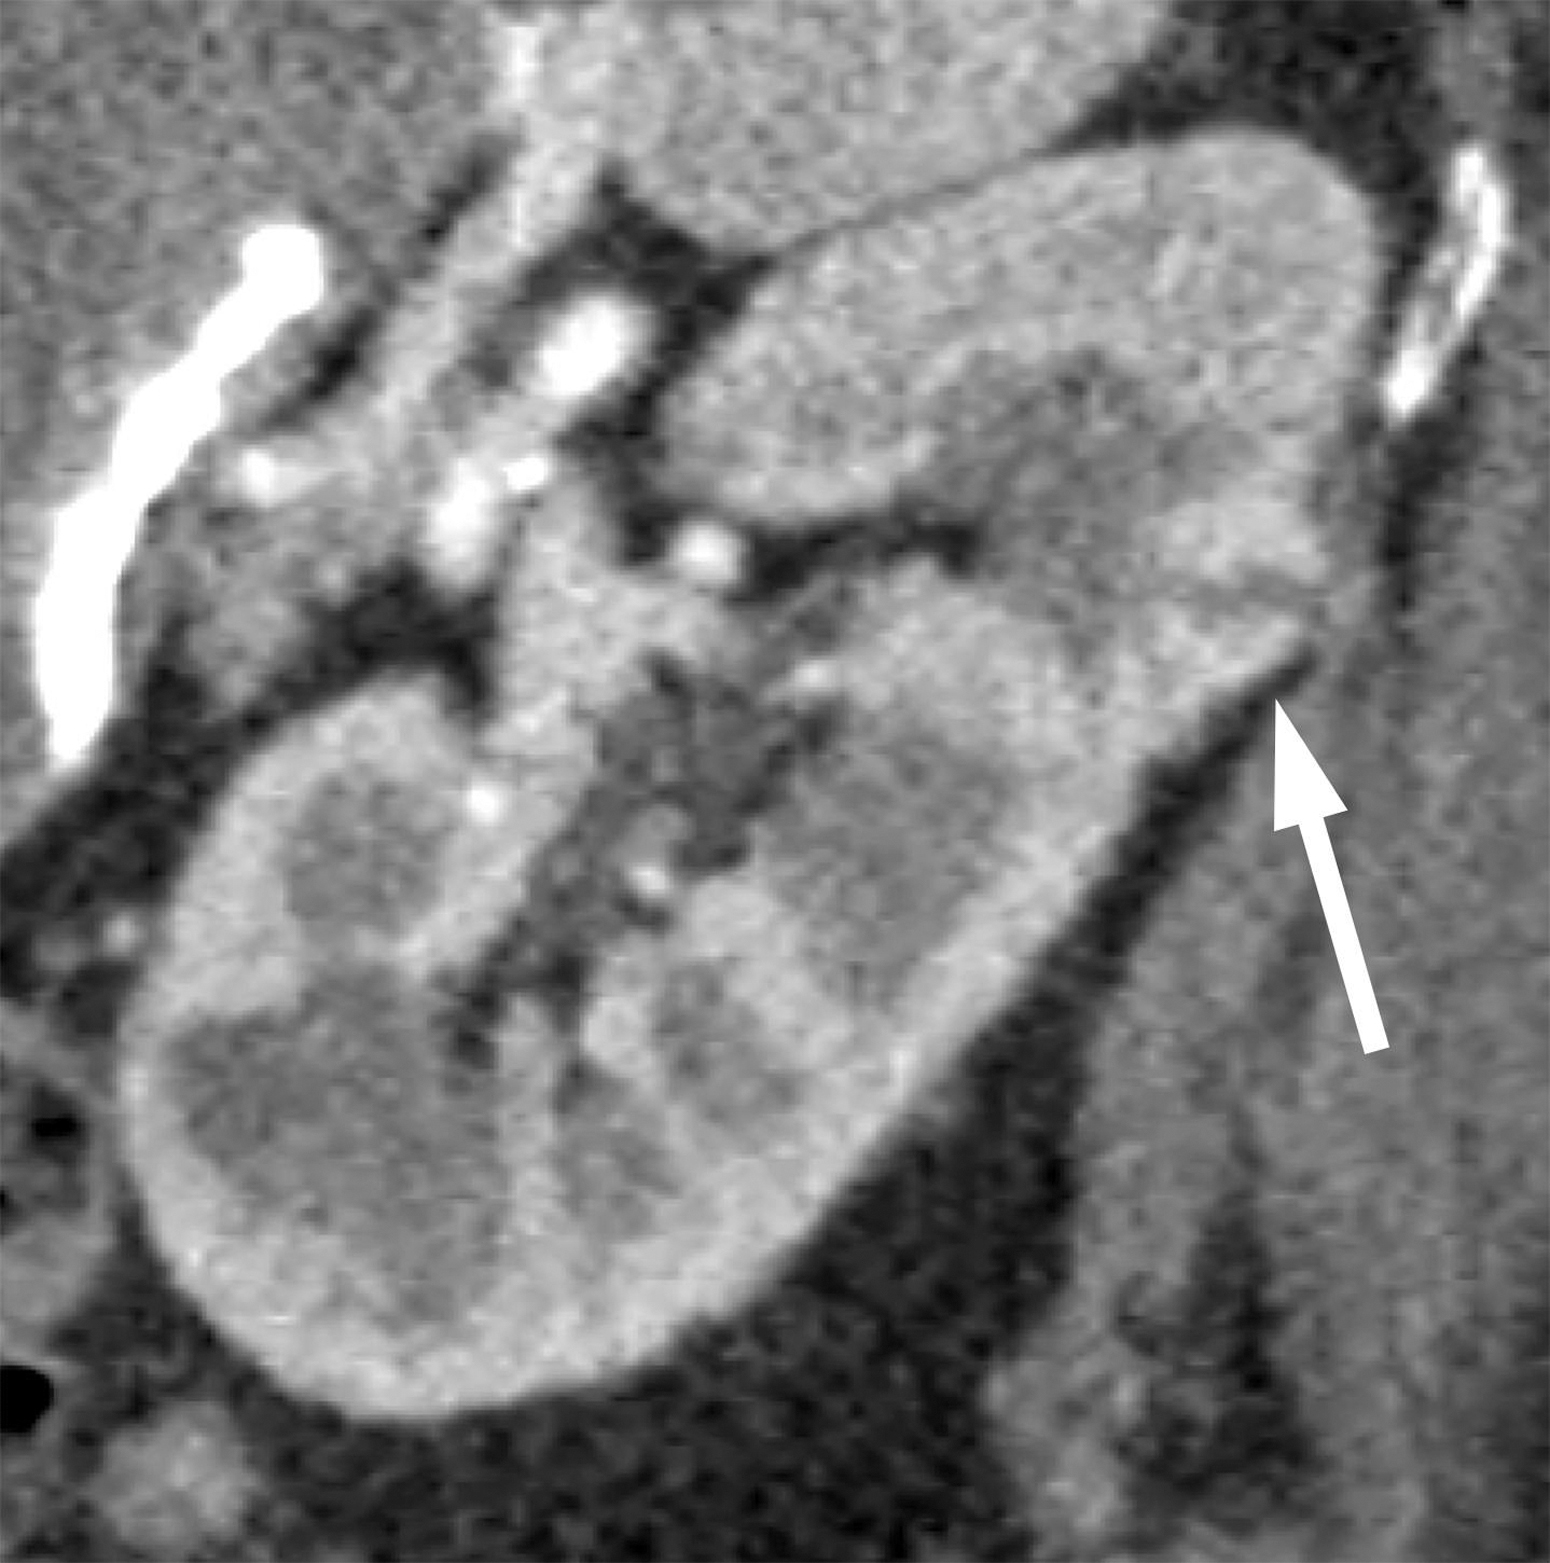
Missed small lesion. Sagittal CT image demonstrating a small 1.0 cm posterior interpolar left renal lesion (arrow) which was missed by the CNN algorithm.
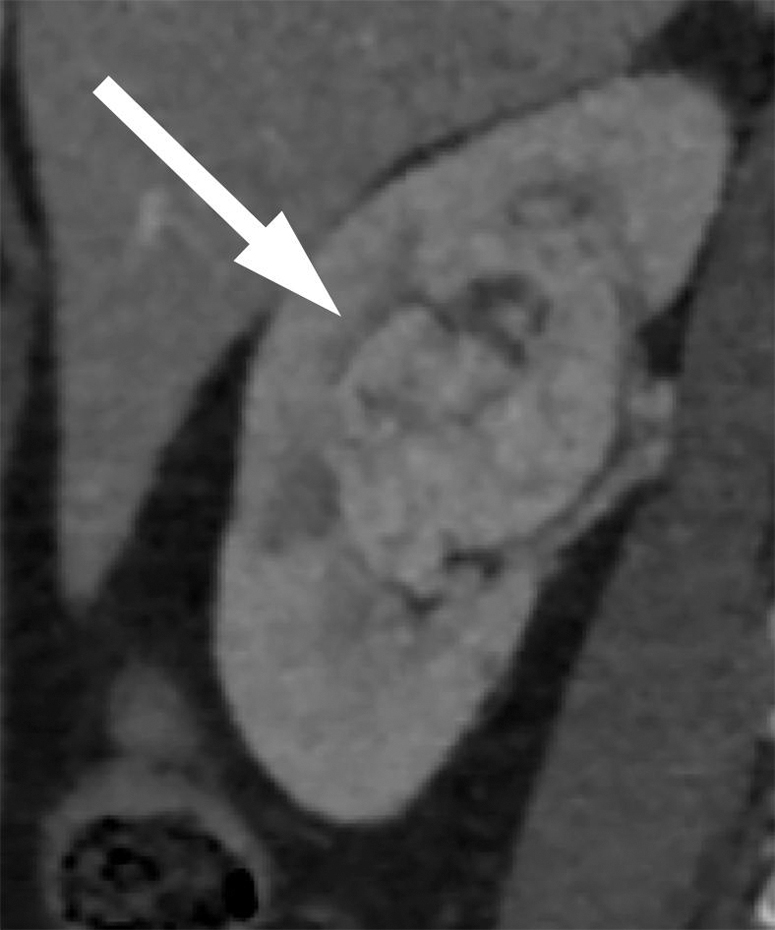
Missed large lesion. Coronal CT image demonstrating a large 5.0 × 3.2 cm right interpolar renal lesion with similar enhancement to the renal parenchyma (arrow), which was missed by the CNN algorithm.
In the future, we intend to evaluate multiphasic imaging data and correlate with pathology results. We aim to build a CNN that could better predict histological makeup of renal tumors. Employing multiphasic imaging would increase our algorithm's accuracy for renal lesion segmentation. Performing segmentation on multiple phases, followed by coregistration of distinct phases, would permit our algorithm to incorporate enhancement characteristics.
Conclusion
We present a DL framework that has achieved high accuracy for kidney detection, renal segmentation, detection of enhancing renal lesions, and segmentation of those lesions in a heterogeneous patient dataset.
Footnotes
Authors' Contributions
R.H. and J.G.-B.: Study design, data collection and analysis, article drafting, and editing. T.-L.B. and C.C.: Data collection and analysis, article drafting, and editing. M.D.B.: data analysis, technical methods, and article editing. H.L. and A.U.: data collection and analysis, and article editing. P.B., E.L., D.F., and W.G.: data collection, and article editing. K.T.-H. and J.L.: Data analysis, and article editing. D.S.C. and P.D.C.: Study design, data analysis, technical methods, and article editing.
Acknowledgment
The authors would like to thank Chanon Chantaduly for his database and infrastructure maintenance and support.
Author Disclosure Statement
P.D.C.: Cofounder and shareholder of Avicenna.ai, a medical imaging startup. D.S.C.: Shareholder of Avicenna.ai, a medical imaging startup, and a grant recipient from Cannon, Inc. All other authors have no conflicts of interest.
Funding Information
Sources of funding include the Cancer Research Trainee Grant, Department of Radiological Sciences, University of California Irvine School of Medicine awarded to author Justin Glavis-Bloom, MD.
Supplementary Material
Supplementary Figure S1
Supplementary Figure S2
Abbreviations Used
References
Supplementary Material
Please find the following supplemental material available below.
For Open Access articles published under a Creative Commons License, all supplemental material carries the same license as the article it is associated with.
For non-Open Access articles published, all supplemental material carries a non-exclusive license, and permission requests for re-use of supplemental material or any part of supplemental material shall be sent directly to the copyright owner as specified in the copyright notice associated with the article.