




Abstract
Introduction:
Stone retropulsion was shown to be impacted by pulse duration during holmium laser lithotripsy, although the whole process of retropulsion was troublesome to study. We developed a modified method to analyze retropulsion using a smartphone and video tracking software.
Materials and Methods:
A holmium laser system was incorporated with a short (200 μseconds) and long pulse-duration (LP) (800 μseconds), and a 272-μm core fiber was attached. A cross-sectional V-shaped rail was submerged in a tank, on which artificial stones were displaced linearly after lasering. Different combinations of pulse energy, frequency, and pulse duration were tested for at least 4 seconds. An iPhone 11 capable of high-definition videoing and video tracking software was used to analyze the stone's displacement and velocity.
Results:
For most settings, the displacement–time graph resembled logarithmic growth and the velocity peaked within the first second after lasering. Higher energy or frequency translated into greater displacement, accompanied by earlier and faster velocity peaks. When the laser power was constant, the short pulse-duration at the fourth second after lasering was much larger in 0.5 J × 40 Hz than 1.0 J × 20 Hz under the short pulse-duration (SP) (13.17 ± 0.92 mm vs 6.90 ± 1.98 mm, p < 0.05), but this discrepancy was offset by the LP. The largest stone displacement and velocity were observed in 0.5 J × 40 Hz SP.
Conclusion:
The pulse duration plays a dominant role in determining the stone retropulsion and velocity, and a long pulse decreases retropulsion and velocity. Given a constant power, the variable combination of frequency and pulse energy contributes to significantly different retropulsion with a short pulse rather than a long pulse. The modified method offers a feasible solution for the study of stone retropulsion by laser lithotripsy.
Introduction
Holmium laser has been introduced into the treatment of urinary stones for more than two decades and offers highly ablative efficiency and versatile application. 1 However, some drawbacks are encountered during holmium laser lithotripsy, among which stone retropulsion is a troublesome issue. 2 Stone retropulsion increases fiber-to-stone distance and makes it cumbersome to reposition fiber on stones, lowering the ablative efficiency and prolonging the operative time. 3
Pulse energy and frequency have been testified in previous studies that decrease of energy or frequency led to reduced retropulsion at the expense of ablation rate. 2 –4 In recent years, advances in laser technology have aimed to overcome these shortages, whereas promoting ablation performance, such as pulse-duration adjustable mode, Moses mode, or multiple pulses mode. 5 –7 Pulse duration is the time referring to laser power >50% of its maximum amplitude in one pulse, and it reflects the speed of laser energy irradiation. 8 The advent of holmium laser incorporated with adjustable pulse duration enabled us to improve laser capability for different scenarios in surgery. 8
Although several studies had explored the impact of pulse duration on stone retropulsion utilizing different in vitro models, the whole-process dynamics of stone retropulsion was seldom analyzed, which might unveil more details for us. Furthermore, the high-speed camera was favored and excessive frames were produced for analysis through the traditional method, which seemed not to be cost-effective.3,4,9 This study aimed to investigate the stone retropulsion on condition of different pulse energy, frequency, and pulse duration settings, in a simplified manner by a smartphone and video tracking software.
Materials and Methods
A holmium laser system with a maximum output of 80 W was incorporated with short (200 μseconds) and long pulse-duration (LP) (800 μseconds) (SRM-H3B; Raykeen Laser Technology Limited Corporation, Shanghai, China). A 272-μm core fiber was employed in the experiment. Artificial cubic stones (5 mm length) were made from Die-Stone (Heraeus Kulzer Dental Limited Corporation, Hanau, Germany), also known as gypsum (calcium sulfate), with a powder to water mixing ratio of 50:11. Each stone was standardized by weight (230 mg) and hydrated overnight. Two metal rulers were stuck longitudinally and rectangularly to form a cross-sectional V-shaped rail, which was submerged in a tank with saline (Supplementary Fig. S1). An iPhone 11 with iPhone Operating System 13 (Apple, Inc., California, USA) capable of high-definition video recording at 30 frames per second (FPS) was set up right above the tank, parallel to the rail to record the whole process of stone displacement.
The stone was placed on one end of the rail with its two surfaces totally on both rulers, for linear motion after laser firing. The laser fiber was inserted through a 6F tube along the rail to vertically contact the stone surface, and it was fixed and hand-free during the test, cleaved and checked before each trial. Different combinations of pulse energy, frequency, and pulse duration were tested for at least 4 seconds, and each setting was repeated three times. One thousand eighty pixel videos were acquired at 30 FPS.
Thereafter, a free video tracking software Tracker (Open Source Physics, Boston, USA) was used to analyze videos to capture the stone's displacement and velocity (Fig. 1 and Supplementary Fig. S2). The displacement was determined by the difference value between the original and terminal coordinates of the stone, and the velocity was the instantaneous forward speed of the stone. Note that original videos might need transcoding for compatibility with Tracker, and the tutorial and installation package of Tracker can be found at

Schematic diagram of the experimental setup. Color images are available online.
Then data were input into GraphPad Prism 5 (GraphPad Software Corporation, San Diego, USA) to produce figures. One-way analysis of variance (ANOVA) analysis was conducted by SPSS v.21 (IBM Corporation, New York, USA) to make comparisons between pairs and p < 0.05 was considered statistically significant.
Results
Higher energy tended to translate into greater velocity and displacement as presented by the displacement–time graph of laser settings (Fig. 2). When laser frequency was fixed as 20 Hz under short pulse-duration (SP), the mean stone displacement was 2.91 ± 0.41 mm, 2.06 ± 0.28 mm, and 3.96 ± 1.75 mm for 0.6 J × 20 Hz, 0.8 J × 20 Hz and 1.0 J × 20 Hz, respectively, at the first second after lasering. No statistical difference of displacement was found among these laser settings within 3 seconds after lasering, yet it was found at the fourth second between 0.6 J × 20 Hz and 1.0 J × 20 Hz (2.89 ± 0.80 mm vs 6.90 ± 1.98 mm, p < 0.05). The velocity peak was 14.98 mm/s and its onset time was 0.530 s for 1.0 J × 20 Hz, faster and earlier than the other two settings.
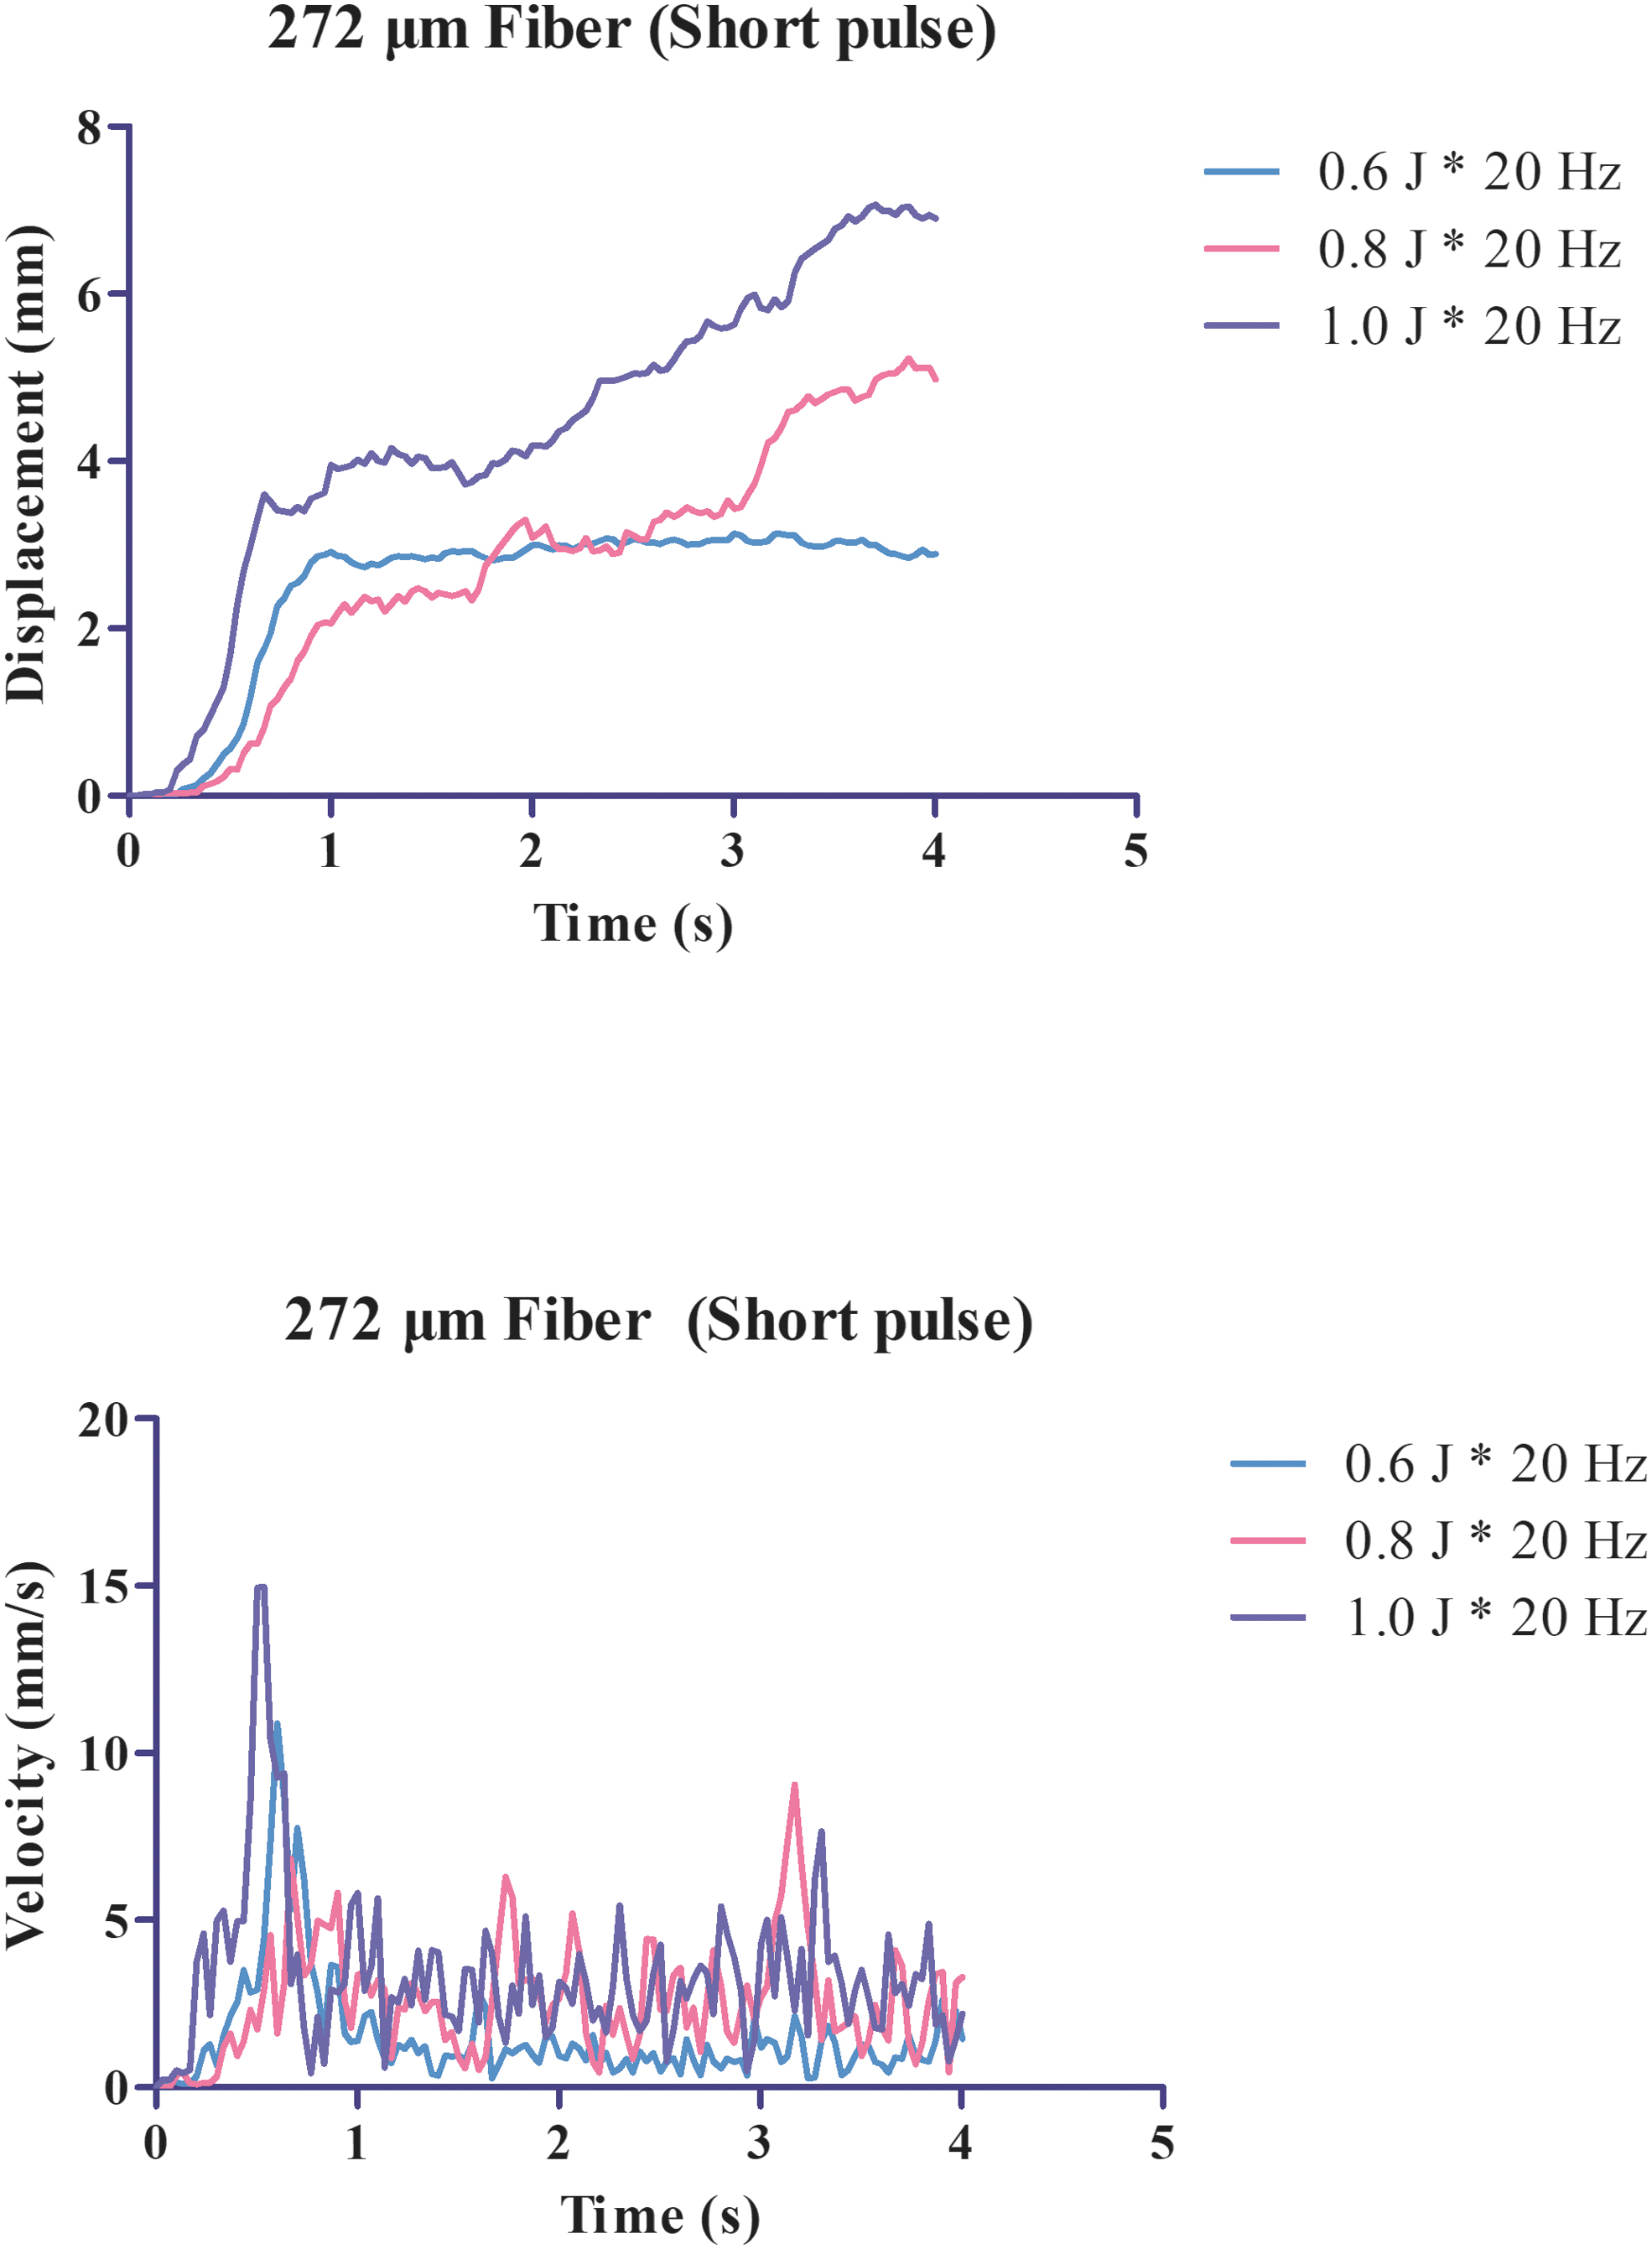
Stone displacement and forward velocity for an increment of pulse energy setting, with a fixed pulse duration (200 μseconds) and frequency (20 Hz). Color images are available online.
As the laser frequency became higher, the stone displacement and velocity were promoted (Fig. 3). The displacement differed at the first second after lasering between 0.8 J × 10 Hz and 0.8 J × 30 Hz (1.50 ± 0.40 mm vs 3.84 ± 1.95 mm, p < 0.05). At the fourth second, the stone displacement was 1.96 ± 0.15 mm, 4.98 ± 2.29 mm, and 9.22 ± 1.15 mm for 0.8 J × 10 Hz, 0.8 J × 20 Hz, and 0.8 J × 30 Hz, respectively, with statistical difference between pairs. The velocity peak also occurred at a higher level and earlier for 0.8 J × 30 Hz than the other two settings.
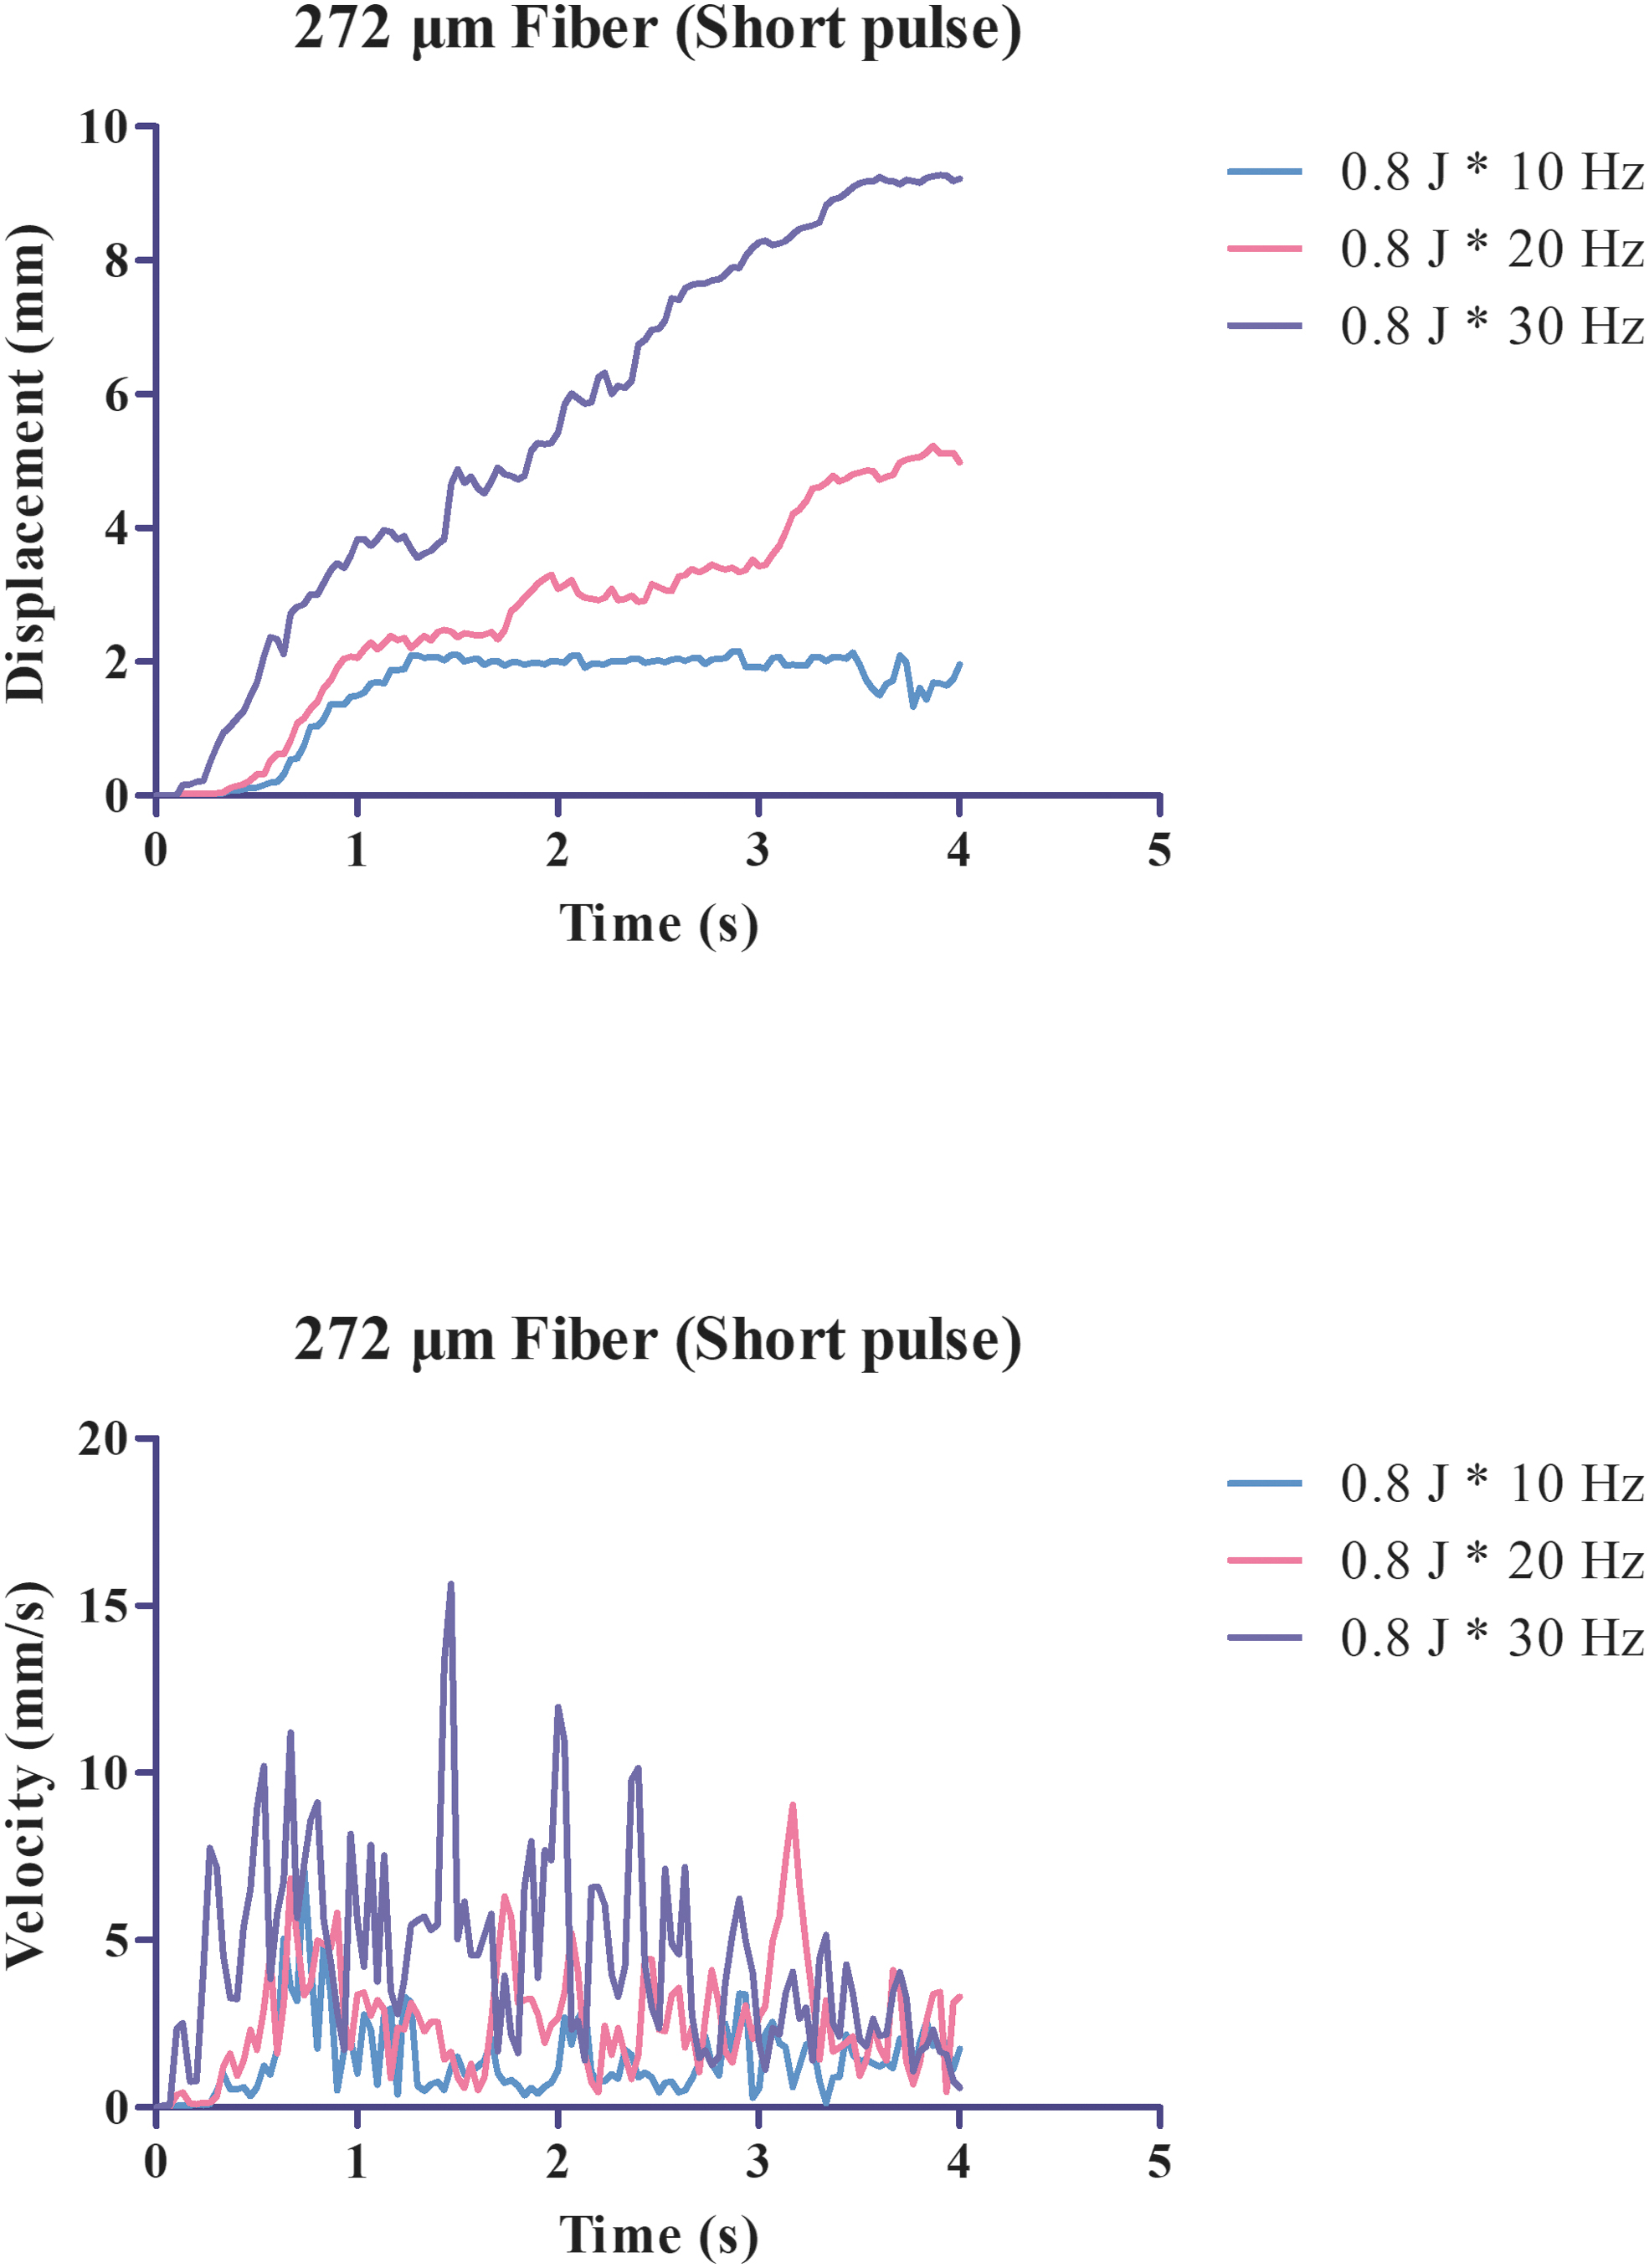
Stone displacement and forward velocity for an increment of frequency setting, with a fixed pulse duration (200 μseconds) and pulse energy (0.8 J). Color images are available online.
Then the impact of pulse duration on stone retropulsion was investigated (Fig. 4). For the SP, the stone displacement was larger in 0.5 J × 40 Hz SP than 1.0 J × 20 Hz SP at each representative timepoint after lasering with statistical significance except for the first second, for example, at the fourth second (13.17 ± 0.92 mm vs 6.90 ± 1.98 mm, p < 0.05). The velocity peak was 26.69 mm/s and its onset time was 0.300 seconds for 0.5 J × 40 Hz SP, faster than 14.98 mm/s and earlier than 0.534 seconds for 1.0 J × 20 Hz SP. For the LP, the stone displacement of 0.5 J × 40 Hz LP and 1.0 J × 20 Hz LP was not statistically different at each timepoint after lasering, for example, at the fourth second (5.44 ± 0.20 mm vs 7.00 ± 0.51 mm, p > 0.05).
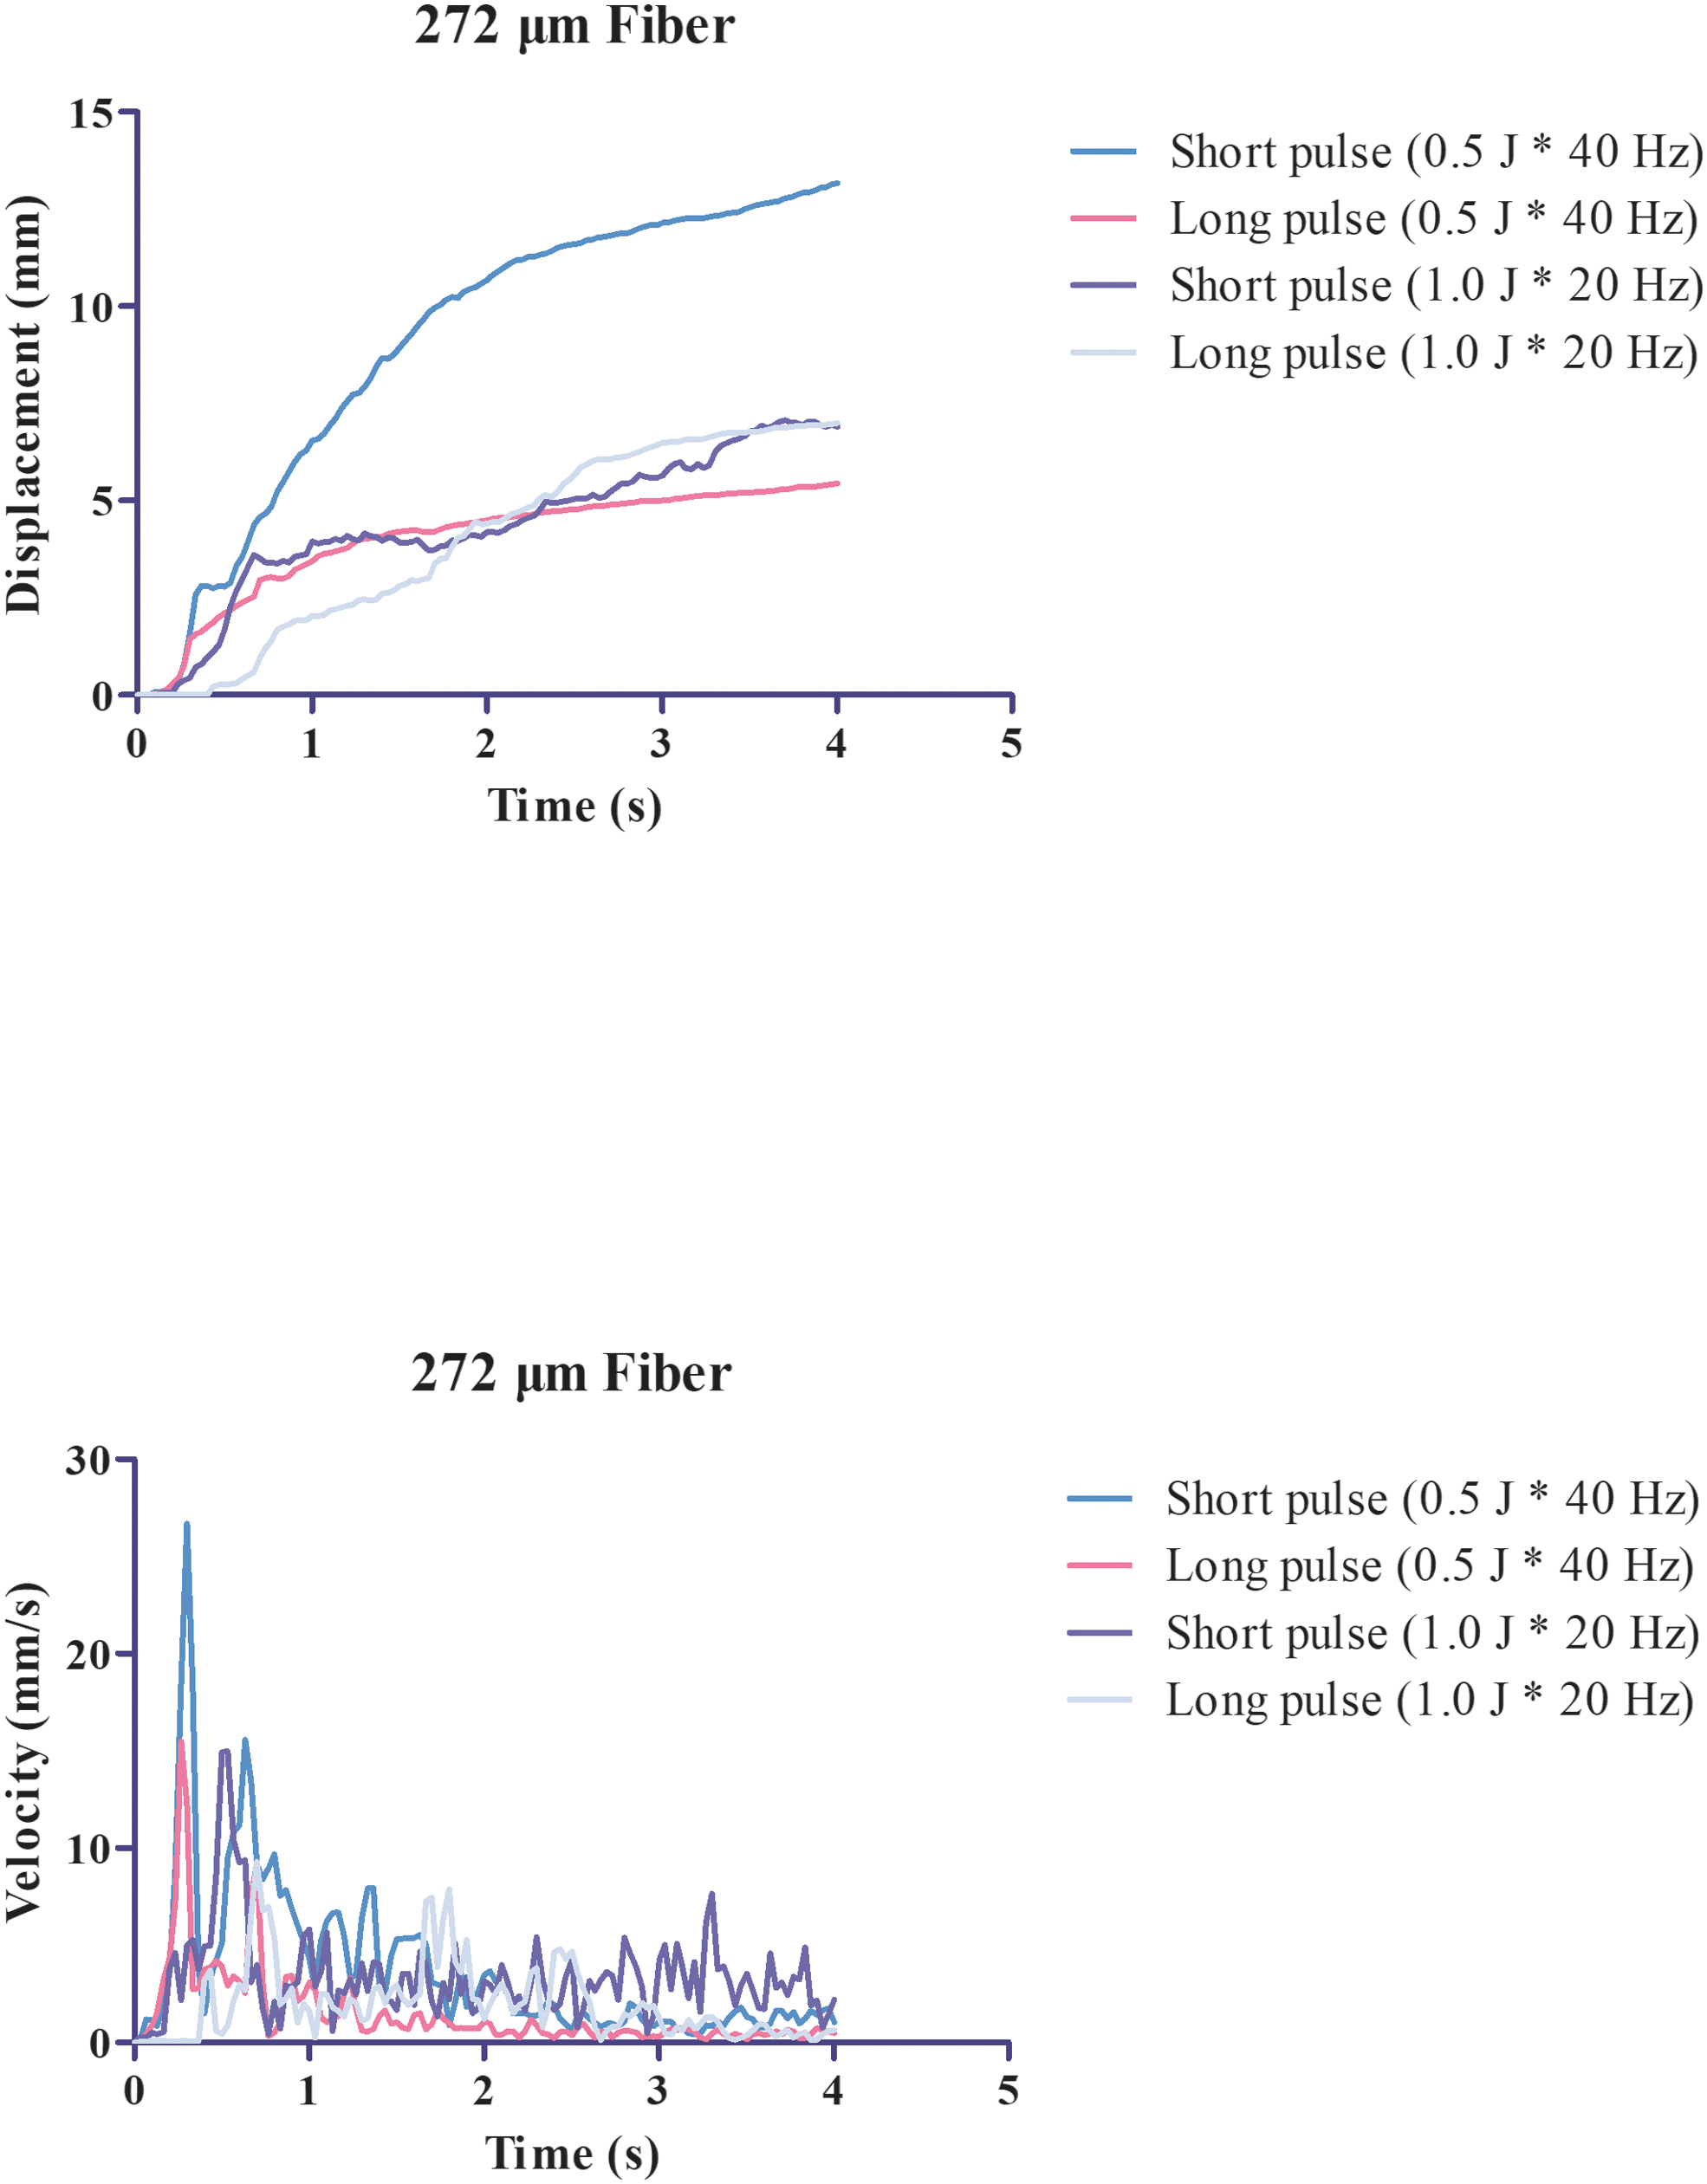
Stone displacement and forward velocity for variable pulse duration (200 and 800 μseconds) and different pulse energy and frequency combination, with a fixed power setting (20 W). Color images are available online.
Nonetheless, the velocity peak was 15.49 mm/s and its onset time was 0.267 seconds for 0.5 J × 40 Hz LP, moderately faster than 9.31 mm/s and earlier than 0.701 seconds for 1.0 J × 20 Hz LP. Although no statistical difference was found in displacement between 1.0 J × 20 Hz SP and 1.0 J × 20 Hz LP, the velocity peak and its onset time were larger and earlier for 1.0 J × 20 Hz SP. Among all these settings, the largest stone displacement and velocity were observed in 0.5 J × 40 Hz SP (Table 1 and Supplementary Table S1).
Representative Displacement (mm) at Different Timepoints for Different Laser Settings (Mean ± Standard Deviation)
Values are the means of three trials.
Within a column of the same figure, means without a common superscript letter differ significantly (p < 0.05).
LP = long pulse-duration; SP = short pulse-duration.
In general, the displacement–time graph of each laser setting resembled the logarithmic growth. Notably, the formation of a plateau in displacement is more likely dependent on a threshold of displacement rather than a time course. Intriguingly, the graphs showed slightly to-and-fro disturbance in displacement after a sharp start. The graphs showed the velocity peaked within the first second after lasering (except for 0.8 J × 30 Hz SP) and slowed down to a relatively lower level thereafter. The turning point of velocity was also synchronized with the onset of a plateau in displacement.
Discussion
Several kinds of in vitro models were used in previous studies to explore stone retropulsion on condition of different frequency, pulse energy, and pulse duration, whereas it remains controversial which one is the best choice. 4,7,9 –11 The pendulum model was proposed by some researchers, because it was deemed to eliminate friction as a confounding factor and yield more repeatable results. 4,7 However, the pendulum method is more suitable for the stone propulsion induced by a single pulse. Once the stone was pushed after laser firing, the original target site of the stone was driven away from the laser fiber tip in a pendular way. Ideally, the target site and incident angle of the second or successive pulse were different from the first pulse, which produced more variables and was more complex for analysis compared with a linear movement.
In this study, a cross-sectional V-shaped rail and cubic stones were adopted to quantitate stone retropulsion. When the stone was displaced, it moved along the rail linearly and the sliding friction was assumed to be identical across trials because of the standardization of stone. Besides, it was not a must to position the fiber tip right at the center of the stone surface to get rid of backward rotation in contrast to spheric stones. Spheric and irregular stones are most encountered in clinical practice; however, cubic stones are more feasible for quantitative and repeatable measurements. The difference of retropulsion caused by laser was minimal for some settings, and it went against statistical analysis. Lasering time was >4 seconds in this study, and a relatively longer lasering time in research could work as a “magnifying glass,” to increase the difference of displacement across settings.
The high-speed camera was favored in previous studies, although measurements made on discrete timepoints or distances did not necessitate such high-end and expensive instrument. 3,4,9 In addition, the effective working time for a high-speed camera was relatively limited and processing the excessive frames would be time-consuming. Smartphones capable of high-definition videoing are popularized nowadays; therefore, iPhone was chosen for recording stone movement in this study. A free video analysis and modeling tool Tracker designed for physics education was used, which allowed video auto-tracking to trace the stone movement frame by frame.
Apart from the displacement of objects, other physical information was also acquired automatically, such as the velocity, acceleration, and kinetic energy. Eisel and colleagues 11 reported a video auto-tracking software based on MATLAB (matrix laboratory) in the analysis of stone displacement requiring a programming process. Kamal and colleagues 9 reported a custom-made algorithm for image processing. In contrast, Tracker is more friendly and accessible to common users not skilled in programming.
As expected, the stone's displacement was larger as pulse energy increased, which was consistent with previous studies. 2,4,12 Fragment ejection from the stone surface, bubble expansion, and collapse are the underlying mechanisms of stone retropulsion. 3,13 Higher energy led to greater ablation and shockwave pressure induced by bubble collapse than lower energy, which accounted for more recoil momentum subsequently. 2,14 To-and-fro movement of the stone was manifested thanks to the whole-process analysis of displacement, and it was more prominent for higher energy, which was thought to be caused by the microjet after bubble collapse. 3 A similar trend between frequency and displacement was also found in this and previous studies. 15 Whereas in the study by Sea and coworkers, 2 retropulsion did not increase as frequency increased with constant pulse energy. In Kamal and coworkers' study, 9 higher frequencies resulted in shorter retropulsion, nonetheless, the stone's profile was not explicit in their literature, which could be attributed to the discrepancy.
To further explore the impact of pulse duration on the stone's displacement, different combinations of pulse duration, energy, and frequency were tested with constant power. The result showed the largest displacement occurred in 0.5 J × 40 Hz SP, whereas this discrepancy was offset by the LP, as no statistical difference was found between 0.5 J × 40 Hz LP and 1.0 J × 20 LP. Several studies showed LP resulted in shorter retropulsion for the same energy and frequency setting, without compromising ablation efficiency compared with SP. 5,7 –10,16,17 Yet, it remained controversial as some studies found the longer pulse duration resulted in a faster ablation decrease than retropulsion. 18
A previous study showed that no statistical difference in displacement was found between high energy (2.0 J × 5 Hz) and high frequency (1.0 J × 10 Hz) settings under the LP (1000 μseconds), but high energy, not high frequency, produced larger retropulsion under the SP (400 μseconds). 7 No standard definition has been established for LP and SP used in practice. Even using the same pulse duration, pulse shape could be different among laser systems, probably leading to different performance. These results implied that the pulse duration played a decisive role in stone retropulsion, and the variable combination of frequency and pulse energy contributed to different stone retropulsion under a SP rather than a LP.
To some degree, the mechanism of laser lithotripsy is determined by pulse duration. 19 Nonetheless, merchandized holmium laser machines are characterized by their long pulse of microseconds and more photothermal effect. Although stone ablation efficiency was mostly reported to be similar between LP and SP, the dynamic of laser induced bubble could be transformed by pulse duration. The pear-shaped bubbles were formed and collapsed under a long pulse, which resulted in weaker shockwave pressure as momentum to the stone movement, compared with the more spheric bubbles induced by a short pulse. 3,20
The velocity analysis revealed that the larger displacement was accompanied by earlier and faster velocity, and the formation of displacement plateau was also reflected by the transition of velocity. Eisel and colleagues 11 also reported stone retropulsion velocity was larger for shorter pulse duration and higher energy. The velocity in this study represented the magnitude of kinetic energy as the stones' weight was standardized. The momentum of retropulsion by fragment ejection during laser ablation was reported to be dominant, which only happened within the range of laser firing determined by the maximum bubble length. 13,17
Dushinski and Lingeman 14 reported the maximum length of a bubble was about 5 mm for the energy of 1 J. Several studies showed holmium laser ablation stalled at 3 mm for both SP and LP. 16,17 In our study, the displacement plateaus almost took form since the fiber-to-stone distance became >5 mm, and the velocity diminished at the corresponding distance. These results added more evidence to the existing theory about retropulsion and implied the proper reaction time to stone displacement by the surgeon, probably exceeding 1 second caused by the velocity peak of the stone movement.
There are some limitations in our study. The in vitro nature of this research restrained the results to be generalized to clinical practice. The composition of the artificial stone was different from human stones, and irregular stones are more common in a real-life world rather than cubes. What is more, there was a difference among laser systems and no gold standard for constructing a retropulsion model, which was a confounding factor for comparisons with previous studies.
Conclusions
The pulse duration plays a dominant role in determining the stone retropulsion, and a long pulse mode decreases retropulsion. In addition, the variable combination of frequency and pulse energy with a constant power contributes to different stone retropulsion under a short pulse (SP) rather than a long one. The modified method is a feasible solution for the study of stone retropulsion.
Footnotes
Authors' Contributions
M.L. contributed to the study design, experiment accomplishment, and composition of the article; L.L. and Z.X. contributed to the analysis and composition of the article; Y.P., Z.W., and F.X. contributed to the proofreading and revising of the article; X.G. contributed to the study design, supervision, and revision of the article.
Acknowledgments
Hui Zuo provided technique support.
Author Disclosure Statement
No competing financial interests exist.
Funding Information
This study was supported by National Natural Science Foundation of China (81900644 and 81902601).
Supplementary Material
Supplementary Figure S1
Supplementary Figure S2
Supplementary Table S1
Supplementary Video
Abbreviations Used
References
Supplementary Material
Please find the following supplemental material available below.
For Open Access articles published under a Creative Commons License, all supplemental material carries the same license as the article it is associated with.
For non-Open Access articles published, all supplemental material carries a non-exclusive license, and permission requests for re-use of supplemental material or any part of supplemental material shall be sent directly to the copyright owner as specified in the copyright notice associated with the article.
