
Abstract
Purpose:
Preventative strategies and surgical treatments for urolithiasis depend on stone composition. However, stone composition is often unknown until the stone is passed or surgically managed. Given that stone composition likely reflects the physiological parameters during its formation, we used clinical data from stone formers to predict stone composition.
Materials and Methods:
Data on stone composition, 24-hour urine, serum biochemistry, patient demographics, and medical history were prospectively collected from 777 kidney stone patients. Data were used to train gradient boosted machine and logistic regression models to distinguish calcium vs noncalcium, calcium oxalate monohydrate vs dihydrate, and calcium oxalate vs calcium phosphate vs uric acid stone types. Model performance was evaluated using the kappa score, and the influence of each predictor variable was assessed.
Results:
The calcium vs noncalcium model differentiated stone types with a kappa of 0.5231. The most influential predictors were 24-hour urine calcium, blood urate, and phosphate. The calcium oxalate monohydrate vs dihydrate model is the first of its kind and could discriminate stone types with a kappa of 0.2042. The key predictors were 24-hour urine urea, calcium, and oxalate. The multiclass model had a kappa of 0.3023 and the top predictors were age and 24-hour urine calcium and creatinine.
Conclusions:
Clinical data can be leveraged with machine learning algorithms to predict stone composition, which may help urologists determine stone type and guide their management plan before stone treatment. Investigating the most influential predictors of each classifier may improve the understanding of key clinical features of urolithiasis and shed light on pathophysiology.
Introduction
Urolithiasis is a prevalent disease that affects as much as 20% of the population across different regions of the world. 1 –4 Growing evidence suggests that there is an increase in global incidence, which will exacerbate the burden that the disease already has on health care systems and economies. 5,6 Stone type can significantly impact medical and surgical management approaches and responses to treatment, thus it is critical to determine the stone composition to provide effective care for patients.
However, stone composition is often not known until after the stone is passed or surgically treated, and most stones are neither retrieved nor sent for analysis. 7 –9 Preoperative diagnostic imaging allows for cursory stone analysis, but can be costly and expose patients to ionizing radiation. Intraoperative stone composition is beginning to be predicted from direct stone images, but not all patients undergo surgery for stone treatment. 10 Therefore, there is a need for noninvasive tools to predict stone types using common clinical parameters.
Machine learning models can detect patterns from previous stone formers to deduce the clinical manifestations that induce specific stone types and can use this information to predict stone composition from newly observed patient data. An initial attempt at this came from a 2013 article by Moreira and colleagues 11 who used a multinomial logistic regression (MLR) model to predict stone type from 24-hour urinalysis and patient demographics. However, this model demonstrated inadequate power to accurately classify patients by stone type.
Improvements were made by Abraham et al. 12 by harnessing the unique abilities of extreme gradient boosting (XGBoost) decision trees to enhance the accuracy of correctly identifying calcium vs noncalcium stone types. The study found 24-hour urinalysis to be the most important predictor in their model. 12 Despite the higher accuracy, the model could not consistently identify stone types from minority classes. 12 Compared with logistic regression (LR), the XGBoost model had lower accuracy in multiclass classification. 12
The goal of this study was to build on the work from previous stone classification studies 11 –13 to train a machine learning model to effectively predict stone composition, while also balancing accuracy and inter-rater agreement. Given that stone composition reflects specific physiological parameters during its formation, we set out to use patient urinalysis, 24-hour urine, serum biochemistry, and demographic data to build machine learning models to classify stone types.
Additionally, we leveraged these models to see the clinical parameters that are most important for classification, which can inform urologists about the most advantageous clinical features to help guide treatment decisions and may provide some insight into the underlying pathophysiology of each stone type.
Materials and Methods
Patient cohort/study population
The study was approved by the Human Research Ethics Board at Western University (REB no. 106062). A total of 777 confirmed kidney stone patients were prospectively recruited from September 2001 to October 2021 at a tertiary care center metabolic stone clinic (London, Canada) (Table 1).
Patient Cohort Demographics
BMI = body mass index; SD = standard deviation.
All laboratory tests were conducted at St. Joseph's Hospital Centre in London, Canada, following site-specific standard operating procedures. All results were reviewed by a trained urologist with expertise in metabolic stone disease. Patients with 24-hour urine outside the normal creatinine ranges (male: 8.6–19.4 mM/d; or female: 6.3–13.4 mmol/d) were deemed inappropriately collected and were excluded.
Data on stone composition, 24-hour urine, urinalysis, serum biochemistry, patient demographics, and medical history were prospectively collected from each patient as per the Canadian Urological Association (CUA) guidelines on the evaluation and medical management of kidney stones. 14 If patients had multiple stone analyses available, the stone data with the data that were most temporally close to the laboratory results were used.
Stone composition was restricted to calcium oxalate (monohydrate and dihydrate analysis if possible), calcium phosphate (comprising calcium phosphate, apatite, and brushite), uric acid, struvite, and cystine. Calcium-based stones included calcium oxalate and calcium phosphate, while noncalcium-based stones encompassed uric acid, struvite, and cystine stones. Calcium phosphate, apatite, and brushite stones were combined due to the limited population size in the study.
Table 1 demonstrates the prevalence of stone types. In the case where the stone composition was mixed, the stones were classified based on the most abundant composition.
Recorded 24-hour urine values included urine volume (mL), sodium (mmol/d), creatinine (mmol/d), phosphate (mmol/d), urate (mmol/d), calcium (mmol/d), urea (mmol/d), oxalate (μmol/d), and citrate (mmol/d). Urinalysis was performed on single-time point urine samples and included pH, as well as glucose, leukocytes, protein, ketones, blood, and nitrite, which were all recorded as binary (positive/negative). Serum biochemistry included sodium (mmol/L), potassium (mmol/L), chloride (mmol/L), bicarbonate (mmol/L), urea (mmol/L), creatinine (μmol/L), total calcium (mmol/L), phosphate (mmol/L), urate (μmol/L), parathyroid hormone (nmol/L), and 25-OH vitamin D (nmol/L).
Patient demographics include age (years), weight (kg), and height (cm). Comorbidities were recorded as binary (positive/negative) and included gout, inflammatory bowel disease, urinary tract infection, hypertension, diabetes (both type 1 and 2), cardiac, stroke, sarcoidosis, cystinuria, and medullary sponge kidney.
Machine learning model approach
All steps of the machine learning protocol were performed in R, v4.2.2, 15 using the R package, caret, v6.0-93. 16 Figure 1 provides an overview of the experimental setup used for each analysis. Analysis scripts are available on GitHub (https://github.com/jchmiel4/ML_stone_composition).
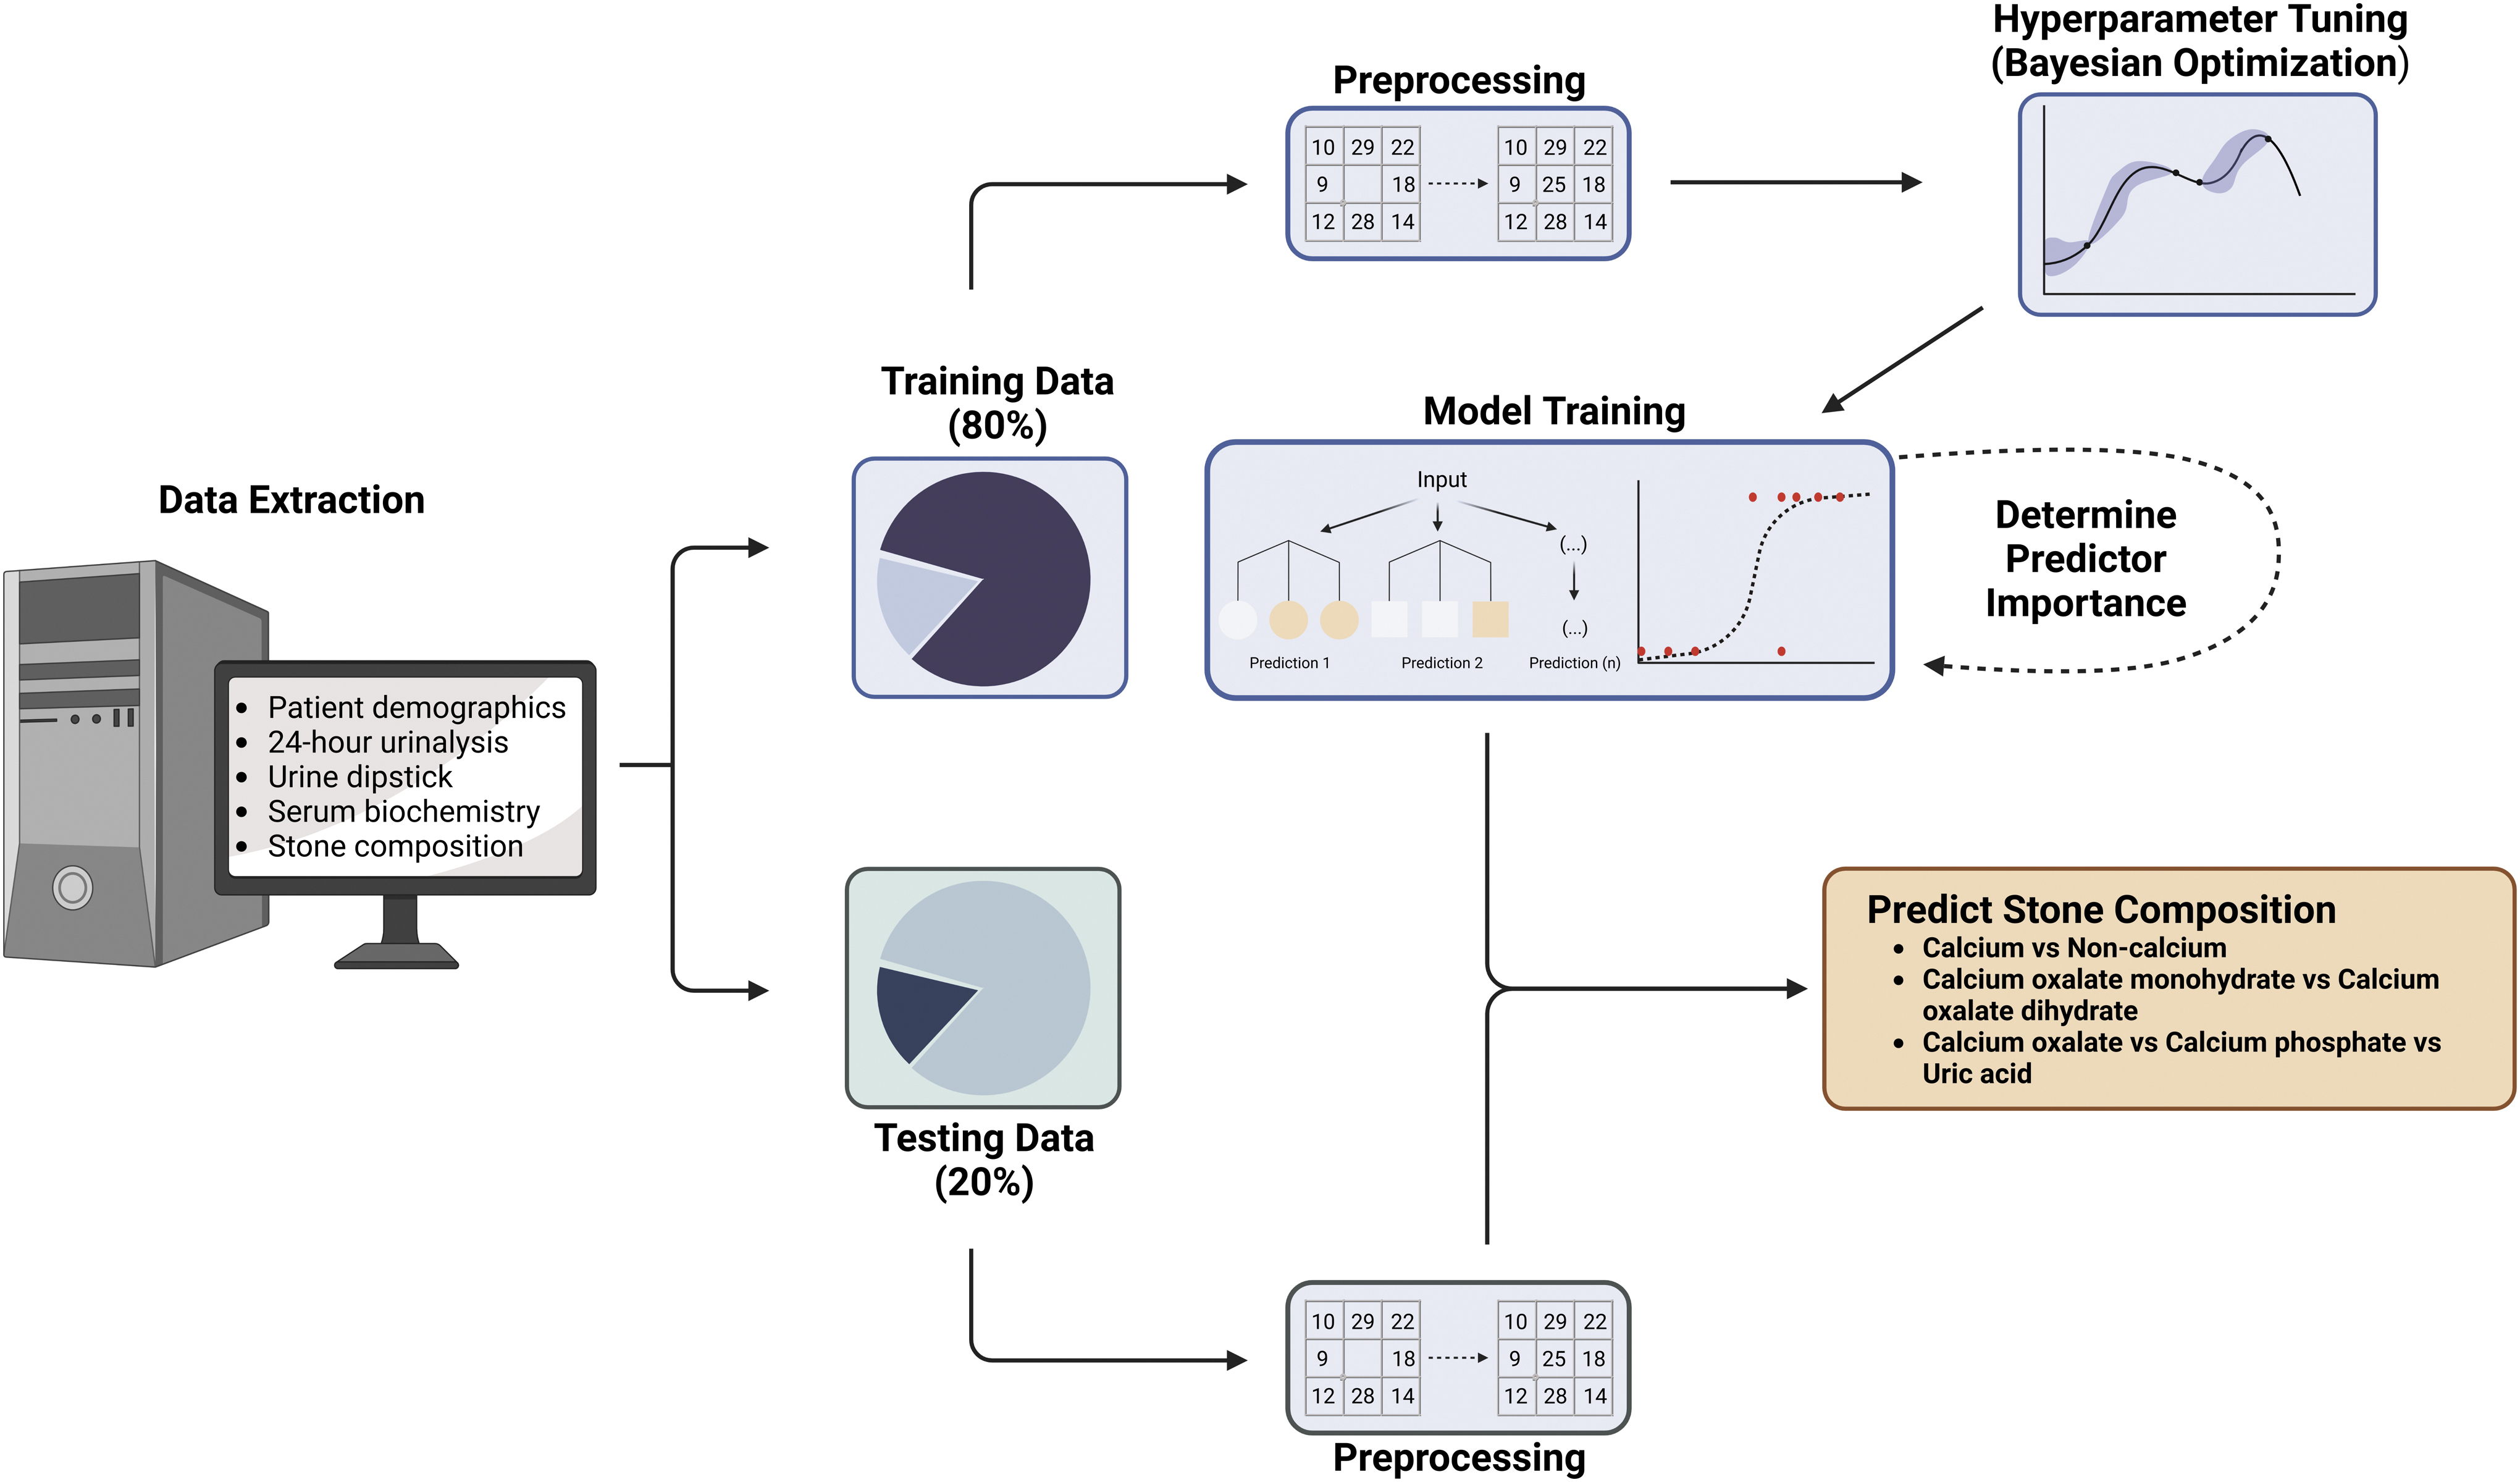
Overview of the machine learning workflow. Data were collected and divided into a training dataset (80%) and testing dataset (20%). Preprocessing was defined on the training dataset and applied to both the training and testing datasets. The training dataset was used to build a model and hyperparameters were tuned using Bayesian optimization. The final model was validated with the testing dataset to confirm efficacy. Created with BioRender.com.
Data preprocessing
Data were split into a training set (80%) and a testing set (20%). All preprocessing functions were defined on the training set and then applied to the training and testing sets separately. Concentrations were entered as continuous variables, and binary data were encoded as 0, indicating negative, or 1, indicating positive. Missing values in the entire dataset were handled using a bagged tree imputation approach in caret, v6.0-93. 16 From here, binary data were rounded to 0 or 1 and converted to factors for the machine learning algorithms.
Body mass index was calculated after data imputation and the height and weight columns were removed. Cystinuria was removed from calcium oxalate monohydrate (COM) vs calcium oxalate dehydrate (COD) and calcium oxalate vs calcium phosphate vs uric acid because there were no positive patients.
Model development
A gradient boosted machine (GBM) algorithm from the R package, gbm, v2.1.8.1, 17 was evaluated to determine if it could predict stone composition in kidney stone formers. This supervised boosted tree algorithm sequentially learns from weak learners to build a better performing model. The model was built to maximize Cohen's kappa to pursue equal representation of the classes. Kappa is a measure of inter-rater reliability, where one rater is the real-world stone composition and the other is the classification made by the model.
The model was validated using 10-fold cross-validation repeated three times to ensure the robustness of the model. Tuning was performed using Bayesian optimization in the R package, rBayesianOptimization, v1.2.0. 18 Class imbalance was minimized by upsampling the minority group(s).
The GBM model was compared with LR using the glm function of the core R package, stats, v4.2.0, or with MLR using the multinom function of the R package, nnet, v7.3-18. 19 LR and MLR were trained to maximize Cohen's kappa with the same cohort used in the GBM model; however, no hyperparameter tuning was performed.
Assessment of model performance
Model performance was evaluated by predicting the stone composition of the testing dataset. Kappa was used as the primary metric to ensure representation in each group, but area under the receiver operating characteristic curve (AUC-ROC), precision, recall, specificity, F1 score, and accuracy were considered when evaluating the models.
Confusion matrices were generated using caret, v6.0-93, 16 to view prediction results of the models. AUC-ROC was generated with MLeval, v0.3, 20 and plotted with ggplot2, v3.4.0. 21
Feature importance
Shapley Additive Explanation (SHAP) values are widely used in machine learning to determine which predictor variables have the most influence in the model. 22 SHAP values represent the marginal contribution of each predictor variable to the classification. Approximate SHAP values were calculated using the R package, fastshap, v0.0.7, 23 with nsim = 500. Global and local importance was visualized using shapviz, v0.4.1. 24
Results
Binary classification: calcium vs noncalcium stones
Predictors from 625 calcium (calcium oxalate and calcium phosphate) and 152 noncalcium (uric acid, struvite, and cystine) stone formers were used to train and validate GBM and LR models. The GBM model had a kappa score of 0.5231 compared with the LR model at 0.4508. A confusion matrix illustrates the number of correct and incorrect classifications in the GBM model (Fig. 1A).
The GBM model had a slightly more favorable AUC-ROC (Fig. 2B and Supplementary Table S1). Further analysis revealed that the GBM model had improved accuracy, sensitivity, and F1 score, while the LR model showed better balanced accuracy, specificity, and positive predictive values (Supplementary Table S1).
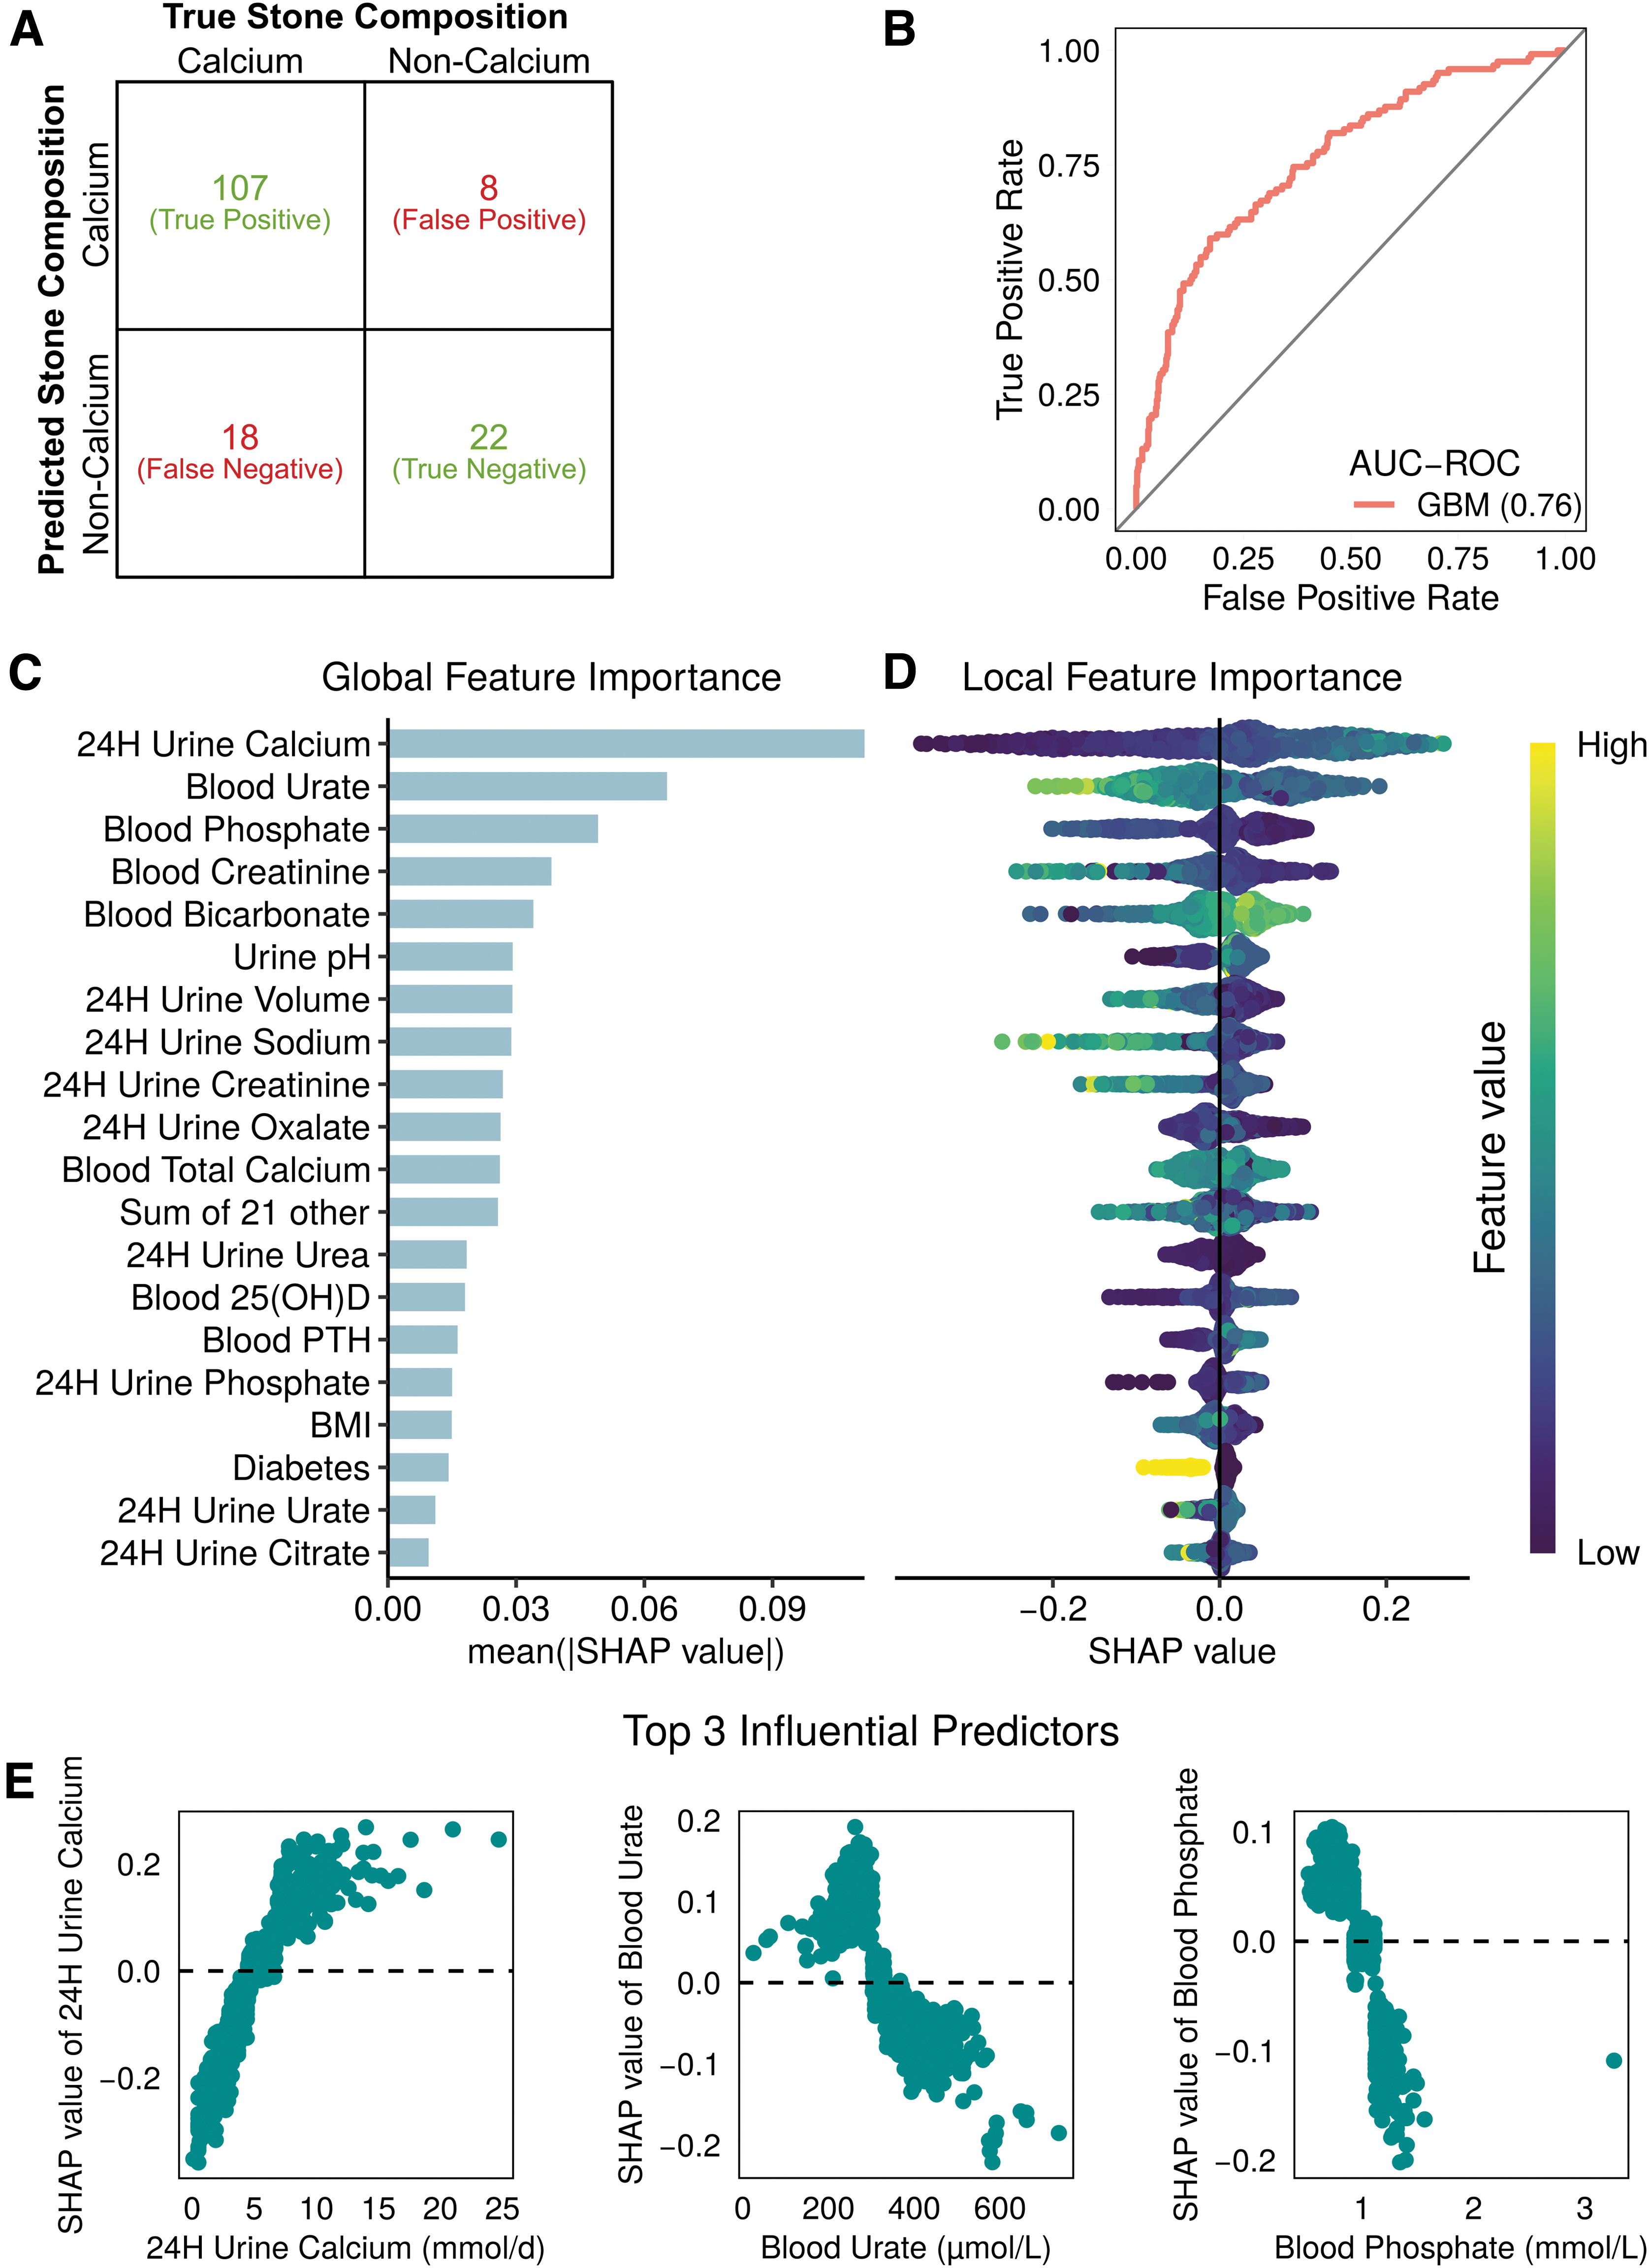
Machine learning outputs for calcium vs noncalcium stone classification.
Investigating the most influential predictors using approximate mean absolute SHAP values, we found the top three to be 24-hour urine calcium, blood urate, and blood phosphate (Fig. 2C). The local effect of each predictor can be visualized by considering the direction of the SHAP value, with positive values indicating calcium stones and negative values indicating noncalcium stones (Fig. 2D).
Examining the three most influential predictors, we found higher levels of 24-hour urine calcium and lower levels of blood urate and blood phosphate, which are more indicative of calcium-based stones (Fig. 2E).
Binary classification: COM vs COD stones
Clinical data from 437 COM stone formers and 65 COD stone formers were used to train and validate GBM and LR models. The GBM model showed a reduced kappa score of 0.2042 compared with the LR model at 0.2456. Figure 3A demonstrates the number of correct and incorrect stone type classifications in the GBM model. The AUC-ROC of the GBM model was 0.61, which is slightly lower than that of the LR model at 0.62 (Fig. 3B).

Machine learning outputs for COM vs COD stone classification.
Overall, the GBM model had higher accuracy, sensitivity, negative predictive value, and F1 score compared with the LR model, but suffered from lower balanced accuracy, specificity, and positive predictive value (Supplementary Table S2).
Approximate mean absolute SHAP values revealed that 24-hour urine urea, calcium, and oxalate were the most important predictors of the model (Fig. 3C). Direction of the SHAP value indicates a relationship with stone type, where positive SHAP values are associated with COM stones and negative SHAP values are associated with COD stones (Fig. 3D). High 24-hour urine urea and low 24-hour calcium and oxalate are individually connected to COM stones (Fig. 3E).
Multiclass classification: calcium oxalate vs calcium phosphate vs uric acid
GBM and MLR models were trained and validated with data from 524 calcium oxalate, 101 calcium phosphate, and 135 uric acid stone formers. The GBM model showed worse performance (kappa = 0.3023) than the MLR model (kappa = 0.3296). While the GBM model was able to correctly classify the mode of calcium oxalate stone formers, it struggled in accurately classifying calcium phosphate and uric acid stone formers (Fig. 4A

Machine learning outputs for calcium oxalate vs calcium phosphate vs uric acid stone classification.
The GBM model had a slightly worse AUC-ROC than the MLR model
The top three global predictors were 24-hour urine calcium, age, and 24-hour urine creatinine when the categories were combined (Fig. 4C). For the calcium oxalate class, the most important predictors were 24-hour urine calcium, blood bicarbonate, and age. The calcium phosphate class was most influenced by age, 24-hour urine creatinine, and sex. The top three predictors for the uric acid class were 24-hour urine calcium, blood urate, and blood phosphate.
Discussion
Determining stone composition is an important step in kidney stone management. In this study, we developed three machine learning models that can predict stone types from clinical data. Our models can differentiate between calcium and noncalcium; COM and COD; and calcium oxalate, calcium phosphate, and uric acid stone types with a fair degree of accuracy.
Our models build on previous studies 11,12 that used demographic and 24-hour urinalysis data and considered blood biochemistry and spot urinalysis measurements. These added predictors improved the utility of the models in accurately predicting stone composition.
Moreover, we expanded the application of the models to classify previously unconsidered stone types. Most importantly, these models can be used to determine significant clinical factors that drive the formation of each stone type, which may help to further our understanding of the underlying pathophysiology of stone disease.
The first model was designed to distinguish calcium and noncalcium stones. Indeed, by using the additional clinical parameters, our model showed an improved kappa score (calculated from published data) compared with the models generated by Abraham and colleagues. 12 That is, our model was more reliable in correctly classifying both calcium and noncalcium stone types, while Abraham and colleagues 12 were better at correctly classifying only calcium stones.
This important distinction signifies that the predictive power of our model is higher and more reliably classifies both groups, suggesting that the most influential predictors are likely involved in calcium vs noncalcium stone differentiation. In particular, we found that elevated 24-hour urine calcium is associated with calcium-containing stones, which is expected and has been widely corroborated. 11 Elevated blood urate and phosphate levels were important predictors in noncalcium stones.
Upon initial examination, hyperuricemia appears to be significant due to its connection with uric acid urolithiasis, which is the predominant composition in the noncalcium kidney stone formers. However, considering that elevated blood creatinine was also observed in noncalcium stone formers, it could perhaps be that noncalcium stone formers also have reduced kidney function. Certainly, uric acid stone formers have been shown to have higher serum creatinine, serum cystatin C, and detectable urine albumin compared with calcium-containing stone formers. 25
Noncalcium stone formers have typically be shown to have reduced kidney function, but whether this is due to stone disease or other comorbidities associated with uric acid stones is unknown. 26 –30 Low blood bicarbonate and urine pH were also predictive of noncalcium stones, further demonstrating the importance of physiological pH to stone type, which is well corroborated by other studies. 27,31
The next model sought to differentiate COM and COD stone types. COM and COD stone types have previously been differentiated through imaging studies. 32 Despite being less effective, our model is the first of its kind to distinguish COM and COD stones based solely on clinical parameters. Interestingly, our model found that high 24-hour urine urea was the top predictor of COM stones.
Urine urea is not typically measured, but some studies have found increased 31,33 and decreased 34 levels in COM stone formers. Urea excretion is a marker of protein intake and high protein intake lowers urine pH. 35 Our model found that reduced pH is associated with COM stones, which is corroborated by in vitro data 36 and suggests that urine pH may be a key player in distinguishing COM and COD stones. As expected, calcium and oxalate were also strong influencers in the model.
Lower 24-hour urine calcium was associated with COM stones, as traditionally observed. 37 –39 Higher urine oxalate is generally observed in COM stones, 31 but our model showed that lower urine oxalate is more prevalent in these stone types. This could be because oxalate is not as strong a predictor of COM/COD stone type as calcium. 37 Altogether, this suggests that 24-hour urine calcium is a much better predictor than 24-hour urine oxalate for differentiating COM and COD stones.
The multiclass model was built to distinguish calcium oxalate, calcium phosphate, and uric acid stones. Similar to other reports, 12 the LR model outperformed the boosted tree algorithms. It has been observed that LR has been shown to outperform boosted tree algorithms on highly imbalanced data, which may explain this observation. 40
Regardless, our model showed similar results to that of Abraham et al. 12 and Moreira et al. 11 where the top predictor was 24-hour urine calcium, which highlights the well-established importance of calcium in stone formation. 11,31,34,37 –39 Age was the second most influential parameter, suggesting that stone types could be stratified by age. Uric acid stones have been observed to increase with age, while calcium phosphate and, to some extent, calcium oxalate stones decrease. 41
Both blood and urine creatinine, blood urate, and blood phosphate were also important in the multiclass model, which could imply that kidney function is an important clinical observation. However, it is difficult to ascertain if altered kidney function is a product or result of stone formation.
While this study presented models that improved on accurate prediction of stone types, there are some limitations that should be considered when reviewing the work. As these data are obtained from a single institution, it is possible the patient population and laboratory findings are not representative of the larger stone demographic.
It is likely that some clinical data from patients were not necessarily collected under physiological conditions of stone formation due to stone passage or shifts in physiology after stone formation. Furthermore, some patients may have received medication that could alter the real values of 24-hour urine collection.
Unfortunately, demographic data on socioeconomic status, education, income, and race were not available, thus their importance in stone disease cannot be determined. As with other studies, 11,12 the number of stones is limited and the imbalanced nature of the dataset makes it difficult to build strong models.
Next, our approach was to define each stone type by its most prevalent composition, similar to Abraham and colleagues. 12 While this allowed for a more accurate model, it does not reflect the nuances of stone composition, and future iterations should consider a regression or binned model where exact stone composition can be predicted. Future models should amalgamate clinical data with imaging data to better determine stone composition. An ensemble approach may be more useful as it has been demonstrated that stacking multiple models can improve the performance of the classifier. 42
Finally, it should be noted that McHugh 43 suggested that a kappa score below 0.60 denotes inadequate agreement, thus expanding the cohort and feature size may be more useful in improving the kappa score.
Despite these limitations, this study demonstrates that machine learning models are capable of predicting stone type and are useful tools in understanding the pathophysiology of urolithiasis.
Conclusions
In this study, we developed improved machine learning models to classify stone types using clinical parameters. These models not only showed improved performance in predicting calcium vs noncalcium stones but also allowed for the classification of COM vs COD and calcium oxalate vs calcium phosphate vs uric acid stones. Influential predictors used in these models represent key clinical parameters that may help to explain the diagnosis or pathophysiology of urolithiasis.
This study reinforces the finding that machine learning models have the potential to predict kidney stone composition, and future optimizations based on these results could enhance the clinical applicability of the models.
Footnotes
Authors' Contributions
Conception and design were performed by J.A.C., H.R., and J.B.; data acquisition was performed by J.F.W.W., L.N., and J.B.; data analysis and interpretation were performed by J.A.C.; statistical analysis was performed by J.A.C.; drafting of the article was performed by J.A.C. and J.B.; critical revision of the article for scientific and factual content was performed by J.B., G.A.S., J.F.W.W., J.P.B., and H.R.; and supervision was performed by J.P.B. and J.B.
Author Disclosure Statement
No competing financial interests exist.
Funding Information
No funding was received for this article.
Supplementary Material
Supplementary Table S1
Supplementary Table S2
Supplementary Table S3
Abbreviations Used
References
Supplementary Material
Please find the following supplemental material available below.
For Open Access articles published under a Creative Commons License, all supplemental material carries the same license as the article it is associated with.
For non-Open Access articles published, all supplemental material carries a non-exclusive license, and permission requests for re-use of supplemental material or any part of supplemental material shall be sent directly to the copyright owner as specified in the copyright notice associated with the article.