
Abstract
Background:
Differential kidney function assessment is an important part of preoperative evaluation of various urological interventions. It is obtained through dedicated nuclear medical imaging and is not yet implemented through conventional Imaging.
Objective:
We assess if differential kidney function can be obtained through evaluation of contrast-enhanced computed tomography(CT) using a combination of deep learning and (2D and 3D) radiomic features.
Methods:
All patients who underwent kidney nuclear scanning at Mayo Clinic sites between 2018–2022 were collected. CT scans of the kidneys were obtained within a 3-month interval before or after the nuclear scans were extracted. Patients who underwent a urological or radiological intervention within this time frame were excluded. A segmentation model was used to segment both kidneys. 2D and 3D radiomics features were extracted and compared between the two kidneys to compute delta radiomics and assess its ability to predict differential kidney function. Performance was reported using receiver operating characteristics, sensitivity, and specificity.
Results:
Studies from Arizona & Rochester formed our internal dataset (n = 1,159). Studies from Florida were separately processed as an external test set to validate generalizability. We obtained 323 studies from our internal sites and 39 studies from external sites. The best results were obtained by a random forest model trained on 3D delta radiomics features. This model achieved an area under curve (AUC) of 0.85 and 0.81 on internal and external test sets, while specificity and sensitivity were 0.84,0.68 on the internal set, 0.70, and 0.65 on the external set.
Conclusion:
This proposed automated pipeline can derive important differential kidney function information from contrast-enhanced CT and reduce the need for dedicated nuclear scans for early-stage differential kidney functional assessment.
Clinical Impact:
We establish a machine learning methodology for assessing differential kidney function from routine CT without the need for expensive and radioactive nuclear medicine scans.
Introduction
Renal functional impairment commonly coexists with or results from an underlying structural abnormality of the kidney. In certain etiologies, such as obstruction, a urologic intervention can improve kidney function. In other situations, the intervention can negatively affect kidney function and result in renal impairment, such as in renal extirpative therapy for oncologic indications. The knowledge of the global kidney functional status and the differential function (DF) of each kidney may play a crucial role in the decision-making process in renal surgery. For instance, a radical nephrectomy can be performed for a very poorly functioning kidney harboring a small tumor, whereas excessive attempts are usually made to perform a nephron-sparing surgery in a patient with a solitary kidney that has a complex renal mass. 1
In clinical practice, computed tomographic scan (CT) is the most commonly obtained imaging modality for genitourinary evaluation. While this study provides excellent structural and anatomical evaluation, it offers limited information regarding kidney function. The main test that would quantify the DF is nuclear medical (NM) scanning of the kidney, which has some practical limitations such as high cost, the need to administer a radionuclide material, and time consumption. Moreover, the results can be affected by the CKD status, the shape of the kidney, the hydration status of the patient, and the use of certain medications.
Artificial intelligence (AI) in healthcare is gaining a lot of traction. It carries the potential ability to shift the paradigm in the management of various medical disorders. 2,3 The landscape of various AI techniques is expanding as these techniques are fueled by a large amount of data and armed by exponentially advancing computational capabilities. These technological advances have brought physicians and computer scientists together to jointly improve various aspects of health care. One such application of AI is using machine learning (ML) techniques and radiomics to identify subtle, complex patterns from medical images correlated with clinical findings.
Existing literature in urology primarily relied on simplistic image processing to estimate the volume of the kidney or needed additional testing for assessing differential kidney function. 4 The objective of this study is to develop and assess an ML model that would predict DF utilizing contrast-enhanced CT scans while using NM imaging as the ground truth. In this study, we fine-tuned a deep learning (DL) kidney segmentation model using our institutional database with more clinically relevant heterogeneity. We developed and assessed the performance of a delta-radiomics pipeline to predict the percentage of differential kidney function on a CT scan and compared the performance with traditional CT volumetric analysis on both internal and external test datasets.
Cohort Definition
Following Mayo Clinic Institutional Review Board approval, all consecutive patients who underwent NM imaging for kidneys acquired between 2018 and 2021 at our institution were collected. Our institution has different hospital sites in three different geographic locations (Rochester, Arizona, and Florida). The electronic medical records of these patients were automatically screened using rule-based natural language processing (NLP) to detect the patients who underwent CT scans of the kidney within a 3-month interval. Among those who fulfilled these criteria, we excluded the patients who underwent an intervention expected to alleviate the source of kidney function deterioration. No specific chronological order of the CT and NM kidney scans was used. Data regarding differential kidney function were also automatically extracted from free-text radiological reports using rule-based NLP techniques and were reviewed by the research team to ensure accuracy.
We collected the paired CT and NM data from Mayo Clinic, Arizona and Mayo Clinic, Rochester for internal model development (n = 323). The internal set would further be split into training (n = 256) and test sets (n = 67) according to patient ID. The segmentation model was also trained only using an annotated subset of training data (Supplementary Figure S3).
We performed external validation by using data from another geographically disparate site within Mayo Health System (Florida) during the same time period. As there are significant differences in practice patterns and patient demographics at the three sites, we speculated that such data division potentially emulates realistic external (to our training data) validation, and Mayo Clinic Florida data would become an external test set (n = 39). Figure 1 demonstrates a flow chart of the patient selection methodology used in this study. Table 1 represents the cohort characterization for both internal and external datasets and highlights the train and test splits.
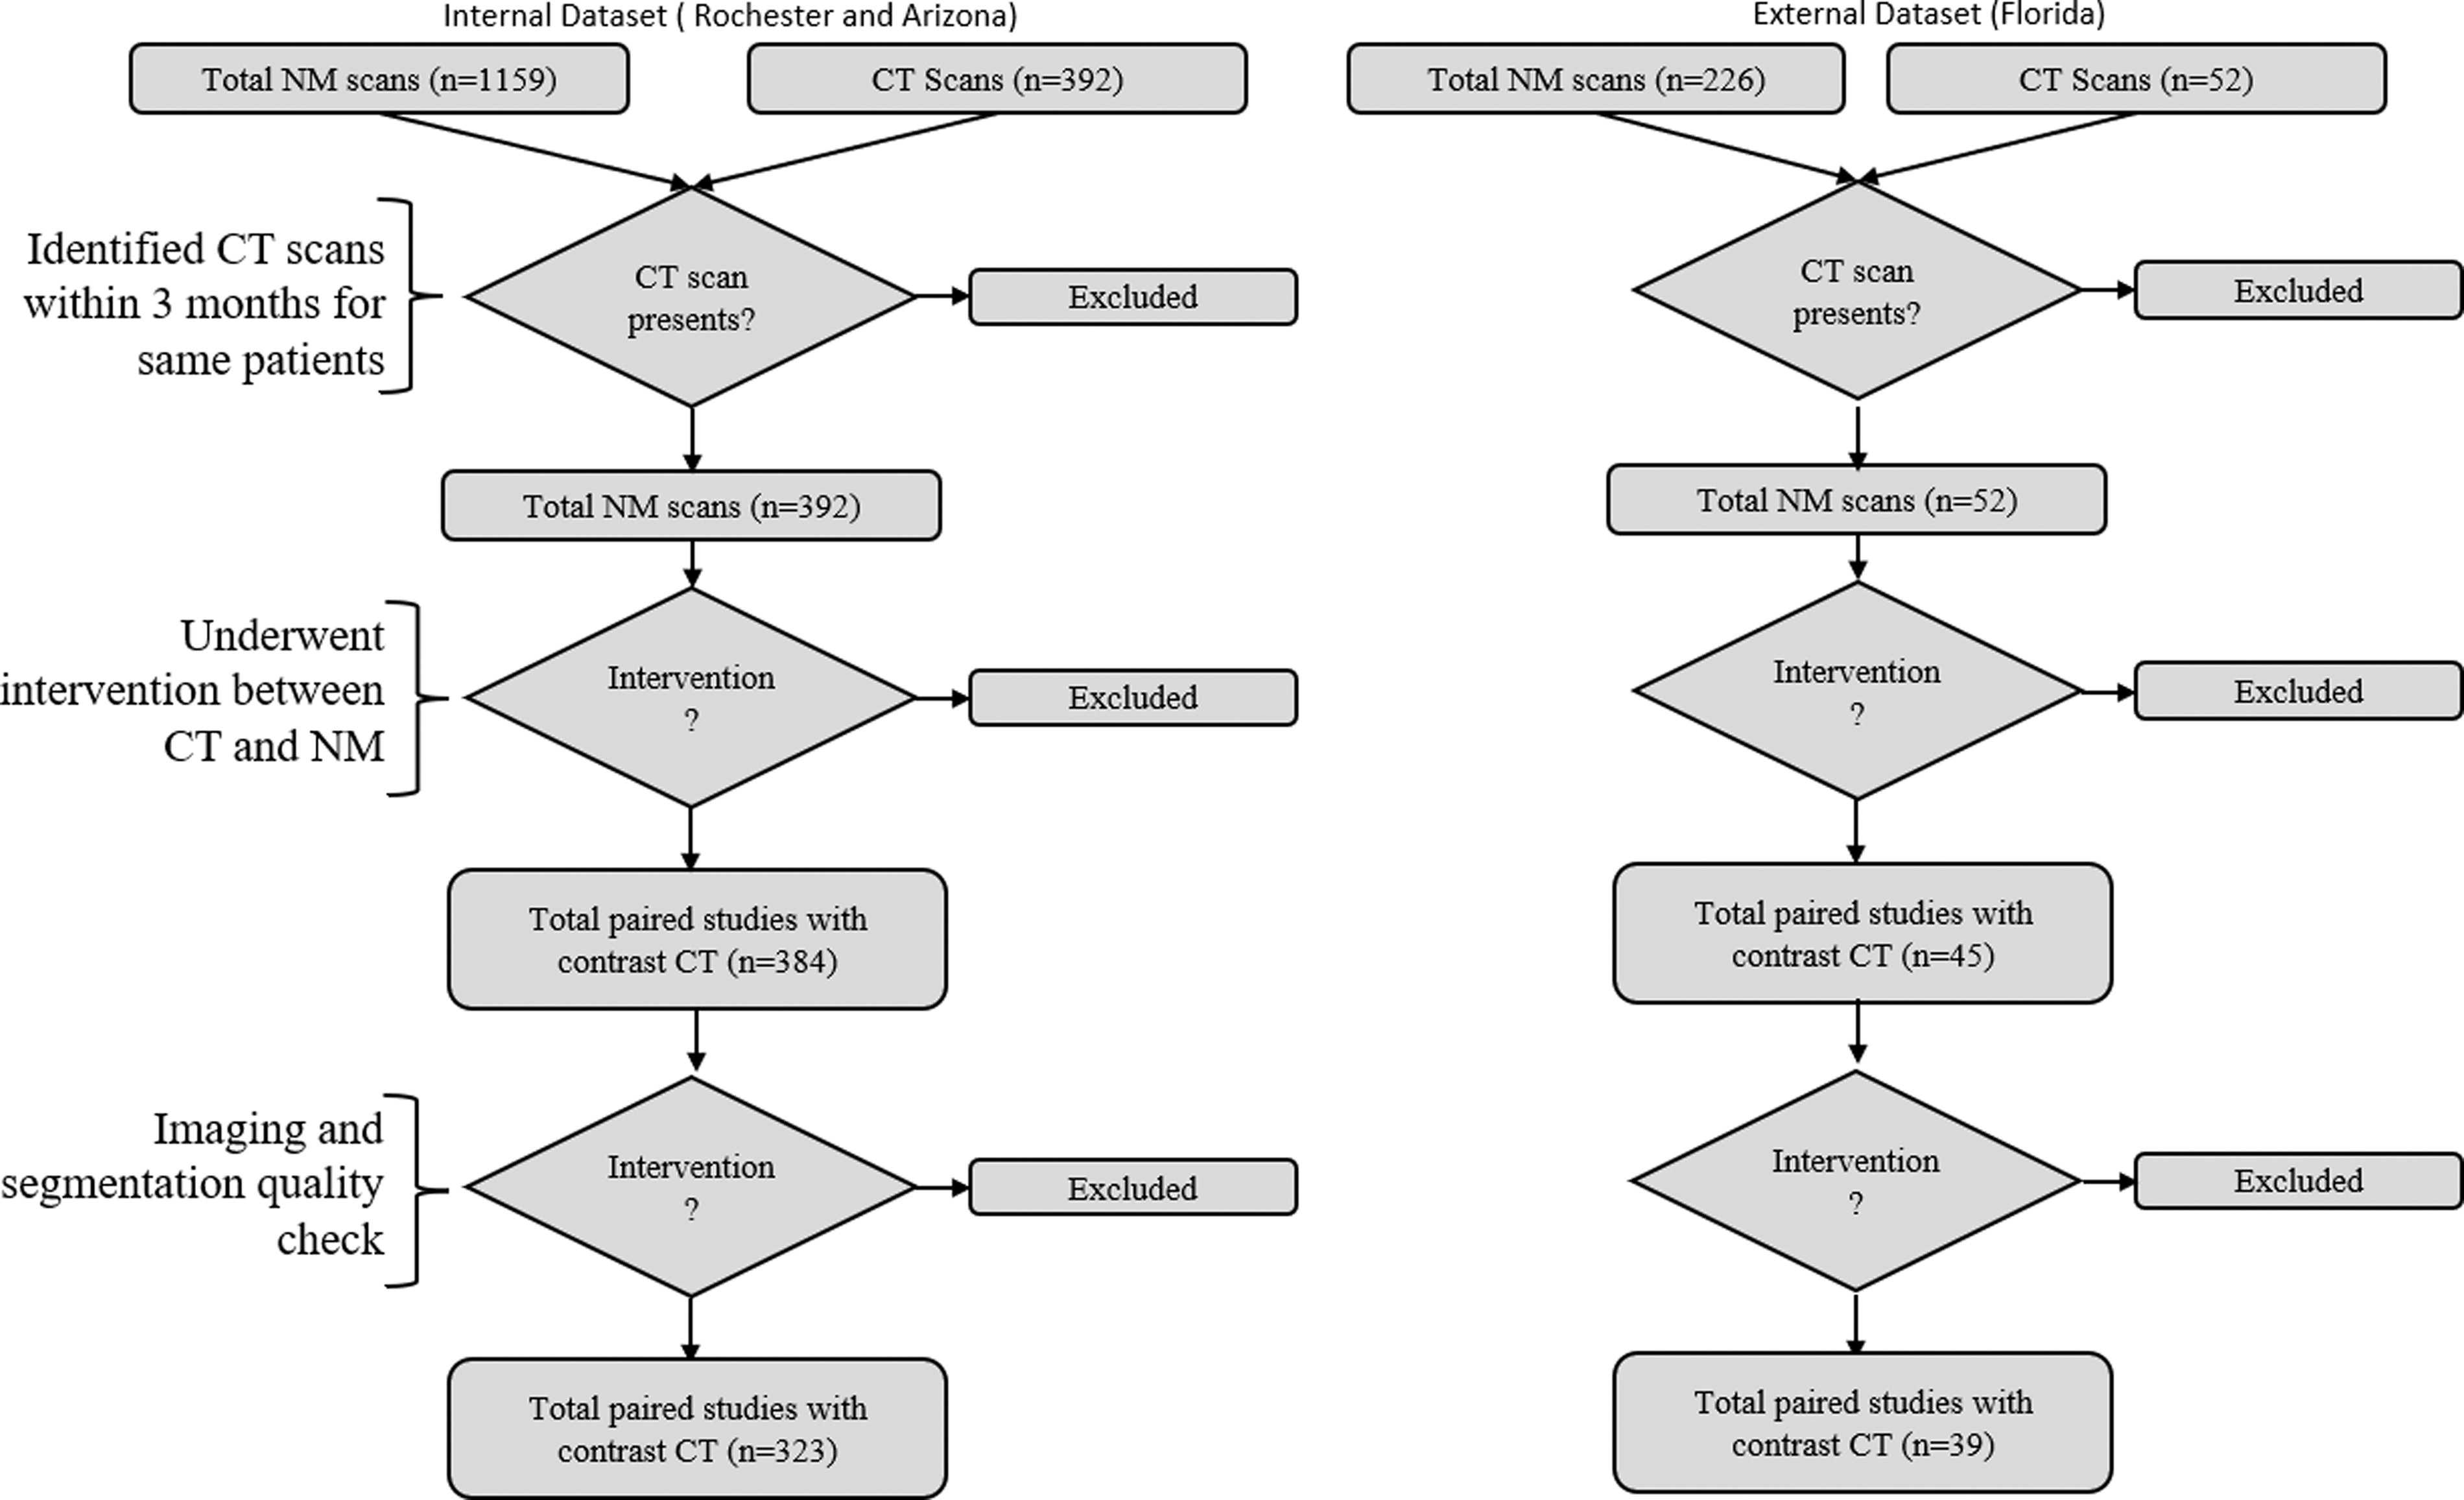
Study selection flowchart.
Characteristics of the Cohorts Used in the Study
NM = nuclear medicine; M = male; F = female; SD = standard deviation.
Materials and Methods
We proposed a fully automated AI pipeline for assessing differential kidney function (Fig. 2A). The pipeline is composed of the following key steps:
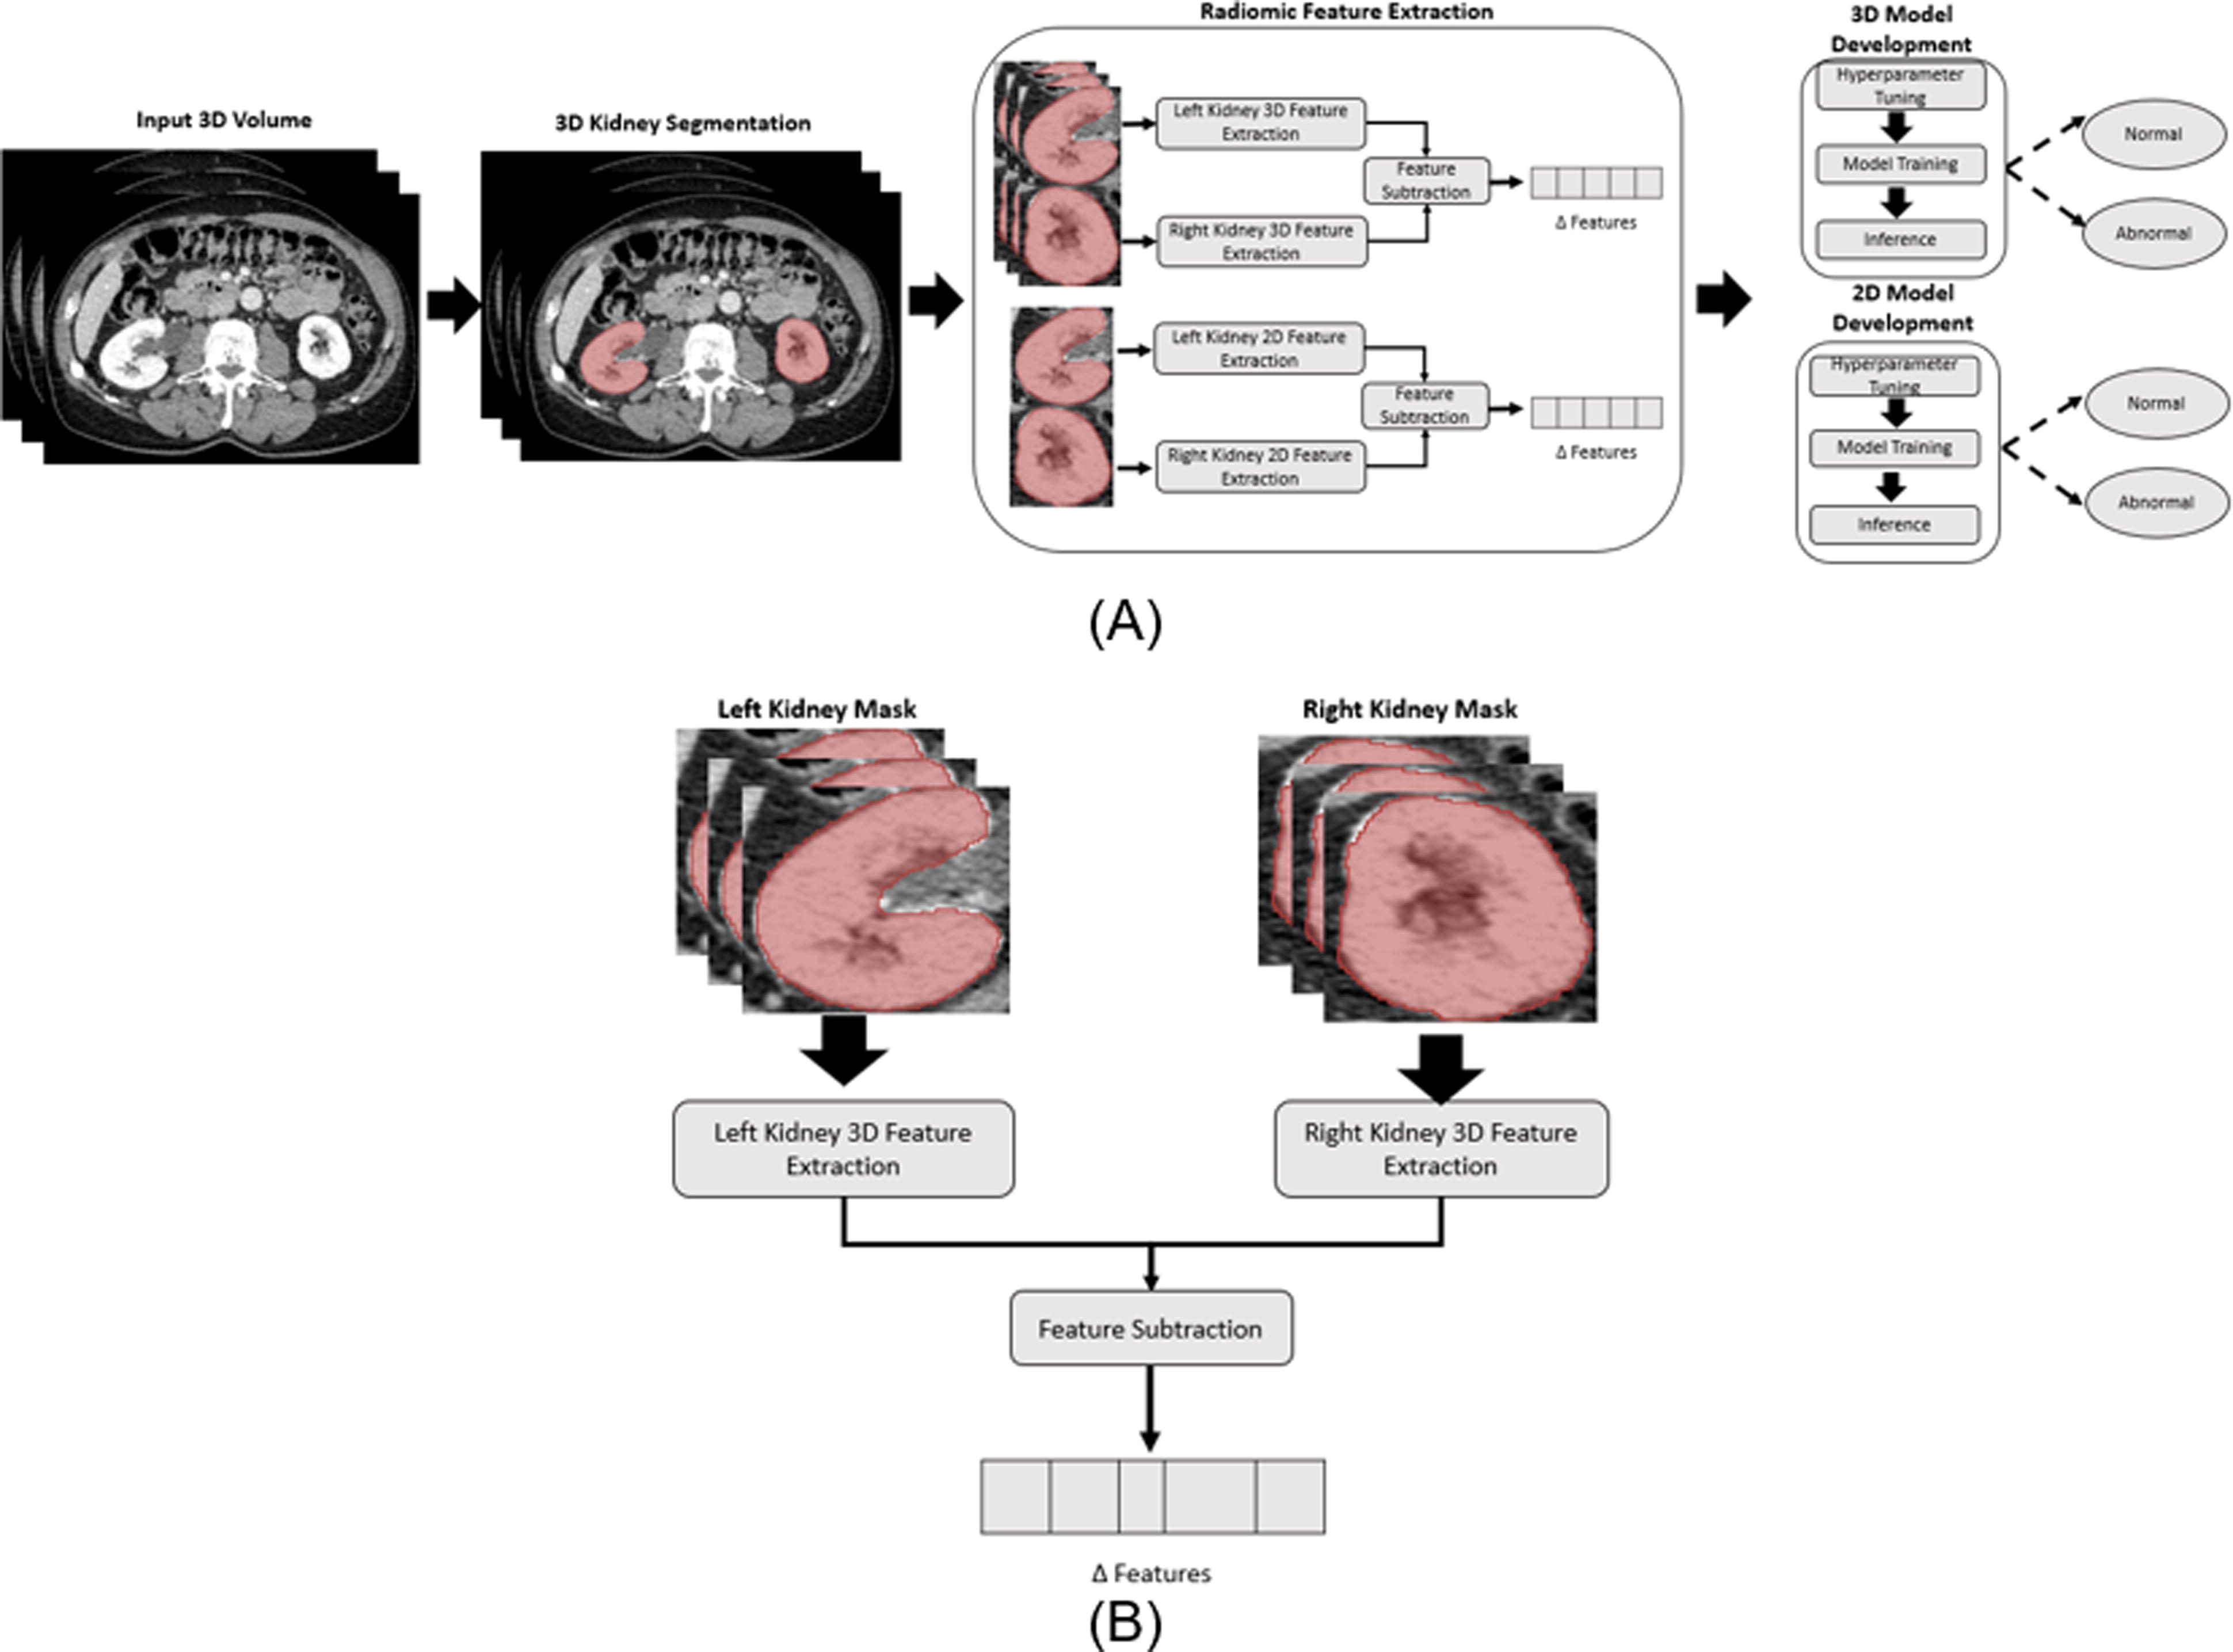
Workflow showing the pipeline for the proposed model-
Automated segmentation of kidney
Automatic segmentation refers to the process where a model will automatically identify an area of interest within the cross-sectional imaging. In our study, the segmentation model attempts to delineate the kidney area precisely without ignoring part of the kidney parenchyma or including non-kidney components. This was accomplished using a DL segmentation model to produce a delineation of the kidney parenchyma, referred to as segmentation masks from the abdominal CT scan. We initially evaluated the performance of a 3D U-net (U-shaped DL model) trained on data from the Kidney and Kidney Tumor Segmentation 2021 challenge (KiTS21). 5 However, the model was only trained on arterial phase images and our dataset consists of images in the venous phase, requiring the fine-tuning of the model for optimal segmentation quality. Fine-tuning refers to training a pre-trained model on new data to improve performance. For that purpose, an experienced urologist manually generated ground truth kidney segmentation masks using 3DSlicer®, which is a software that allows for the manual delineation of segmentation masks on medical images. 6 Once trained, the final models were used to produce kidney masks for all the images in the internal development dataset and external datasets.
Radiomic analysis
Radiomics analysis is a quantitative method that extracts numeric features from radiological images, e.g., texture and shape. Simply put, it translates some visual aspects of the images into numerical analyzable data. These radiomic features have the potential to provide an objective measure of the tissue’s appearance in the radiology images, allowing for the development of novel imaging biomarkers related to clinical and non-radiological outcomes. 7 Radiomic features can extract information from the entire image volume (3D features) or be obtained from a single slice (2D feature). In this work, we will extract both sets of radiomic images for all the images in our dataset and evaluate their efficacy for our task.
2D Radiomics analysis and Delta features
From each segmentation mask generated by the segmentation model, we extracted 630 2D radiomic features (i.e., the features obtained from a 2D cross-sectional image slice). We then designed a pipeline to compute the delta feature, which is the absolute difference in features obtained from the right vs the left kidney (Fig. 2B).
3D Radiomics analysis and Delta features
We developed a parallel analysis pipeline to extract 3D radiomics features from the 3D segmented kidney using the PyRadiomics library. 8 We extracted the same family of features as the 2D extraction, adding a third dimension and increasing our feature count to 982 features for the 3D radiomic analysis. Like 2D radiomics, delta 3D radiomics features are computed as absolute differences between the radiomics features computed directly from the left and right kidney masses (Fig. 2B).
Feature selection
Radiomic analysis usually results in a very large number of features. Not all of them are significant or predictive of the specific outcome of interest. Moreover, the large number of features can result in poor model performance. The process of identifying the important feature is called feature selection. In order to do so, we employed several techniques that would allow us to reduce the number of features to just those that would be most helpful for our tasks.
Model selection
We also evaluated multiple popular supervised classification models—random forest, support vector machine using the non-linear kernel, and decision tree. Each model was evaluated by combining the feature selection and classification strategy (see Table 2). The best feature selection strategy and hyperparameter selection, a technique where we evaluate the performance of different model training configurations, was done using the development sets training data, where the model performance was evaluated using a three-fold cross-validation strategy. The best model was then trained on the entire development training set and evaluated on the internal and held-out test sets.
Comparative Analysis of Class Wise Performance Using 2D and 3D Delta Features. Ninety-Five Percentage Confidence Interval is Calculated Using Auto Bootstrapping.
PCA = principal component analysis. Optimal Performance is Highlighted in Bold.
Results
Segmentation performance
The accuracy of segmentation models is measured on randomly selected test sets of eight internal CT studies using the Sorenson–Dice coefficient, a metric quantifying a model’s ability to identify the target structures while avoiding adjacent ones. Figure 3A demonstrates the performance improvement of finetuning, demonstrating an increase in average DICE from 0.78 to 0.86 Figure 3A demonstrates an example of a well-segmented transplanted kidney in the pelvis with the two native kidneys in place. Figure 3B demonstrates an example of accurately segmenting a herniated kidney in the chest. These two examples demonstrate our model’s ability to perform well in heterogeneous datasets with abnormal findings.
Delta radiomics performance for DF classification
The performance of 2D and 3D radiomic analysis was summarized in Table 2 regarding AUC, sensitivity, and specificity. We present the individual performance for normal and abnormal classes and the optimal combination of classification and feature selection. With 3D delta radiomics analysis, we achieved 84% sensitivity and 68% specificity on the internal dataset with an external dataset performance of 79% and 65%, respectively, for detecting the abnormal cases by training a random forest model after removing features with a correlation >80%. Meanwhile, using the same feature reduction technique, a model built using 2D radiomic features achieved a specificity of 68% and 62% on the internal dataset and 80% and 75% on the external dataset. The SHAPLEY value, measuring the impact made on classification by each of the top five features for each model, is included in Supplementary Figure S1. 9
Discussion
The main intuition behind this project is that the renal parenchymal appearance can indirectly reflect the function of the kidneys. We hypothesized that a delta radiomics ML technique can identify subtle features in the kidneys that are not perceptible to people, and these can subsequently be translated into an objective, interpretable numerical result that correlates with kidney function. This methodology is commonly used to uncover tumor characteristics that fail to be appreciated by the naked eye and may help provide insight into cancer behavior but are not widely used in functional analysis. 7 In this study, we demonstrated the feasibility of deriving DF results from contrast-enhanced CT scan images using a completely automated process that involves both ML and DL methods. Using a fine-tuned segmentation model, we were able to perform semantic segmentation of the kidneys, and we were able to derive radiomics features that were predictive of the DF as a categorical variable with good levels of accuracy. Additionally, we elected to choose a cutoff difference of 20% between the kidney units as this provided the most clinically meaningful conclusion that can potentially help in real-life decision-making.
These results have multiple important implications for future care of kidney disorders. The knowledge about the kidney split function is known to be an important factor in predicting future kidney function following radical nephrectomy. 10 This may affect the decision-making process for a significant percentage of kidney cancer patients, as CT is by far the most commonly obtained study in genitourinary surgery planning, and having the ability to get these automated results may obviate the need to obtain NM images. Which, in turn, will assist patients with limited access to nuclear imaging services and potentially save a significant cost. Furthermore, this may offer the ability to assess DF longitudinally for patients who require periodic surveillance imaging, such as in renal cancer.
This is the first AI-oriented experiment that tried to derive the functional status of the kidney from contrast-enhanced CT. However, previous efforts have been made to assess the statistical correlation between the anatomical features of the kidney and its function. Sun et al. used a U-net model to segment kidneys with chronic urinary obstruction and found a statistical correlation between renal parenchymal volume and renal sinus volume with a split glomerular filtration rate. 11 Their results did not predict the actual split kidney function for each patient, and no other radiological features were tested. Similarly, Hua et al. assessed the correlation between CT volumetry and NM split renal function prior to kidney donation and identified a strong correlation. 4 These results were reproduced by multiple other similar studies that assessed CT volumetry. 12 –14 In our current study, we felt that the application of ML and radiomics features may help avoid some pitfalls that may arise from kidney volumetric analysis. Merely relying on volumetric analysis can result in poor outcomes in many cases where the volume may be preserved. Still, a significant proportion is replaced by a non-functioning component or affected by hypertrophy or edema (Supplementary Figure S2).
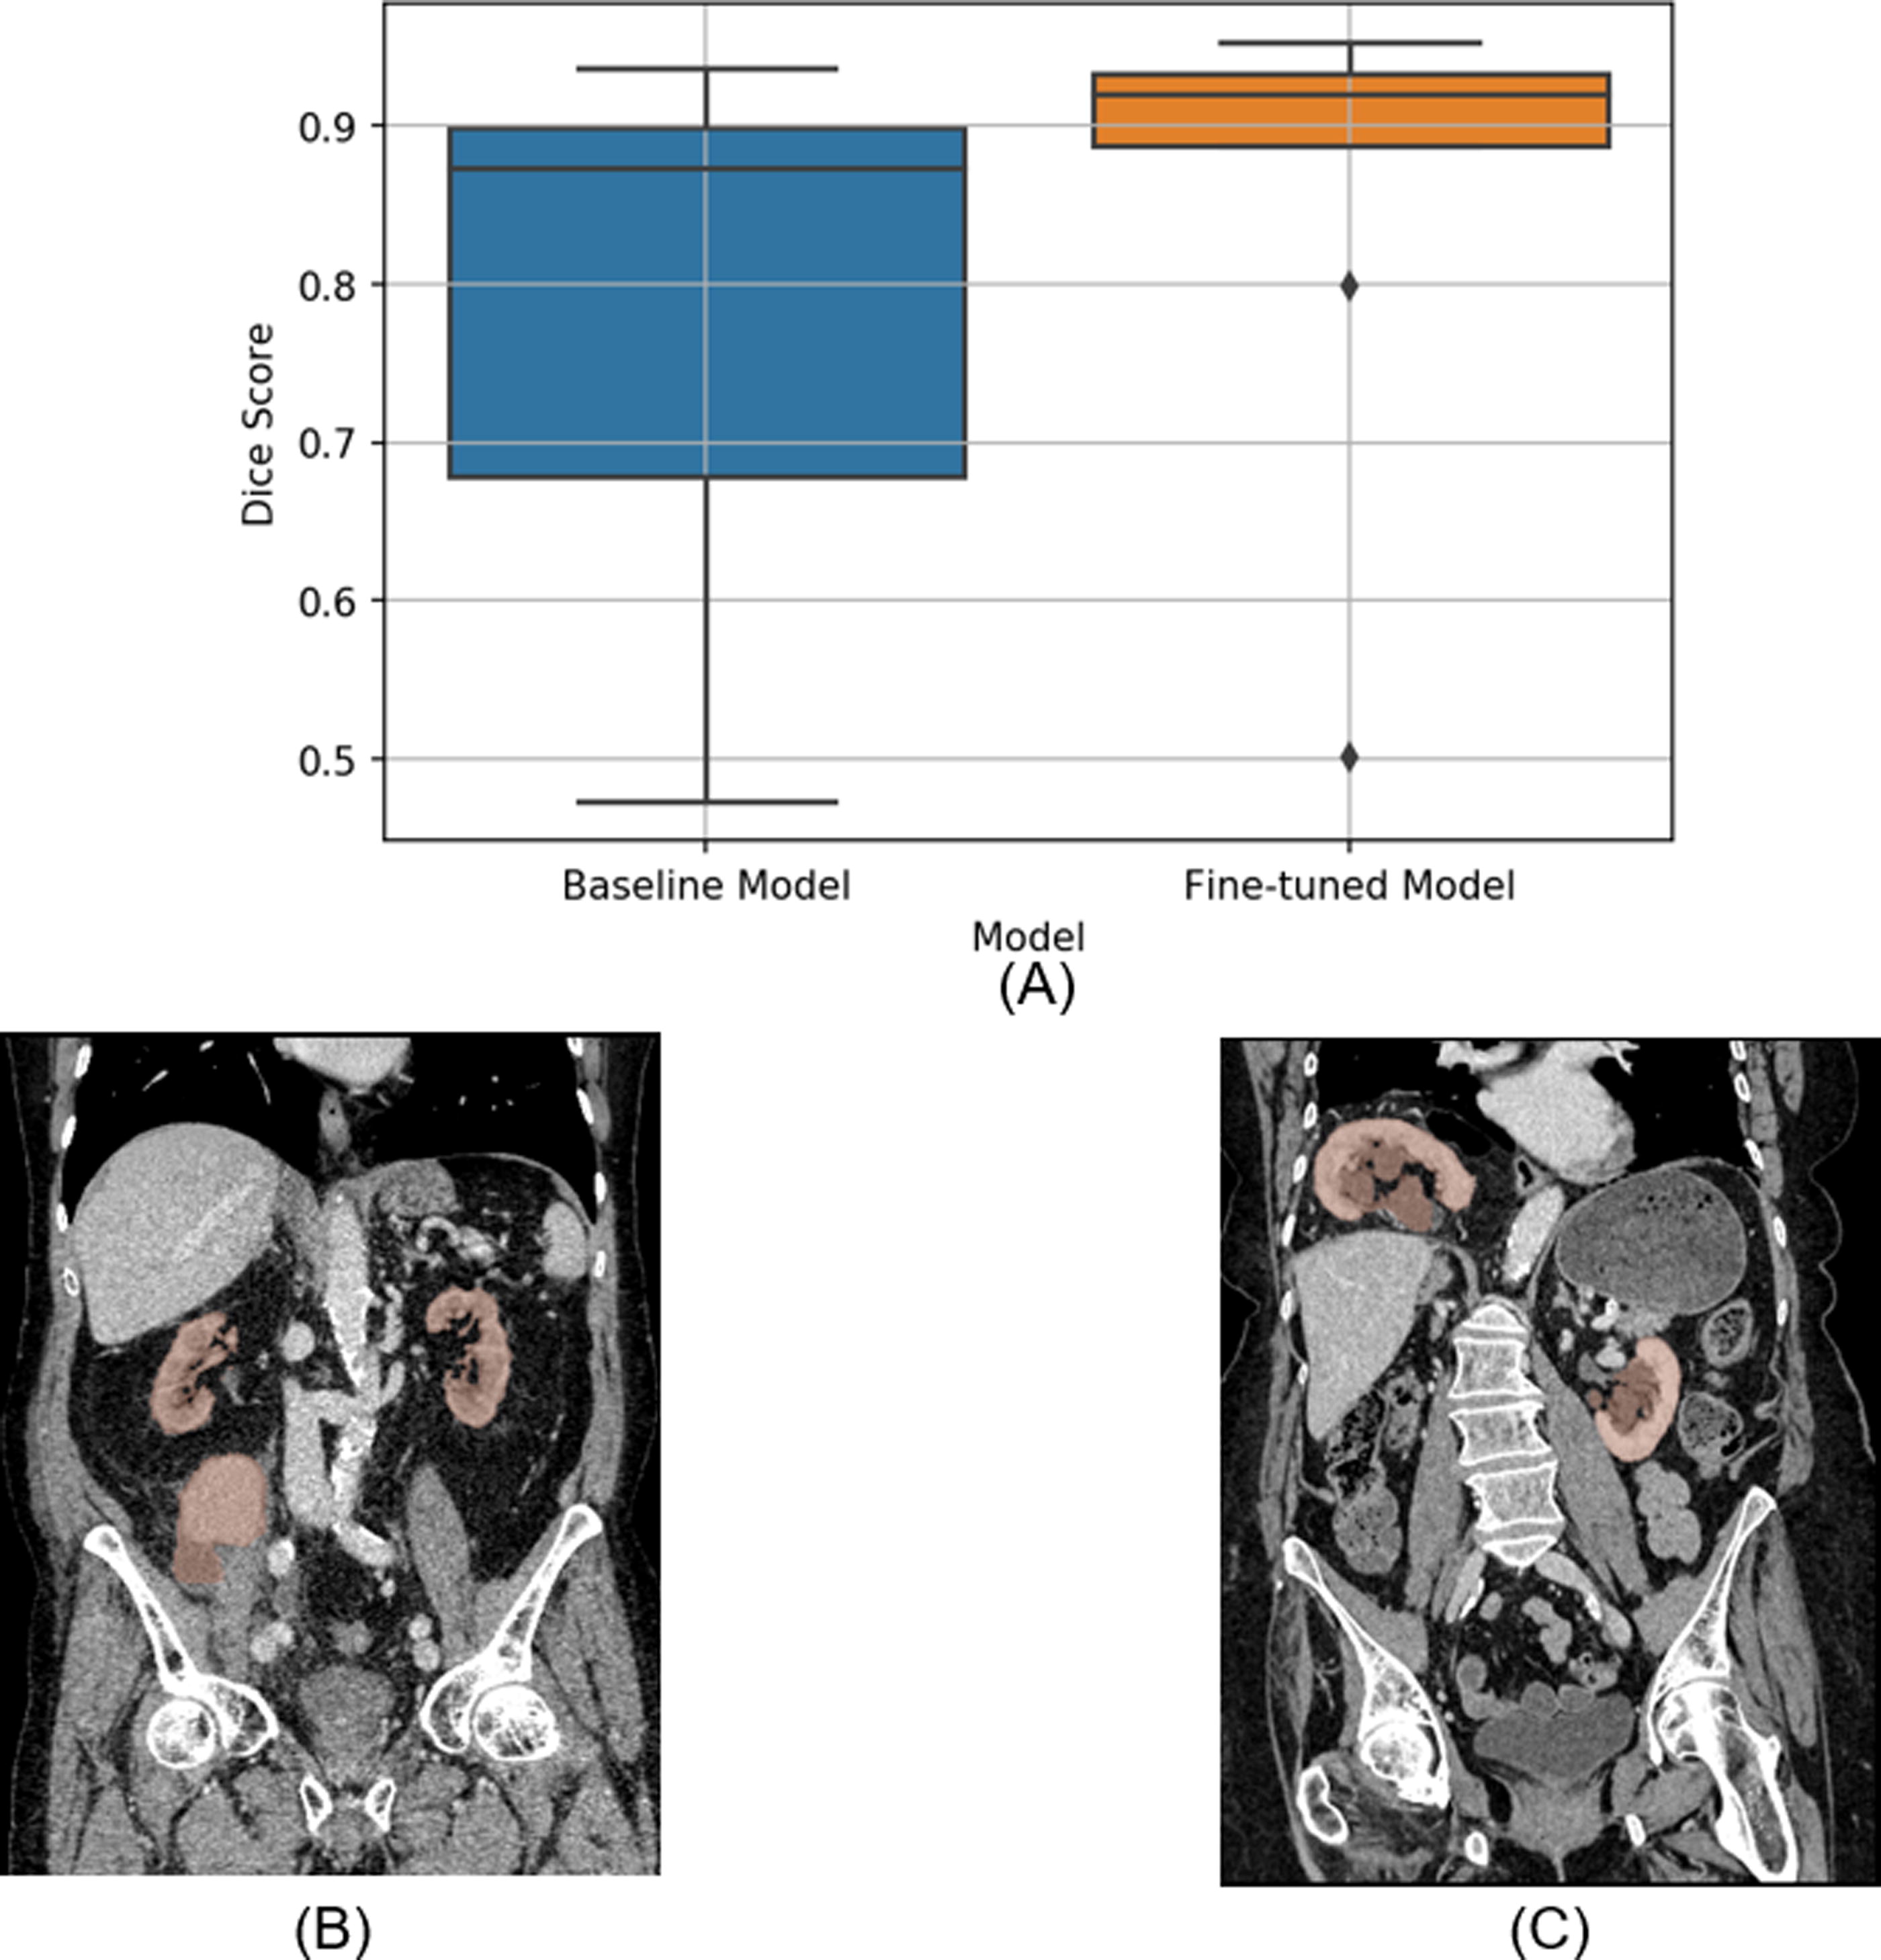
Segmentation performance of the deep learning model:
Our study has many strengths. All imaging studies were consecutive patients obtained over a long period of time and included different geographical sites. This resulted in a significant variation in image acquisition techniques, which made the results more generalizable. Minimal exclusion criteria were implemented (other than interventions that may affect the results). Our database was heterogeneous and reflected the cases presenting in real-life clinical practices, such as patients with external foreign bodies, kidney transplants, and patients who underwent previous nephrectomies. All series were included in the analysis, and results were correlated with various types of radionuclide materials. No specific cut-off points were included for kidney function or glomerular filtration rate, and no specific etiology for kidney function deterioration was excluded. All these factors combined support the generalizability of this model for future practice.
This experiment had some limitations that could not be overcome. The current segmentation model has less performance compared with other published models of kidney segmentation, but that is in part related to our dataset being more heterogeneous and targeting all possible renal pathologies, whereas the other models were specifically tailored for kidneys with tumor segmentation only. Moreover, our data set differs in the contrast phase utilized. While the original KiTS21 cohort 15 –17 utilized arterial phase CT scans, our data consisted of venous phase CT scans. We fine-tuned the model trained on the KiTS21 cohort using a subset of internal data (n = 67). Supplementary Figure S3 demonstrates fine-tuned segmentation improvement on an abnormal study. We believe that if samples of all the renal pathologies can be included within the internal training set, the performance of the segmentation model can be improved even further.
Conclusion
The current study demonstrated the feasibility of accurately predicting differential kidney function utilizing data automatically curated from CT imaging and analyzed using radiomic techniques. These results are promising and can potentially provide valuable differential kidney functional data that will facilitate clinic management and enrich academic interest in this specific space.
Footnotes
Authors’ Contributions
The authors confirm their contribution to the article as follows: I.B., H.A.-M., R.C., B.P.: Study conception and design. R.C., J.J., H.A.-M., I.B.: Analysis and interpretation of results. I.B., H.A.-M., R.C., J.J.: Draft article preparation; All authors reviewed and approved the final article.
Author Disclosure Statement
The authors confirm there are no conflicts of interest at the time of submission.
Funding Information
Partially supported by SUNY-Nano-Biomaterials Consortium award. [53139 (Sanyal)]
Supplementary Material
Supplementary Figure S1
Supplementary Figure S2
Supplementary Figure S3
Abbreviations Used
References
Supplementary Material
Please find the following supplemental material available below.
For Open Access articles published under a Creative Commons License, all supplemental material carries the same license as the article it is associated with.
For non-Open Access articles published, all supplemental material carries a non-exclusive license, and permission requests for re-use of supplemental material or any part of supplemental material shall be sent directly to the copyright owner as specified in the copyright notice associated with the article.