
Abstract
Background and Objective:
The cost of imaging and interventions in the surgical field varies between countries and sometimes within different regions of the same country. Procedural cost takes into account equipment, consumables, operating room, surgical, anesthetic and nursing teams, radiology, medications, and hospital stay. Health care systems therefore face an incredible burden related to investigations and surgical procedures. The aim of this study was to collect costs of imaging and interventions for kidney calculi across different hospitals and health care systems in the world.
Methods:
An online shared Google spreadsheet was created by the European Association of Urology Young Academic Urology urolithiasis group. The survey consisted of the cost of four radiological imaging (ultrasound of the urinary tract [USS], plain X-ray radiography of the abdomen including kidneys, ureter, and bladder [XRKUB], noncontrast-enhanced computerized tomography [CTKUB], and contrast-enhanced CT with urographic phase [CTU]) and seven interventions (endoscopic laser treatment of renal stones, ureteroscopic treatment or extraction of ureteral stones, percutaneous nephrolithotomy (PCNL), insertion of ureteral stent, diagnostic ureteroscopy, and cystolitholapaxy). A chosen representative from each country collected and collated the data, and this was converted to Euros (€).
Key Findings and Limitations:
Data were collected from 32 countries, which include Turkey, Armenia, Nepal, Uzbekistan, Brazil, Chile, Qatar, Peru, Israel, Singapore, Thailand, Colombia, Argentina, Saudi Arabia, Asia, North America, 15 countries from the European continent, and the United States. The mean cost of USS, XRKUB, CTKUB, and CTU was 51.3 € (range: 2–160 €), 27.1 € (range: 2.5–187 €), 105.8 € (range: 19–405 €), and 171.5 € (range: 19–674 €), respectively. Similarly, the cost of endoscopic laser treatment of renal stones, ureteroscopic treatment/extraction of ureteral stones, PCNL, insertion of ureteral stent, diagnostic ureteroscopy, and cystolitholapaxy was 1942.6 € (range: 100–7887 €), 1626.8 € (range: 80–9787 €), 2884.6 € (range: 110–12642 €), 631 € (range: 110–2787 €), 861.6 € (range: 3–2667 €), and 876 € (range: 19–3457 €), respectively. Wide differences in cost between countries were found within the study.
Conclusions and Clinical Implications:
This study highlights the significant economic impact of kidney stone management on health care systems worldwide. There seem to be significant disparities between costs, and this study shows the social and economic inequalities in health care access, which can differ significantly between private and public health care. These results can aid policymakers to address these disparities and perhaps to learn from other health care providers.
Background and Objective
Kidney stone disease (KSD) is an increasingly common condition affecting patients who often require hospitalization, imaging, and surgical treatment. The prevalence of KSD is increasing worldwide, with a lifetime prevalence estimated between 1% and 15% and recurrence rates of 26% in 5 years’ time. 1 The prevalence patterns are changing in relation to geographical areas 2 but also to dietary, climatic, and genetic factors. 3 Although KSD mostly affects males, especially in the 5th and 6th decades of life, women are nowadays also increasingly being affected. 4,5
Disease-associated cost for the management of KSD involves dealing with the disease and the economic burden of time spent off work and on the health care system, and this cost seems to be increasing proportionally to the increase in the disease prevalence. 6 Recent forecasts indeed show a prediction of increment of the total cumulative costs of care for patients with KSD, estimated to be $1.24 billion per year by 2030. 7 Previous studies have looked at the impact of KSD on the financial impact. 8,9 However, these mainly analyzed the cost-effectiveness of the procedures used for stone treatment. These figures include hospital admissions, medications, and loss of workdays.
In the pathway of a KSD patient, the cost of imaging and interventions must be considered at multiple stages. Despite most health systems working on national standardized tariffs, the costs of imaging and procedures can vary enormously between countries and sometimes within different regions of the same country. Procedural costs include equipment, consumables, operating room usage, surgical, anesthetic, and nursing time, radiology and prescription of medications, hospital stay, rehospitalizations, and cost of follow-up or repeat procedures. In view of the increasing number of patients affected by KSD, cost-effectiveness analysis has therefore gained renewed interest. This was already used by clinicians and managers to justify and promote less cost-effective procedures. 10 The health systems face an incredible burden related to investigations and surgical procedures related to the diagnosis, treatment, and follow-up of patients with KSD. This study aimed to collect the costs of imaging and interventions for urinary tract calculi across different hospitals and health care systems worldwide.
Methods
To this aim, the European Association of Urology (EAU) Young Academic Urology urolithiasis and endourology working party created a survey based on an online shared Google spreadsheet. The survey aimed to collect the cost for health care providers in relation to four radiological imaging and seven surgical procedures. The selected imaging methods were all pertinent to urinary tract stones and KSD and include plain X-ray radiography of the abdomen including kidneys, ureter, and bladder (XRKUB), ultrasound of the urinary tract (USS), noncontrast-enhanced computerized tomography (CTKUB), and contrast-enhanced CT with urographic phase (CTU). Moreover, the economic burden of seven different surgical interventions for KSD and bladder stones was analyzed. These included endoscopic laser treatment of renal stones (FURSL/RIRS), ureteroscopic treatment of ureteral stones, ureteroscopic extraction of ureteral stones, percutaneous nephrolithotomy (PCNL), insertion of a Double-J ureteral stent, diagnostic ureteroscopy, and cystolitholapaxy. One senior urological surgeon (of a level of consultant with a minimum of 5 years’ experience) with special expertise in endourology was selected to represent each country. Only one representative per country was allowed to participate.
The expert was selected according to his/her academic profile and scientific activity. The participants had the task to source the cost relative to the above-mentioned imaging methods and procedures within the public health system of their countries. The chosen currency was Euros (€) because of the majority of European countries involved. Hence, the remaining figures were converted into Euro using the currency rate of the day of conversion (04/01/2024). Data were extracted, collated, and analyzed. When the provider from a given country entered a range of costs rather than average costs in the Google spreadsheet, the mean cost was calculated based on the lower and upper range of costs for a given imaging or procedure. For each imaging or procedure cost, the distribution of data was reported as median and interquartile ranges. Physicians from some of the countries unfortunately could not have access to health care spending and cost information. Those countries had therefore to be excluded, and we were not able to analyze their result.
Key findings and limitations
Data were collected from 32 countries, including Turkey, Armenia, Nepal, Uzbekistan, Brazil, Chile, Qatar, Peru, Israel, Singapore, 11 Thailand, Colombia, Argentina, Saudi Arabia, Asia, Canada, 15 countries from the European continent, and the United States. The cost of private practice was taken into consideration for the United States, India, Argentina, and Colombia, as public health systems were not efficient, not provided to the general population, or in case data were not accessible for collection.
The mean cost of USS, XRKUB, CTKUB, and CTU was 52 € (range: 2–160 €), 26.7 € (range: 2–187 €), 118 € (range: 19–337 €), and 194.5 € (range: 19–606 €), respectively. Similarly, the cost of FURSL, ureteroscopic treatment/extraction of ureteral stones, PCNL, insertion of a Double-J stent, diagnostic ureteroscopy, and cystolitholapaxy was 1942.6 € (range: 100–7887 €), 1626.8 € (range: 80–9787 €), 2884.6 € (range: 110–12642 €), 631 € (range: 110–2787 €), 861.6 € (range: 3–2667 €), and 876 € (range: 19–3457 €), respectively. Wide differences in cost between countries were found within the study.
Costs of imaging and procedures are summarized in Tables 1 and 2. Differences in costs of imaging between countries were high, with ranges between 19 and 607 €, 19 and 338 €, 1 and 187 €, and 3 and 230 € for CTU, CT KUB, XRKUB, and USS, respectively (Fig. 1). Countries consistently listed with the lowest costs for imaging (≤25th percentile) were Brazil, Colombia, Nepal, Peru, Qatar, Turkey, and Uzbekistan, with costs not exceeding 58 €, 29 €, 5 €, and 9 € for CTU, CTKUB, XRKUB, and USS, respectively. Countries consistently listed with the highest costs for imaging (>75th percentile) were Switzerland, Thailand, and the United States, with costs of at least 359 €, 223 €, 33 €, and 73 € for CTU (Fig. 2), CTKUB, XRKUB, and USS, respectively.
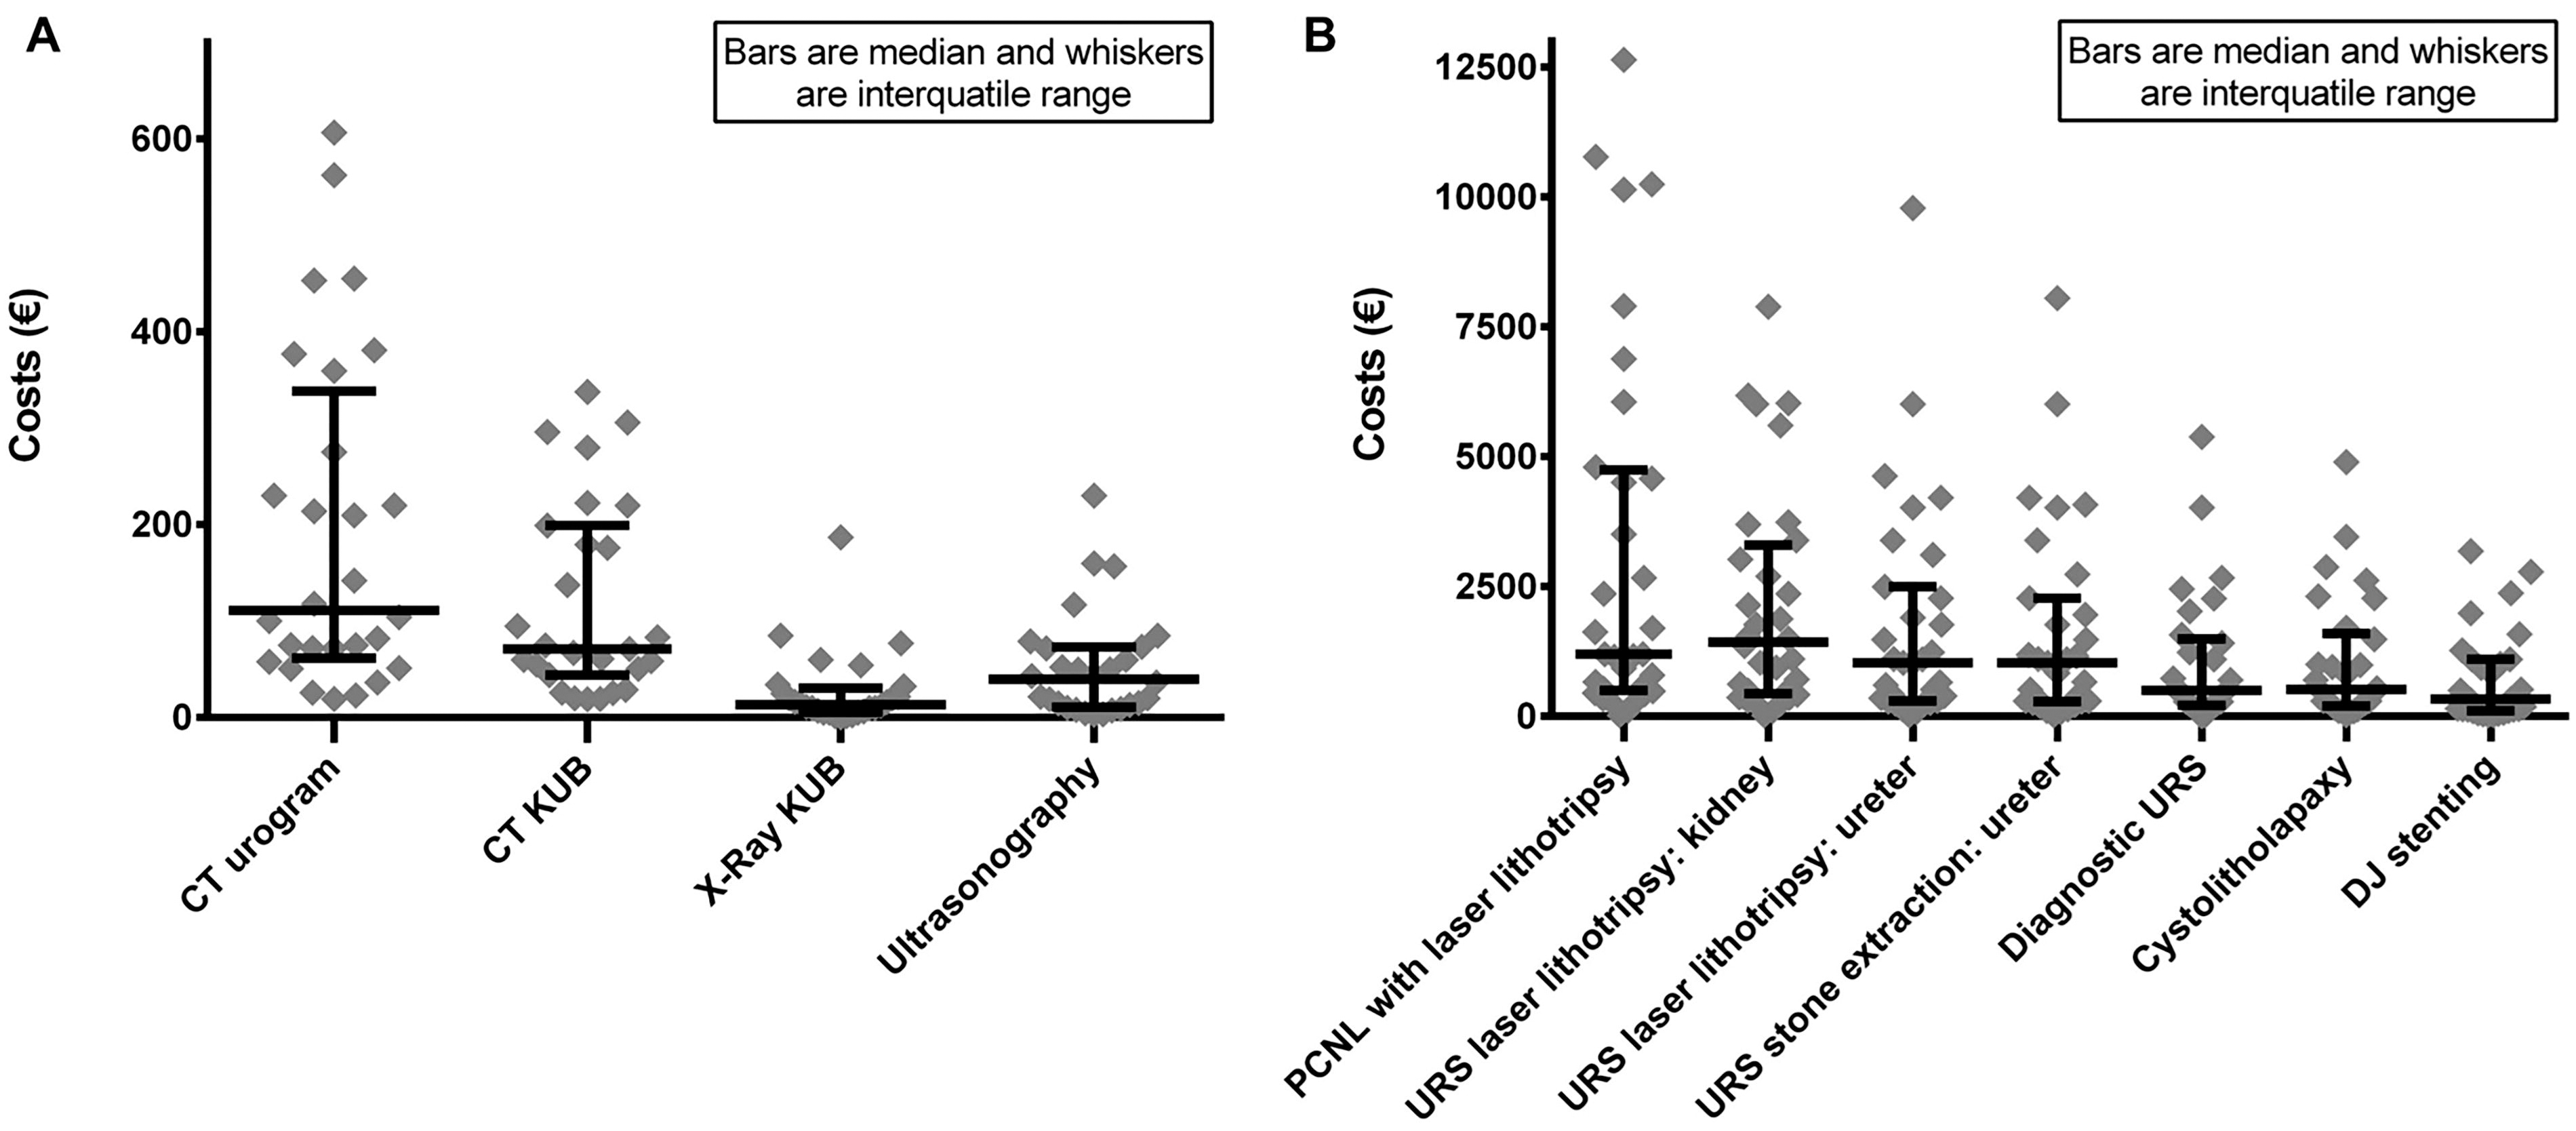
Scatter plot of cost of imaging and procedures worldwide.

World map showing differences for costs of one index imaging and procedure between countries.
Costs of Imaging
IQR = interquartile range; N.a. = not available.
Data from private practice.
Costs of Procedures
Data from private practice.
IQR = Interquartile range; N.a. = Not available.
Differences in costs of procedures between countries were also high, with ranges between 19 and 12642 €, 19 and 7887 €, 0 and 9787 €, 19 and 8050 €, 3 and 5380 €, 19 and 4900 €, and 19 and 3180 € for PCNL, FURSL, URS laser lithotripsy (ureter), URS stone extraction, diagnostic URS, cystolitholapaxy, and ureteral stenting, respectively (Fig. 2). Countries listed with the lowest costs (≤25th percentile) for at least six of the seven evaluated procedures were Argentina, Brazil, Nepal, Qatar, and Serbia, with costs not exceeding 427 € for any of these procedures. Countries listed with the highest (>75th percentile) for at least six of the seven evaluated procedures were Austria, Netherlands, Norway, Switzerland, the UK, and the United States, with costs of at least 1272 € up to 10774 €.
Differences between continents exist, particularly between European countries and the rest of the world. When analyzing differences in imaging cost, it is evident how non-European countries show a cost below the 50th percentile for every type of imaging. Most European countries except Romania showed instead a cost of imaging above the 50th and the 75th percentile. Only a few non-European countries such as Thailand, Argentina, Israel, Singapore, and the United States followed the same European profile. Considering the cost of interventions, countries that showed costs lower than 50th percentile were mostly non-European but did include a few European countries such as Romania, Poland, and France. For PCNL and FURSL, costs were above the 50th percentile, showing values between 1500 € and 12000 € for most European countries, Thailand, Saudi Arabia, the United States, and Israel.
Discussion
This article aims to analyze the worldwide cost of imaging and procedures related to KSD management. To our knowledge, this is the first study comparing costs in endourology, collected by health care physicians. It is known that the epidemiology of KSD is changing, and this affects not only the health and quality of life of the affected individuals but also the economic burden posed to the health care systems. Recent studies have shown that with global warming and a rise in the ambient temperature, also the incidence of KSD will increase. 12,13 This, along with lifestyle factors, is causing a steep rise in KSD incidence worldwide, including in countries and areas that have historically had low rates. 14
KSD-related costs are forecasted to increase by 25% in 2050 because of the climatic and dietary influence on stone recurrence rates. 15 In addition to the health care cost of managing KSD, loss of work and productivity because of pain or stone-related events also need to be considered. Data from the United States already showed annual expenditures of around $2.1 billion in 2000, which considered inpatient care, outpatient care, and admissions to emergency departments. 16 Sadly, in an insurance-based health system, this translates into suboptimal health care access for parts of the population without access to private insurance. Those individuals, because of lower socioeconomic status, have a higher risk of suffering from more complex stone-related disease and pathology, hence not infrequently needing multiple and staged interventions. 17,18
Regarding approaches to KSD management, preventative strategies are also paramount in reducing the cost of recurrences and hospital readmissions and the further interventions needed for them. Among the surgical interventions, studies show that FURSL and PCNL are the most efficient methods because of their higher stone-free rate, as patients have lower recurrence rate and readmissions when compared with shockwave lithotripsy (SWL). 19,20 Although this might mean a more invasive procedure, the cost argument has been challenged by the “Therapeutic Interventions for Stones of the Ureter trial from the UK.” 21
KSD also carries a considerable clinical and cost burden in the preoperative work-up, especially for complex stones, often needing CTU and/or three-dimensional reconstruction to plan the best surgical strategy. Cost can limit the accessibility to modern imaging, which is not guaranteed in every country. Often, a balance between resources and clinical priority is needed to ensure the best outcome for the patients. 22 Similarly, the same cost dilemma arises for follow-up involving routine use of USS, CT, or plain radiography for KSD as stated by the most up-to-date EAU guidelines. 1
An interesting study by Alevizopoulos et al. found that surveillance and conservative management were more cost-effective than operation in patients with stones <10 mm, as most of these patients ended up passing the stones spontaneously, thereby not needing any intervention. The total mean cost for the group managed conservatively was £764.24, whereas the cost of operation was £1317.39. 23 Similarly, Lotan et al. analyzed the cost of postoperative follow-up. They showed that routine scans were expensive compared with imaging triggered by pain or symptoms. This additional cost was justified in the context and importance of preventing renal loss by possible silent ureteral obstruction. 24
This study also demonstrates socioeconomic differences between countries, which are reflected by the economic burden and cost of imaging and procedures in different countries. The heterogeneous results triggered an economic reflection on the purchasing power parity (PPP). This theory was introduced by “The Economist” in 1986 and is a tool used to compare incomes and nations’ cost of living. Parity is the currency unit needed to buy the same good in different countries. According to this principle, the disparity can be quantified as the difference in the number of goods that can be purchased in each country with a single unit of currency. Based on this concept, to compare countries’ PPP more effectively, the country’s purchasing power was measured by the money needed to buy a Big Mac, considered a good comparator, with identical characteristics worldwide. The Big Mac PPP exchange rate gives a practical idea of the currency value in different countries, relating to the amount of goods that it is possible to buy with the national salary. 25 For example, a similar concept has been previously used in marketing research to calculate cigarette affordability in various countries. 26
On the contrary, in the medical field, this was used to highlight the wide disparity in the cost of oncological treatment between different countries, where this was found to be disproportionate to monthly salaries. 27 If we want to apply the concept to health systems, we can translate the PPP concept and create the term “Caring Power Parity,” as our study acknowledges how some countries have much higher health care costs than the national salary permits, reducing health care to almost a luxury good, particularly in private health systems. Another important concept in health economics is the increasing health costs secondary to an aging population, which is becoming an issue for many developed countries. However, even in countries such as the United States, where a high percentage of the gross domestic product is spent on health care, the quality of service is not necessarily better for patients. 28
A few years ago, Strohmaier et al. tried to investigate different costs related to stone disease and acknowledged that most of this was spent on surgical procedures. They reported a wide variation with a cost of 2900 € in Sweden per stone removal, whereas in Great Britain, the average cost was 3520 €. In Germany, the reimbursement method was different, and the costs were related to stone complexity and treatment method. Here, the cost of PCNL, FURS, and URS was 3173 €, 2514 €, and 1918 €, respectively, which were more expensive in complex cases. 20 Patterson et al. and Costanti et al. have compared the cost of SWL and endoluminal stone operation, finding SWL still cost-effective compared with endoluminal options. 29,30 Alsyouf et al. have broken down the cost of ureteroscopy and stone treatment, including operating room time, staffing, equipment, and supply costs and agreed that operating room time was the most contributory to the overall expenditure. 31
Technological innovations and the need for lighter and readily available ureteroscopes have brought a new generation of disposable flexible digital ureteroscopes. Many of them have similar characteristics and are now readily available on the international market. 32 Since their introduction, the general opinion of endourology experts tends to favor them over their reusable counterparts. 33 The new disposable devices are currently burdened by higher prices per scope, although high-volume hospitals can still find their routine usage cost neutral or beneficial if used in more complex cases to spare the more valuable and expensive reusable digital scopes. 34,35 However, we hear examples of less-developed countries with lower PPP, where the disposable scope is used multiple times to save money. Considerations of balance between cost limitations and patients’ safety need to be performed in such scenarios. However, not enough data are available on the topic.
Limitation of the study
This study relies on single physicians to provide data for their countries, which can have a wide variation at times within each country. We, therefore, had to record and analyze the reported costings, acknowledging that these variations might have been overlooked. Despite the best efforts, some countries’ legislations did not allow physicians to access data relative to the cost of health care. Therefore, future studies should involve health care providers to be able to access more information. Some countries, such as Colombia, Argentina, the United States, and India, have insurance-based and private health care systems. Therefore, the collected costs are reflective of those and not the public services. Moreover, costs in some specific public health care providers, such as Canada, can vary between regions, districts, or for different physicians, so we considered only the information relative to the area of jurisdiction of a single opinion leader. In addition, the data may not reflect the final out-of-pocket cost to the patient, with the role of personal and universal health care insurance, government subsidies, and health saving plan payouts not accounted for. This also reflects the differences in reimbursement models across different health care systems. Despite the limitations, we have provided one of the first worldwide cost comparisons for imaging and treatment of KSD. This can be useful in health care studies and potentially help others learn from some of the cost-adjusted low-cost countries on how they manage their resources, hopefully bringing down the cost of treatment and increasing the affordability for the patients. The comparison between single-use and multiuse ureteroscopes helps the comprehension about the real costs of the endourological landscape. Indeed, they vary significantly depending on the geographic location. For example, in France, the Storz FlexX2 ureteroscope costs GBP 17,000; in Germany, it costs GBP 13,200, whereas, in Turkey, it costs GBP 2950. The cost of ureteroscopic procedures is also determined by decontamination, transportation, storage, and repair expenses, which fluctuate based on the number of procedures performed. 36
This article looks at the cost of imaging. With the new EAU guidelines on follow-up of patients with KSD, a balance would probably be needed on the cost of this vs the physical and emotional burden of living with KSD or its recurrence. 1 Adhering to the follow-up guidelines may not always be possible because of this additional cost of imaging and metabolic assessments at several time points, leading to at least 3–6 additional scans or clinical visits. Perhaps, in the future, we might need to stratify the EAU urolithiasis guidelines based on clinical and economic considerations both.
Although KSD is multifactorial, key risk factors seem to be dehydration and metabolic syndrome (MetS). 37 –39 The latter is a combination of diabetes mellitus, hypertension, and obesity. With a global pandemic of MetS, countries need to take measures to encourage healthy lifestyles and curb obesity and diabetes with better patient education. 40 Similarly, the use of fluid trackers and apps can help with better and targeted fluid intake. Patient education, guidance, and support resources could be adopted globally to decrease the incidence of KSD. 41
Conclusions and Clinical Implications
This study highlights the significant economic impact of kidney stone management on health care systems worldwide. Significant disparities between costs seem to exist worldwide, and this study shows the social and economic inequalities in health care. These results can aid policymakers in addressing these disparities and perhaps learning from other health care providers.
Footnotes
Acknowledgments
Authors’ Contributions
A.P., E.X.K., T.E.S., B.M.Z.H., A.T., E.V., and P.J.-J.: Review and editing (equal). A.P., E.X.K., and B.K.S.: Conceptualization (lead), writing—original draft (lead), formal analysis (lead), and writing—review and editing (equal). A.P., E.X.K., T.E.S., B.M.Z.H., A.T., E.V., P.J.-J., C.B., I.M., L.T., V.D.C., F.P., M.C., E.B.-N., A.S.d.R., L.D., N.G., A.S., A.T., K.R.G., C.K., A.D., F.P., H.K., J.C., M.C., Y.B., J.-L.K., T.T., C.S., P.N.C., S.B.H., N.B., A.C.B.-H., and O.D.O.: Acquisition of data and data curation. A.P. and E.X.K.: Software (lead) and writing—review and editing (equal). A.P., E.X.K., and B.K.S.: Methodology (lead) and writing—review and editing (equal). A.P.: Conceptualization (supporting), writing—original draft (supporting), and writing—review and editing (equal).
Author Disclosure Statements
The authors certify that none of the authors have any conflicts of interest, any interests, funding, or employment that may inappropriately influence or affect the integrity of the publication of this article.
Funding Information
No funding or other financial support was received for this article.