
Abstract
Introduction:
Prostate volume estimation is of great importance for patient evaluation in a urologist’s clinical practice. The accuracy and superiority of the techniques used in volume calculation have always been the subject of debate. Therefore, we conducted a comparative analysis between the volumes derived from transrectal ultrasonography (TRUS), multiparametric prostate magnetic resonance imaging (MpMRI), and three-dimensional (3D)-constructed MpMRI images of patients, who underwent retropubic radical prostatectomy at our institution.
Methods:
The data of patients with preoperative TRUS and MpMRI who underwent radical prostatectomy (Rp) in our clinic between August 2021 and February 2023 were retrospectively reviewed. The prostatectomy specimens were taken to the pathology department without exposure to any fixative and measured with the water displacement method. All axial T2-weighted sequences were segmented by a single surgeon using 3D Slicer (v. 5.6.2) software, and all measurements were compared with the specimen volume measured at the pathology laboratory.
Results:
A total of 150 patients were included in this study. The median prostate volumes estimated by TRUS-ellipsoid, TRUS-bullet, MpMRI, and 3D segmentation were 43.45 cc (min.–max.: 15.1–122.6), 54.32 cc (min.–max.: 18.9–153.3), 44.05 cc (min.–max.: 15.4–128.9), and 43.11 cc (min.–max.: 14.3–110.6), respectively. The median Rp specimen volume measurement in the pathology department was 42 cc (min.–max.: 12–114). When the measurement techniques were compared between each other, it has been shown that the statistically significant difference was caused by TRUS-bullet measurement. No statistically significant difference between the other three measurement techniques as well as between them and the specimen volume measurements were detected.
Conclusion:
Consistent with the findings of previous studies, MpMRI has provided estimations closer to pathology measurements and 3D segmentation allows even more precise measurements. However, considering accessibility, reproducibility, time efficiency, and cost, TRUS-based measurements can be safely used in clinical practice, especially using the ellipsoid formula.
Introduction
The assessment of prostate gland volume (PV) is an essential element in a urologist’s day-to-day clinic practice, which plays a pivotal role in elucidating the patient’s symptoms during the diagnostic process and aiding in the organization of appropriate medical treatment options. 1 PV guides the clinician in many scenarios, such as the use of some nomograms, prostate-specific antigen density (PSAD) calculation, prostate cancer (PCa) risk assessment, appropriate surgical planning, and prediction of postoperative incontinence status. 2 –7
Although its effectiveness is limited, PV estimation is initially carried out with digital rectal examination (DRE). In general, transrectal ultrasonography (TRUS) is the preferred method for estimating PV; however, low intra-operator reproducibility, underestimated tendency, low inter-operator agreement, and particularly patient reluctance and anxiety to utilize TRUS because of discomfort severely limit its use. 8 –10 In the era of focal therapies, active surveillance, and fusion biopsies, multiparametric prostate magnetic resonance imaging (MpMRI) has become a reliable imaging tool that is being used widely. Though the differences between TRUS-PV and MpMRI-PV have been evaluated in a number of studies, 10 –13 it is still unclear which approach is best for estimating PV and how to apply PSAD afterward. Furthermore, the preceding studies’ small sample sizes and controversial results on the use of bullet and ellipsoid formulae severely constrained the ability to extrapolate results and establish a standard.
Therefore, we conducted a comparative analysis between the volumes derived from TRUS, MpMRI, and three-dimensional (3D) constructed MpMRI images of our large patient cohort, who underwent retropubic radical prostatectomy (Rp) at our institution. Our primary goal is to determine the most appropriate measurement tool and volume estimation formula in terms of applicability and reproducibility, as well as to contribute to the literature with our large patient population to establish a standard in this regard by emphasizing the importance of accurate PV measurement.
Patients and Methods
Study population
In this study, the data of patients with preoperative TRUS and MpMRI who underwent Rp in our clinic between August 2021 and February 2023 were retrospectively reviewed. Patients who had previously undergone prostate operation, androgen deprivation therapy, or pelvic radiotherapy for any reason were excluded. Patient demographics, laboratory data, and pathology results of the patients were obtained from the hospital archive and subjected to analysis.
Informed consent was obtained from all patients who agreed to participate in the study. The study received approval from Istanbul University—Cerrahpaşa, Cerrahpaşa Faculty of Medicine, Clinical Research Ethics Committee (E-83045809-604.01.01-744514).
TRUS assessment
All patients participating in the study were evaluated by a urology fellow with 10 years of experience and a 4th-year urology resident the evening before operation. After the DRE, TRUS was performed in the lateral decubitus position with a full bladder (Acuson X150 Ultrasound system, Siemens Healthineers, Erlangen, Germany). Triaxial prostate measurements were conducted as described by Matthews et al. 14 At the point of maximal diameter perpendicular to the gland’s anteroposterior (AP) plane, the transverse (Tr) diameter was measured. Similarly, at the point perpendicular to the largest Tr diameter, the AP diameter was measured in the Tr plane. From the midsagittal plane, which encompasses the urethra, the longitudinal diameter of the gland was measured as the distance between the prostatic apex at the genitourinary diaphragm and the junction of the bladder neck and the prostate. The PV was calculated separately using the prolate ellipsoid formula (height × width × length × π/6) and bullet formula (height × width × length × 5π/24). Representative images of the prostate diameter measurement on TRUS are shown in Figure 1.

Triaxial measurements of the prostate with TRUS.
MpMRI volume estimation and 3D-segmented MpMRI
Preoperative 3.0 Tesla MpMRI (Magnetom Trio, Siemens Healthineers, Erlangen, Germany) images of the patients were obtained from the hospital archive and scanned retrospectively. According to the Prostate Imaging–Reporting and Data System (PI-RADS v2.1), the maximum Tr (width) diameter was measured on axial T2-weighted images and the maximum longitudinal (length) and AP (height) diameter were measured on mid-sagittal T2-weighted images. 15 Figure 2 depicts representative images of prostate diameter measurements on MpMRI.
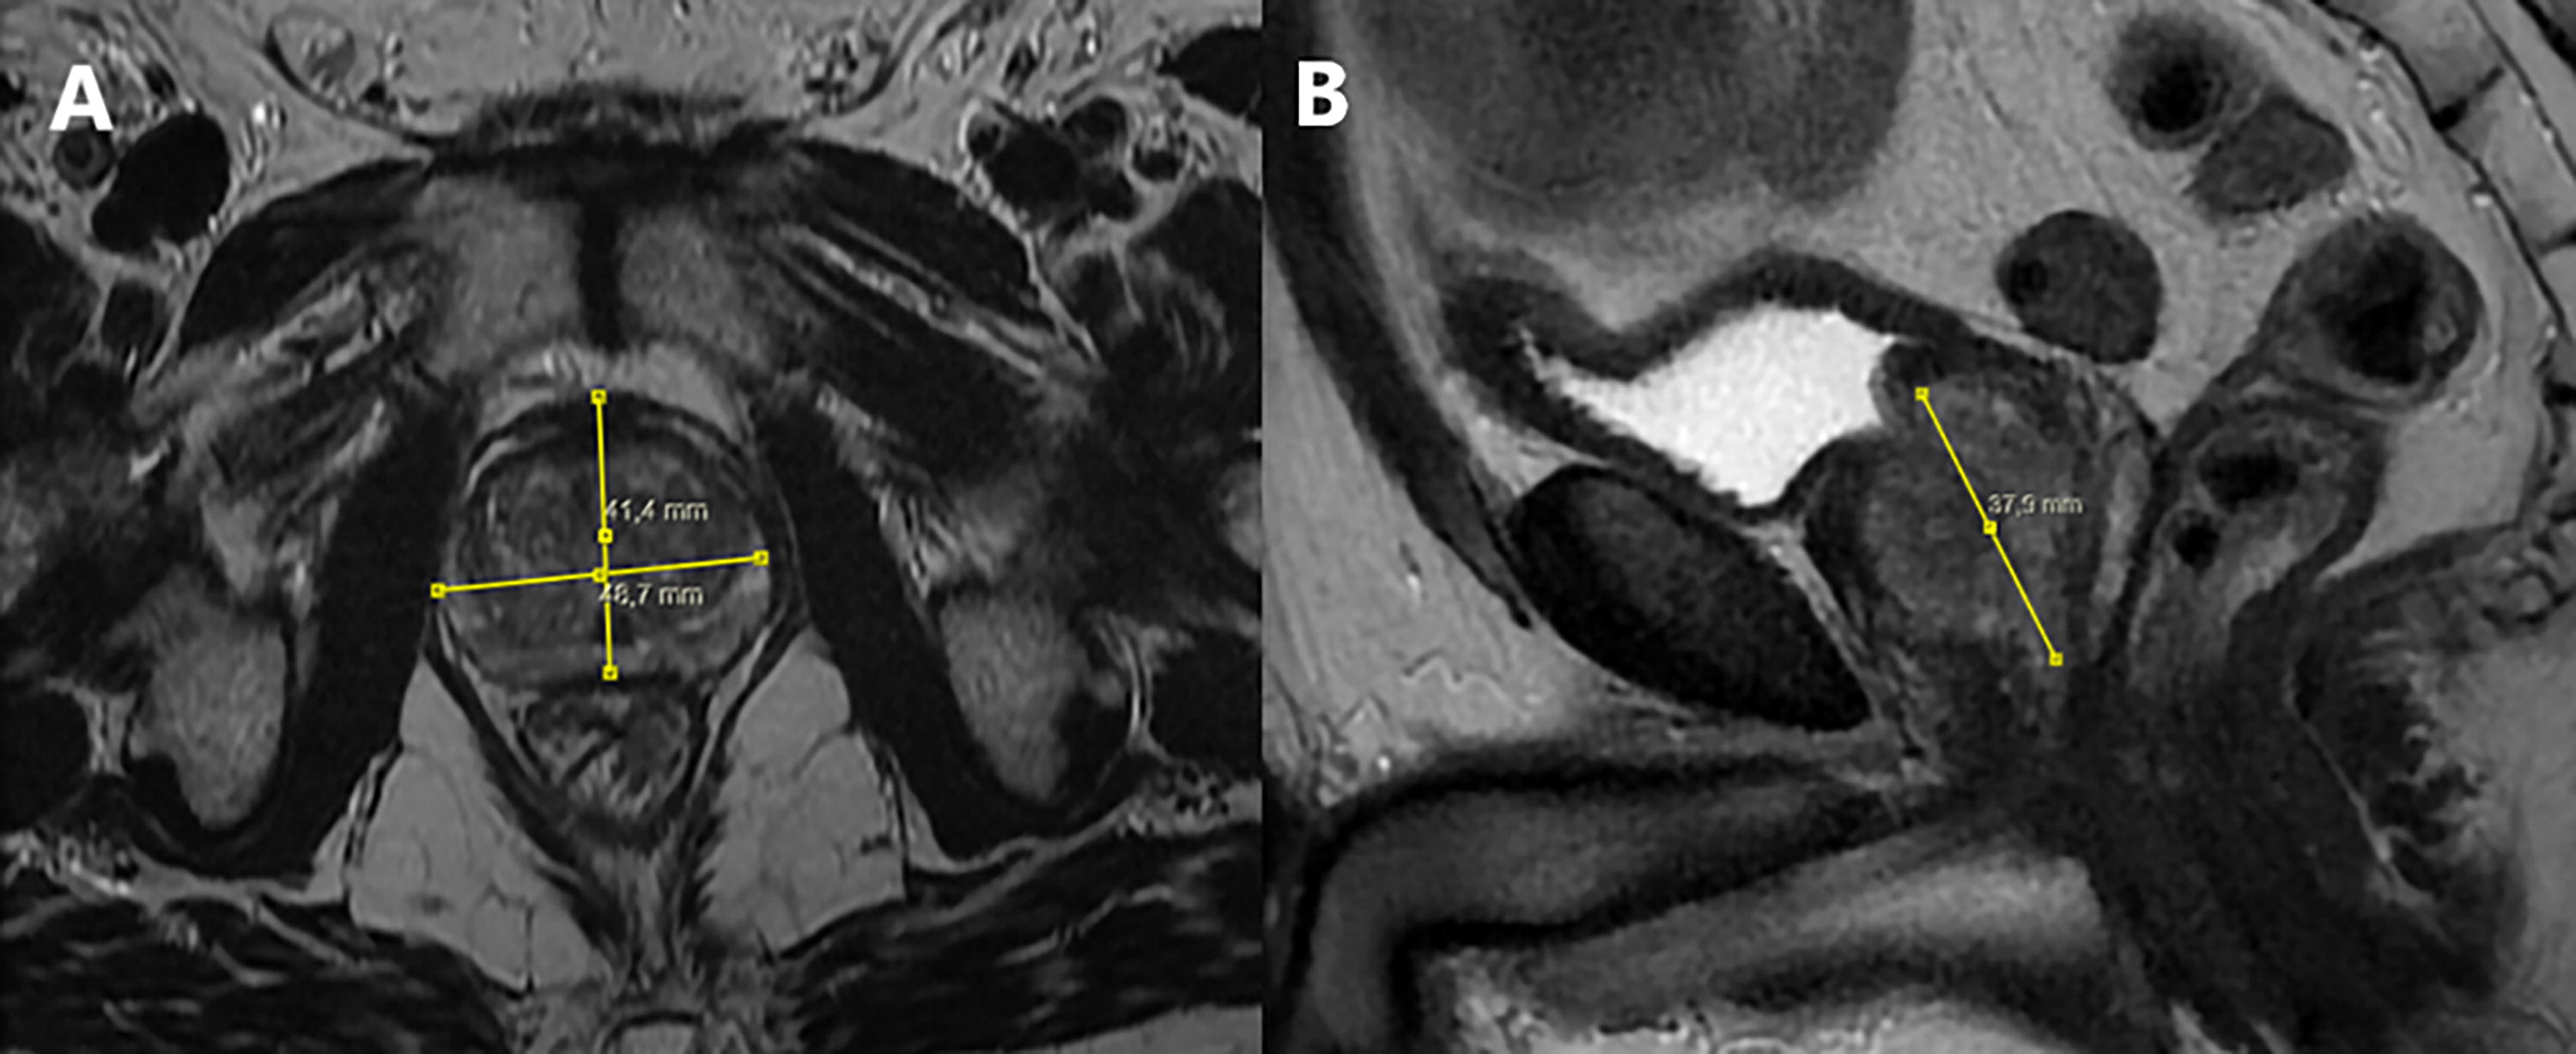
Triaxial measurements of the prostate with MpMRI.
T2-weighted images, which are superior to other sequences in distinguishing the prostate from surrounding tissues, were used for segmentation. All axial T2-weighted sequences were segmented by a single surgeon using 3D Slicer (v. 5.6.2) software. The segment volume computed by software was recorded. Figure 3 shows a 3D segmentation of the prostate from t2-axial images.
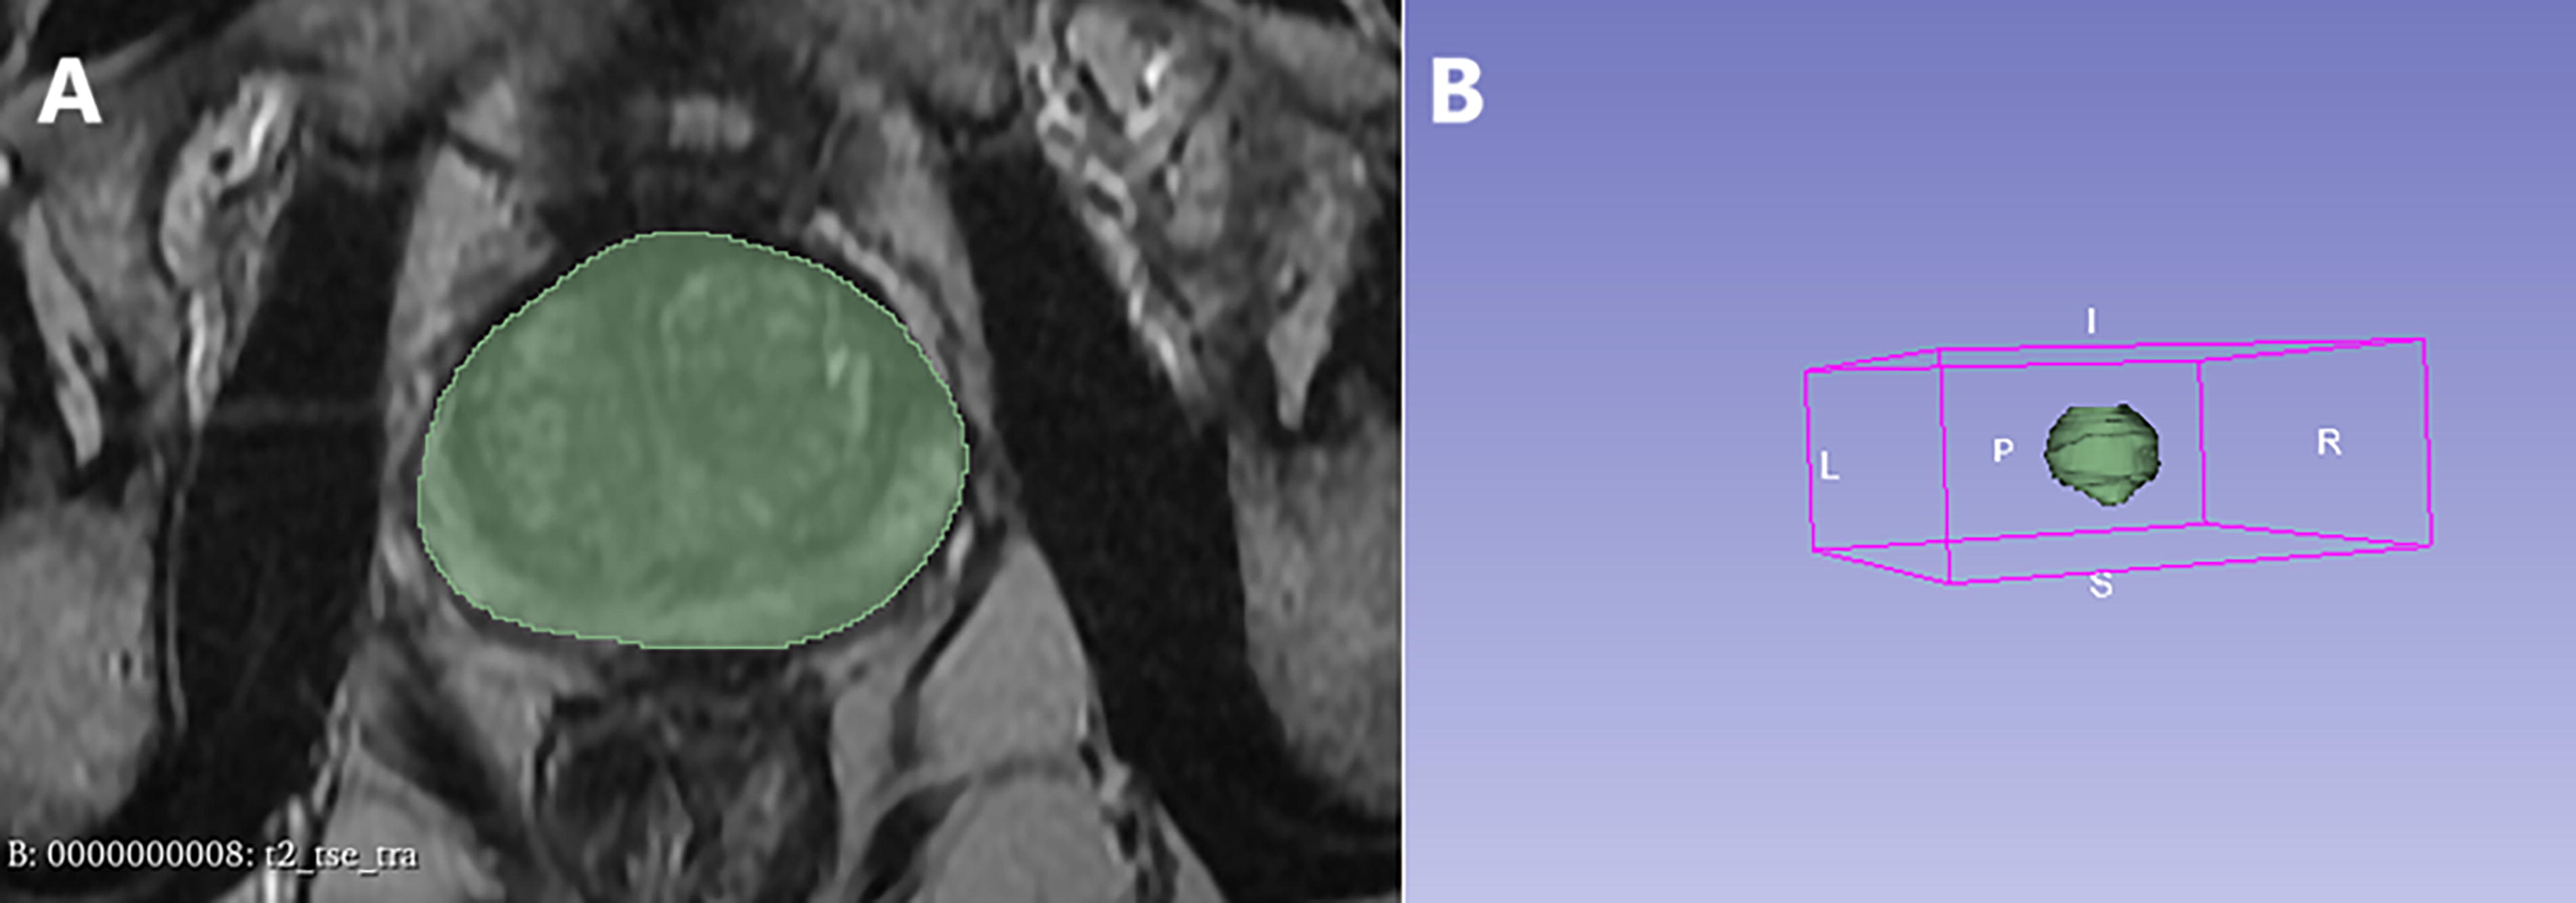
3D segmentation of the prostate with 3D Slicer.
Specimen volume measurement
The Rp specimens were taken to the pathology laboratory immediately after surgical removal. The dimensions of the prostate, seminal vesicles, and ejaculatory ducts were measured with a ruler. The seminal vesicles and ejaculatory ducts were cut and separated from their entrance to the prostate. Then, PV is measured with water displacement method according to Archimedes’ principle using a graduated cylinder filled with distilled water. To preserve the fresh status of the specimen, the measurements were done rapidly before formalin fixation, a process known to affect the prostate size and volume. After these procedures were completed, a large amount of formalin was injected into the prostate using a syringe for fixation.
Statistical analysis
The evaluation and analysis of the data were performed using the Statistical Package for the Social Sciences (IBM SPSS, Armonk, NY: IBM Corp.) version 25.0 software package. Descriptive data were expressed as frequencies (n) and percentages (%) for categorical variables, whereas mean ± standard deviation and median (minimum–maximum) values were used for numerical variables. The assumption of normality was tested using the Kolmogorov–Smirnov test. The Friedman test was employed to compare non-normally distributed continuous or discrete variables between the dependent groups. The measurement techniques were also subjected to pairwise comparisons. A Spearman’s rank-order correlation was run to determine the relationship between the measurement methods. To assess the significance of the difference between two correlations, the following formula was used;
Results
A total of 150 patients were included in this study. Patient characteristics are summarized in Table 1. The median age was 67 (46–82) years, and total prostate-specific antigen (PSA) level was 7.5 (3.84–35.7) ng/mL. The parameters of the volume measurements of the patients are also summarized in Table 2. The median PVs estimated by TRUS-ellipsoid, TRUS-bullet, MpMRI, and 3D segmentation were 43.45 cc (min.–max.: 15.1–122.6), 54.32 cc(min.–max.: 18.9–153.3), 44.05 cc (min.–max.: 15.4–128.9), and 43.11 cc (min.–max.: 14.3–110.6), respectively. The median Rp specimen volume measurement in the pathology department was 42 cc (min.–max.: 12–114). When the difference between the measurement techniques was evaluated with Friedman’s test, a statistically significant difference was observed in all groups (p < 0.001). When the measurement techniques were compared between each other, it has been shown that the statistically significant difference was due to TRUS-bullet measurement (Table 3). There was no statistically significant difference between the other three measurement techniques as well as between them and the specimen volume measurements.
Patient Characteristics
Numerical data are given as median (min.–max.) or number (%) where appropriate.
ASA = American Society of Anesthesiologists; BMI = body mass index; ISUP = The International Society of Urological Pathology; PSA = prostate specific antigen.
Prostate Volume Measurement Values with Different Techniques
Numerical data are given as median (min.–max.) or number (%) where appropriate.
MpMRI = multiparametric magnetic resonance imaging; TRUS = transrectal ultrasonography; Rp = radical prostatectomy.
Pairwise Comparisons of the Volume Measurement Techniques
p-Values have been adjusted by Bonferroni correction test.
When Spearman’s correlation test was performed to define the correlation of the measurement techniques with the specimen volume measurement, the strongest correlation was found in 3D segmentation (r = 0.981). The correlation coefficients for TRUS-ellipsoid, TRUS-bullet, and MpMRI were 0.976, 0.976, and 0.968, respectively. When the difference in correlation coefficients was evaluated internally, a statistically significant difference was observed (p < 0.001). The Bland–Altman plots depicting the relationship between the difference and means of measurement techniques and specimen volume measurements are shown in Figure 4.
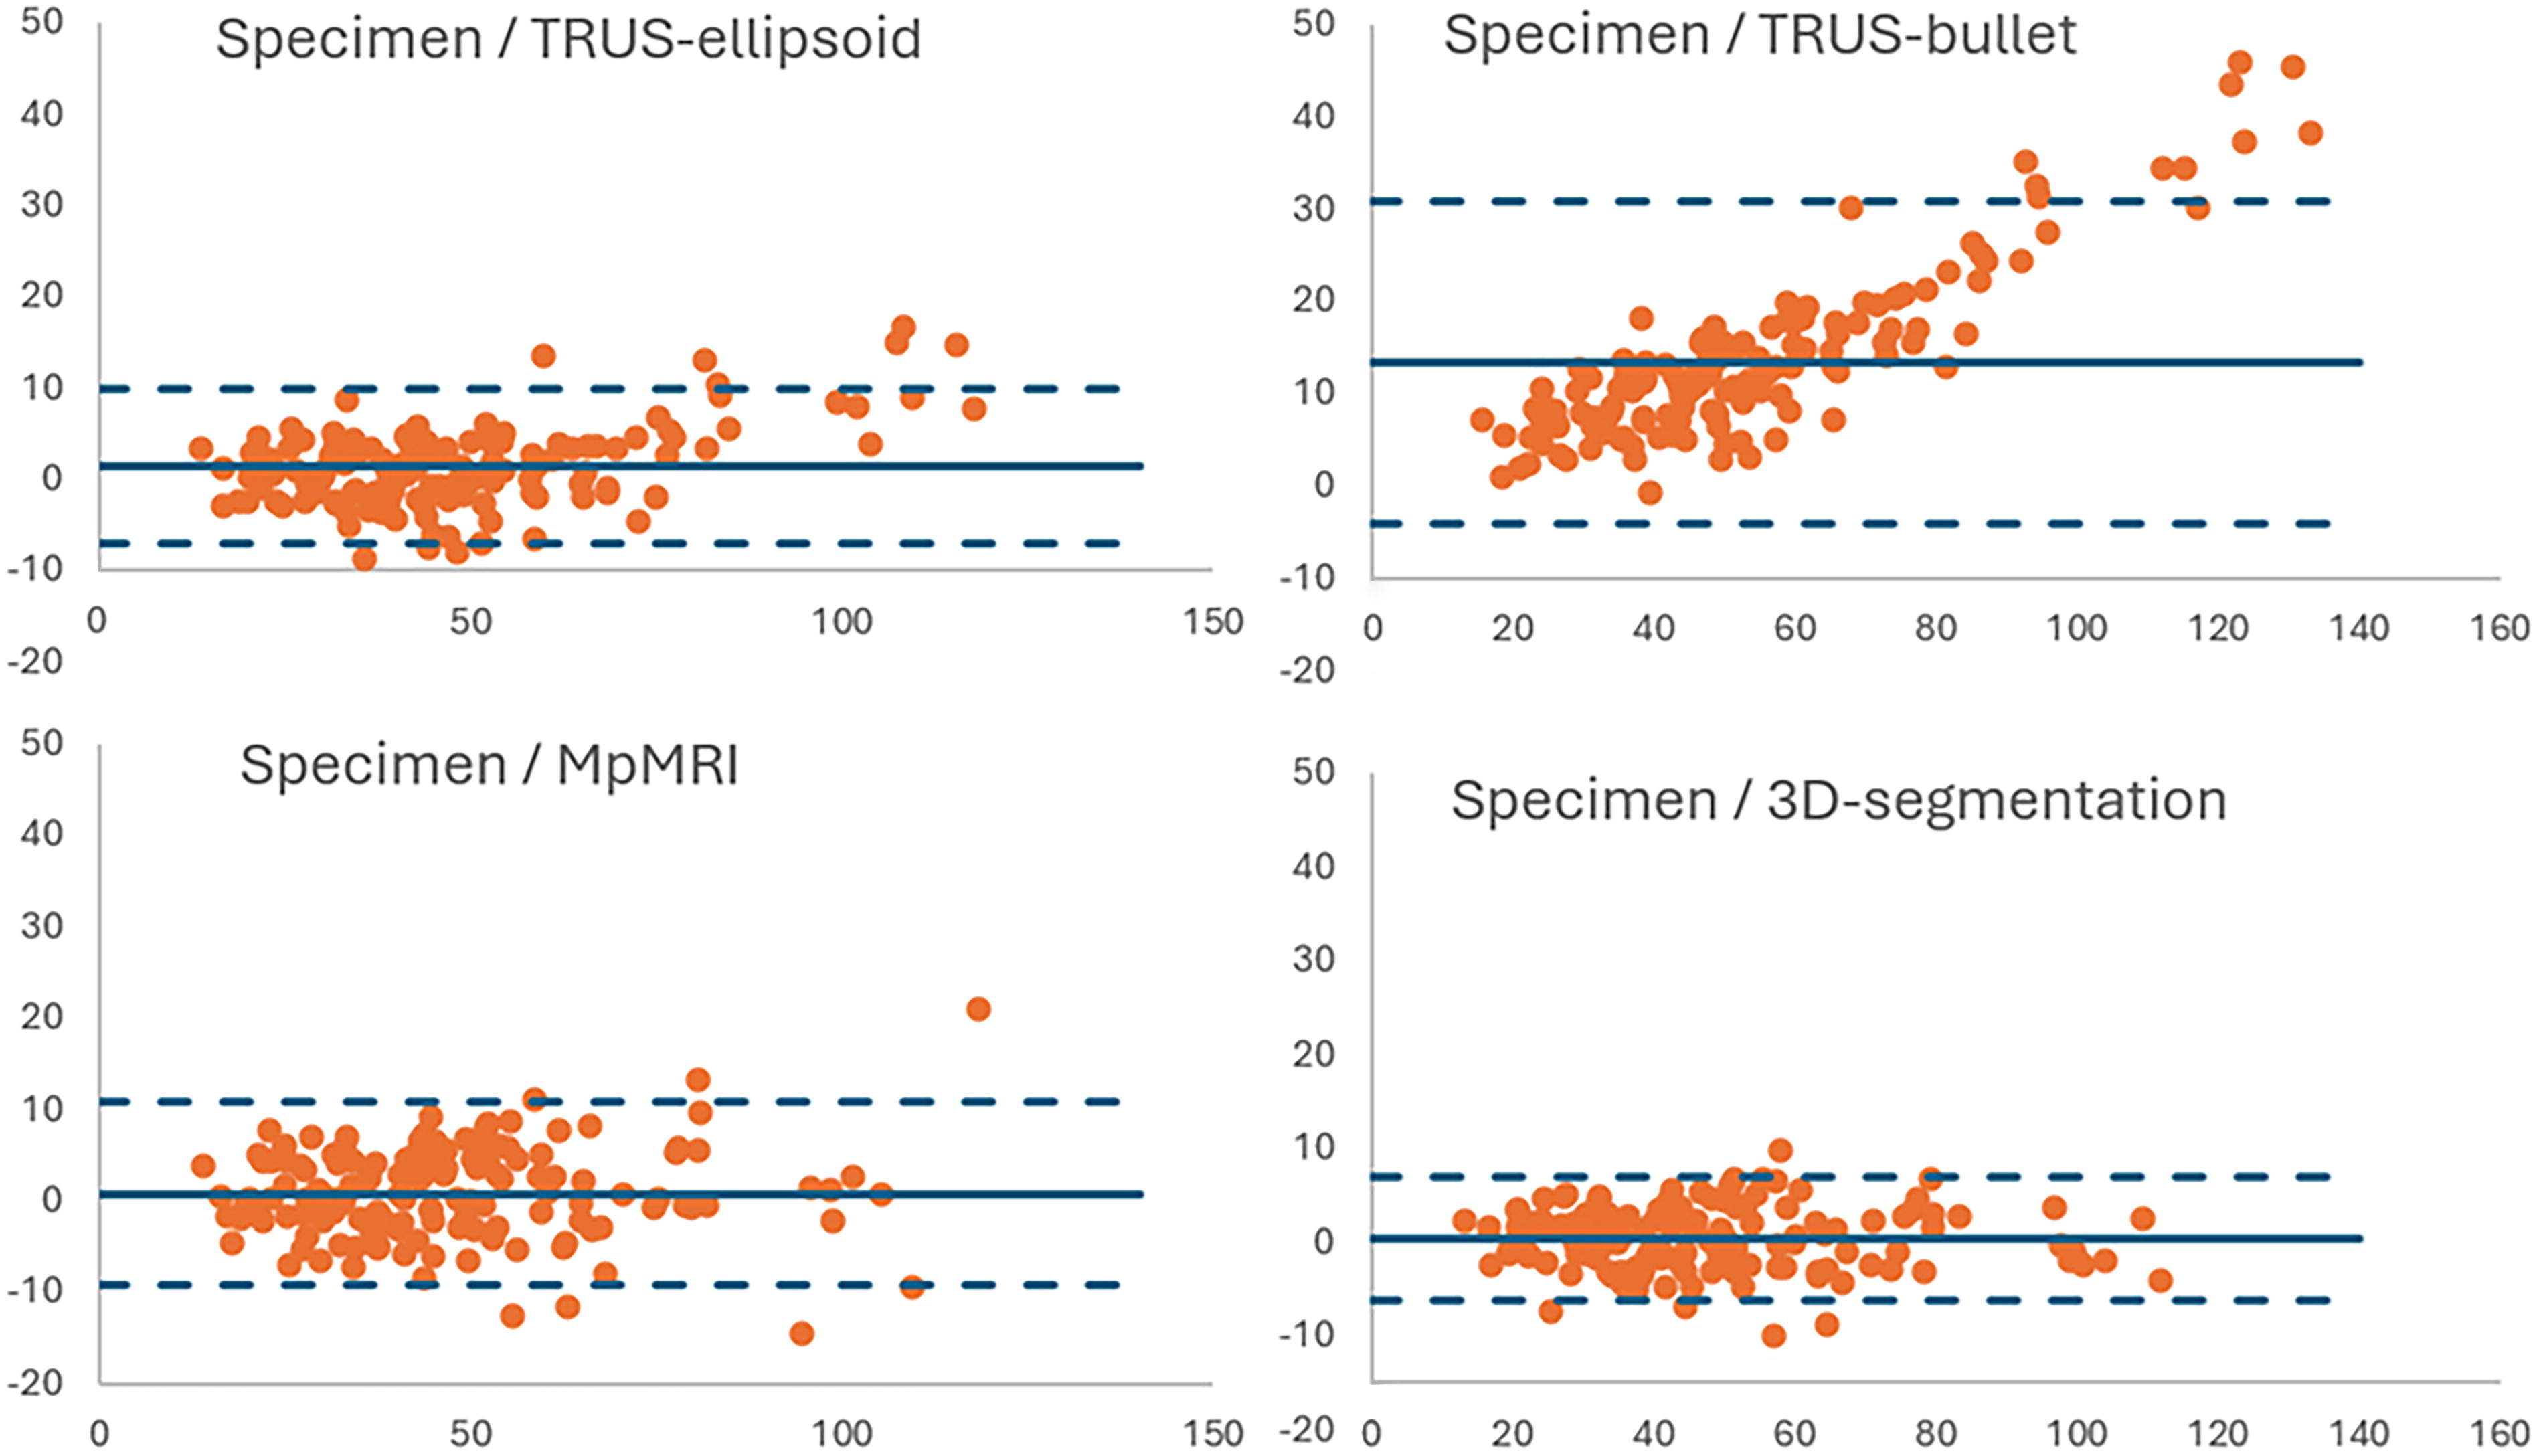
Bland–Altman plots show comparisons between the volume measurement techniques and specimen volumes.
Discussion
PV has proven to be an effective tool for determining the extent of symptoms, forecasting surgical complications, and choosing the best course of therapy (medication or operation) for patients with benign prostatic hyperplasia. 1 PV has been shown to be also useful in PCa screening and risk stratification, particularly if paired with PSA by PSAD calculation. 5 Considering the previous studies’ small sample sizes and controversial outcomes, we present the results of one of the largest series in literature comparing the accuracy of different techniques on accurate PV measurement.
Comparing the results to the actual volume—which was the same as measuring the volume of the prostate specimen after Rp—was the most effective method of evaluating the precision of different volume measures. Therefore, we adopted the specimen volume measurement from the pathology department as the gold standard in our study. In some previous studies, formalin-fixed tissues were used for measurements, but this procedure would lead to dehydration of the tissue and thus underestimation of the actual in vivo volume. 16,17 In our study, we transferred the specimen to the pathology department without exposing it to any fixative in order to measure the gland volume as closely as possible. There, the PV was measured after careful separation of seminal vesicles, ejaculatory ducts and periprostatic tissue, thus lowering the possibility of either overestimating or underestimating the actual gland volume.
TRUS has been the most widely used method for PV measurement for many years. Many studies have investigated the reliability of TRUS measurement and the accuracy of the formula to be used in the volume estimation and have reached different and controversial conclusions. 10 –13,18 –22 Aprikian et al. analyzed data from 153 patients and aimed to determine an optimal coefficient based on freshly resected prostates as a reference for estimating volumes by imaging. 18 In their study, they showed that the ellipsoid formula underestimated PV by 18% and the bullet formula overestimated it by 4.6%. They also recommended the use of a coefficient of 0.66 in the formulation for an accurate volume measurement. In their study of 148 patients, Haas et al. showed that TRUS-ellipsoid volume estimation correlated well with segmented volume, MpMRI volume and Rp specimen volume. 19 Our results showed that the bullet formula overestimated the actual gland volume, whereas the ellipsoid formula was strongly correlated with MpMRI, 3D-segmented, and actual gland volume.
Due to its invasive nature, TRUS can cause anxiety in patients and may even be rejected by some. Although the prostate can be visualized better transrectally, PV can also be calculated with transabdominal ultrasonography (TAUS). In the recent study by Guo et al. TAUS and MRI data of 106 patients were compared, which revealed a high degree of correlation and agreement between the specimen volume and PV measured with TAUS and MRI. 20 However, in glands larger than 50 mL, MRI still showed high correlation whereas TAUS showed moderate correlation. TAUS may be considered a good alternative in cases where TRUS is not desired or cannot be performed (e.g., anal fissure, anal fistula). Additionally, TAUS can be performed more rapidly compared with MRI and TRUS, even in outpatient settings. However, it should be kept in mind that there may be measurement errors and inaccuracies in the presence of a median lobe and in large prostates. To improve measurement accuracy, care should also be taken to ensure that the bladder is full at the time of measurement.
Another radiologic imaging technique that can be used by clinicians for PV assessment is computed tomography (CT). In a study by Kälkner et al., data from 31 patients with localized prostate cancer who were planned to be treated with combined external conformal radiotherapy and high-dose-rate brachytherapy revealed that CT-based PV estimates were 30% greater than TRUS-based assessments. They attributed this to the difficulty of accurately identifying the prostate’s apical region on CT. 23 Another well-known drawback of CT is its inability to distinguish between the transitional and peripheral zones as precisely as MRI and TRUS. In a recent study by Forbes et al. that analyzed preoperative PV measurement, transitional zone volume measurement, and enucleation weight data of 114 patients who underwent enucleation for benign prostatic hyperplasia, it was observed that CT was less accurate than MRI in transitional zone volume calculation and enucleation weight prediction. 24 Considering all of these factors as well as radiation exposure, CT should not be recommended for PV evaluation. However, CT can be used to estimate PV if it is sought for hematuria, calculi, staging, or for any other clinical reason.
Triaxial standardization has been achieved in PI-RADS v2.1 for PV measurement with MpMRI. 15 Similar definitions have been made for ultrasonography in previous studies. Jeong et al. compared the volumes calculated by measuring AP diameter from axial and mid-sagittal planes in their study. 21 According to the results of this study, they showed that the volume calculated on the axial plane was superior to the volume calculated on the mid-sagittal plane. In our study, we also measured AP diameter from the axial plane. In the study by Rodriguez et al., in which they compared the triaxial data measured in ultrasonography with the triaxial data from pathology, the length was found to be accurate (4.4 vs. 4.3 cm), while the height was underestimated (3.2 vs. 3.7 cm) and the width was found to be inaccurate (4.8 vs. 5.2 cm), therefore concluding that TRUS underestimates volume. 22 However, the ultrasonography data in the study were provided by many urologists and are not reliable, and they evaluated the correlation between measurements with weight rather than volume. According to the results of our study, TRUS (especially the ellipsoid formula) was found to be reliable in volume estimation and no significant deviation was observed in the triaxial measurement data.
Prior research examined the precision of the PV calculated using the ellipsoid formula using MRI and found a strong correlation. Choe et al. proposed that MRI offered more accurate volume estimates for the ultimate pathological PV than TRUS (correlation coefficient: 0.913 vs 0.878). 11 Despite strong agreement, a significant difference was identified between the paired TRUS-PV and MpMRI-PV. In a study by Martins et al. revealed a correlation coefficient of 0.924 between MRI-evaluated PVs and TRUS. 12 In addition, Paterson et al. demonstrated a high correlation between TRUS-PV and MRI-PV and investigated the relationship between these PVs and the ultimate pathological PV. 13 They proposed that TRUS and MRI were both useful in PV calculation, with MRI showing greater correlation with pathological PV. According to Bezinque et al., there was a high degree of agreement between the PV determined by the ellipsoid formula and MRI-R3D (radiologist-manually segmented), suggesting that MRI using the ellipsoid formula offered a precise PV estimation. 23 Our results are also in line with these findings. Overall, the ellipsoid formula for PV estimation on MRI was a quick method with respectable accuracy and repeatability, and because it had become widely accessible, it could be used in daily clinical settings.
As MRI techniques have become more widely used and improved, their superior contouring of the prostate and more accurate and reproducible PV analysis can be attributed to their higher spatial resolution, better soft-tissue contrast, and more sophisticated computational capabilities. By using the ellipsoid formula or manual or automatic segmentation, PI-RADS v2.1 sought to standardize PV estimation and suggested routine reporting of PV based on MRI. 15 However, this method was neither economical nor time-efficient and manual segmentation should only be carried out by a qualified nonradiologist or an experienced radiologist. 25 For precise PV measurements, many automated segmentation techniques have shown to be time-efficient; however, they need a great deal more economy and generality. 26 It is important to note that radiology, particularly prostate imaging, is increasingly incorporating artificial intelligence. Relevant studies have looked at the viability of using automated segmentation based on deep learning algorithms, and deep learning-based prostate segmentation seems to be better than classical segmentation. 27 However, rather than being used in clinical settings, the usage of these models is for now primarily restricted to scholarly study.
Although our findings will make an important contribution to the current literature, our study is not without limitations. The single-centric retrospective study design is the main limitation of this study. Also, because of the relatively small sample size of this study, our findings must be further confirmed in a well-planned, large-sample prospective study.
Conclusions
Our study unmasked a strong positive correlation between TRUS-PV and MpMRI-PV, which was consistent with the findings of previous studies. MpMRI has provided estimations closer to pathology measurements, and 3D segmentation allows even more precise measurements. However, considering accessibility, reproducibility, time efficiency, and cost, TRUS-based measurements can be safely used in clinical practice.
Footnotes
Authors’ Contributions
The authors confirm contributions to the article as follows: study conception and design: S.C., M.H.G., I.G., and H.O.; data collection: K.C.S., G.K., and I.S.; analysis and interpretation of results: K.C.S., G.K., U.S.; literature review: S.C., K.C.S., and M.H.G.; draft article preparation: S.C., and K.C.S.; supervision: H.O., and I.G.; critical review: I.G., and H.O. All authors reviewed the results and approved the final version of the article.
Author Disclosure Statement
No competing financial interests exist.
Funding Information
No funding was received for this article.