
Abstract
Purpose:
The Wisconsin Stone Quality of Life (WISQOL) questionnaire is a survey-based tool that has been used to show worse health-related quality of life due to stone disease. The minimum clinically important difference threshold for determining whether changes in the WISQOL tool are meaningfully significant has not previously been estimated. Our study aimed to determine this threshold using distribution- and anchor-based methods.
Materials and Methods:
A retrospective single-center cohort of patients at a kidney stone clinic was administered the WISQOL questionnaire at initial and follow-up visits from January 2018 to November 2023. Baseline characteristics and WISQOL standardized scores and subdomain scores were recorded. Distribution-based estimates were calculated at the initial visit and at follow-up. Three anchor questions were used to create a global transition question scale. Cross-sectional, longitudinal within-group, and longitudinal between-group anchor-based estimates were calculated.
Results:
The cohort included 1197 individuals with both an initial clinic visit and a follow-up visit. The distribution-based minimum clinically important difference estimates ranged from 3.5 to 10.8. Cross-sectional anchor-based estimates ranged from 3.1 to 13.6. Within-group anchor-based estimates for improvement ranged from 8.5 to 10.3 and for deterioration ranged from 3.1 to 6.3. Between-group anchor-based estimates for improvement were 9.1 (adjusted confidence interval [CI]: 7.5–10.8) and for deterioration were 4.2 (adjusted CI: 2.3–6.1).
Conclusions:
A conservative threshold for clinical significance in total WISQOL score (standardized to scale of 0–100) is a difference of 9 for both improvement and deterioration. These findings can be used to further implement WISQOL in guiding clinical decision-making.
Introduction
Kidney stone disease is prevalent in 9% of people in the United States, 1 and has been demonstrated to impact patient health-related quality of life (HRQOL) on several levels, causing impairment in physical, emotional, and social function. 2 Improving disease burden can improve HRQOL. Patient-reported outcome measures (PROMs) are used to identify and quantify the effects of patients’ symptoms, which would otherwise be interpreted subjectively. The Wisconsin Stone Quality of Life (WISQOL) questionnaire is a survey-based tool used to quantify kidney stone symptoms and can be administered over time to quantify improvement of symptoms in response to treatment and/or to the natural course of kidney stone disease. 3 Previous studies using WISQOL have demonstrated worse HRQOL due to stone disease in patients who are younger, female, or non-White, or had lower income or unemployed work status. 4,5
Clinical interpretation of PROMs can be challenging. While patient-centered research may demonstrate findings with statistically significant differences, are these differences meaningful at the patient level? How should differences in scores from before and after treatment be considered? How can clinicians know when patients significantly improve or decline with respect to the outcomes patients value most? The minimum clinically important difference (MCID) is a reference point that can be used to provide context for the level of clinical significance. The MCID is not always universal across measurement tools and can differ based on disease-specific subgroups. 6
The MCID can be calculated in several ways such as by distribution-based or anchor-based methods. The distribution-based method determines the MCID by comparing differences in scale-based outcome measures to predetermined cutoffs. This method is subject to variation in sample size and does not consider patients’ input. Anchor-based methods use reference points determined by a patient-derived or clinician-derived threshold for what is considered meaningful. This method is more commonly used but thought to be subject to variation based on the specific patient population under study or choice of clinical markers. While the anchor-based method is considered a stronger approach, both methods provide strengths and weaknesses, and taken together, they can be used to triangulate a more accurate MCID value. 7 The MCID for WISQOL is currently unknown. The goal of this study is to determine the MCID for WISQOL using both anchor-based and distribution-based approaches.
Materials and Methods
Patients and clinical information
This was an institutional review board-approved retrospective cohort study of patients who had a documented initial visit at the kidney stone clinic at an urban academic medical center between January 2018 and November 2023. To be included in the study, they must have had a follow-up visit within that period. The follow-up visit was defined as the first visit after the initial visit. All patients were 18 years or older and had a diagnosis of kidney stone disease. Patients were excluded if a WISQOL score was not completed at either visit. Baseline characteristics were obtained, including age, sex, race, and stone surgery in the past 30 days. The same information was obtained for follow-up visits. Follow-up times were calculated as the mean time between administration of WISQOL questionnaires (i.e., at baseline and at follow-up) for each patient. The study was approved by the local institutional review board.
WISQOL questionnaire
The WISQOL questionnaire is a validated 28-item questionnaire composed of a total HRQOL score and subdomain scores for social functioning, emotional functioning, impact of stone-related symptoms, and vitality. The English version of the WISQOL questionnaire was administered a week before the initial and follow-up clinic visits via the electronic health record patient portal. Mean total WISQOL scores and subdomain scores were obtained for initial visit and follow-up visits. Scores were standardized to a 0–100 scale for total score and also for subdomain scores. Questionnaires with any missing items were not included.
Anchor development
For the anchor method, we utilized three binary questions to generate an anchor. Two questions were derived from the binary WISQOL questions (not included in the total WISQOL score) stemming from the statement, “Within the last 30 days.” The first question we used was “Did you go to the emergency room or urgent care because of kidney stones?” The second question we used was “Did you or do you currently have any pain or symptoms related to kidney stones?” The third question was a binary question determined from patients’ medical records and was whether the patient had undergone stone surgery within 30 days of completing the survey. The number of anchor responses to “no” was tallied, to be used later for stratifying mean WISQOL standardized scores by level of anchor response. A global transition question (GTQ) scale was then generated by calculating the difference in level of anchor response between baseline and follow-up. Positive and negative numbers were deemed to represent clinical improvement and clinical deterioration, respectively. For example, if at baseline, two of a patient’s three answers were “no” and all three answers were “no” at follow-up, then the change in anchor response was “+1.” Anchor development is depicted in Figure 1.
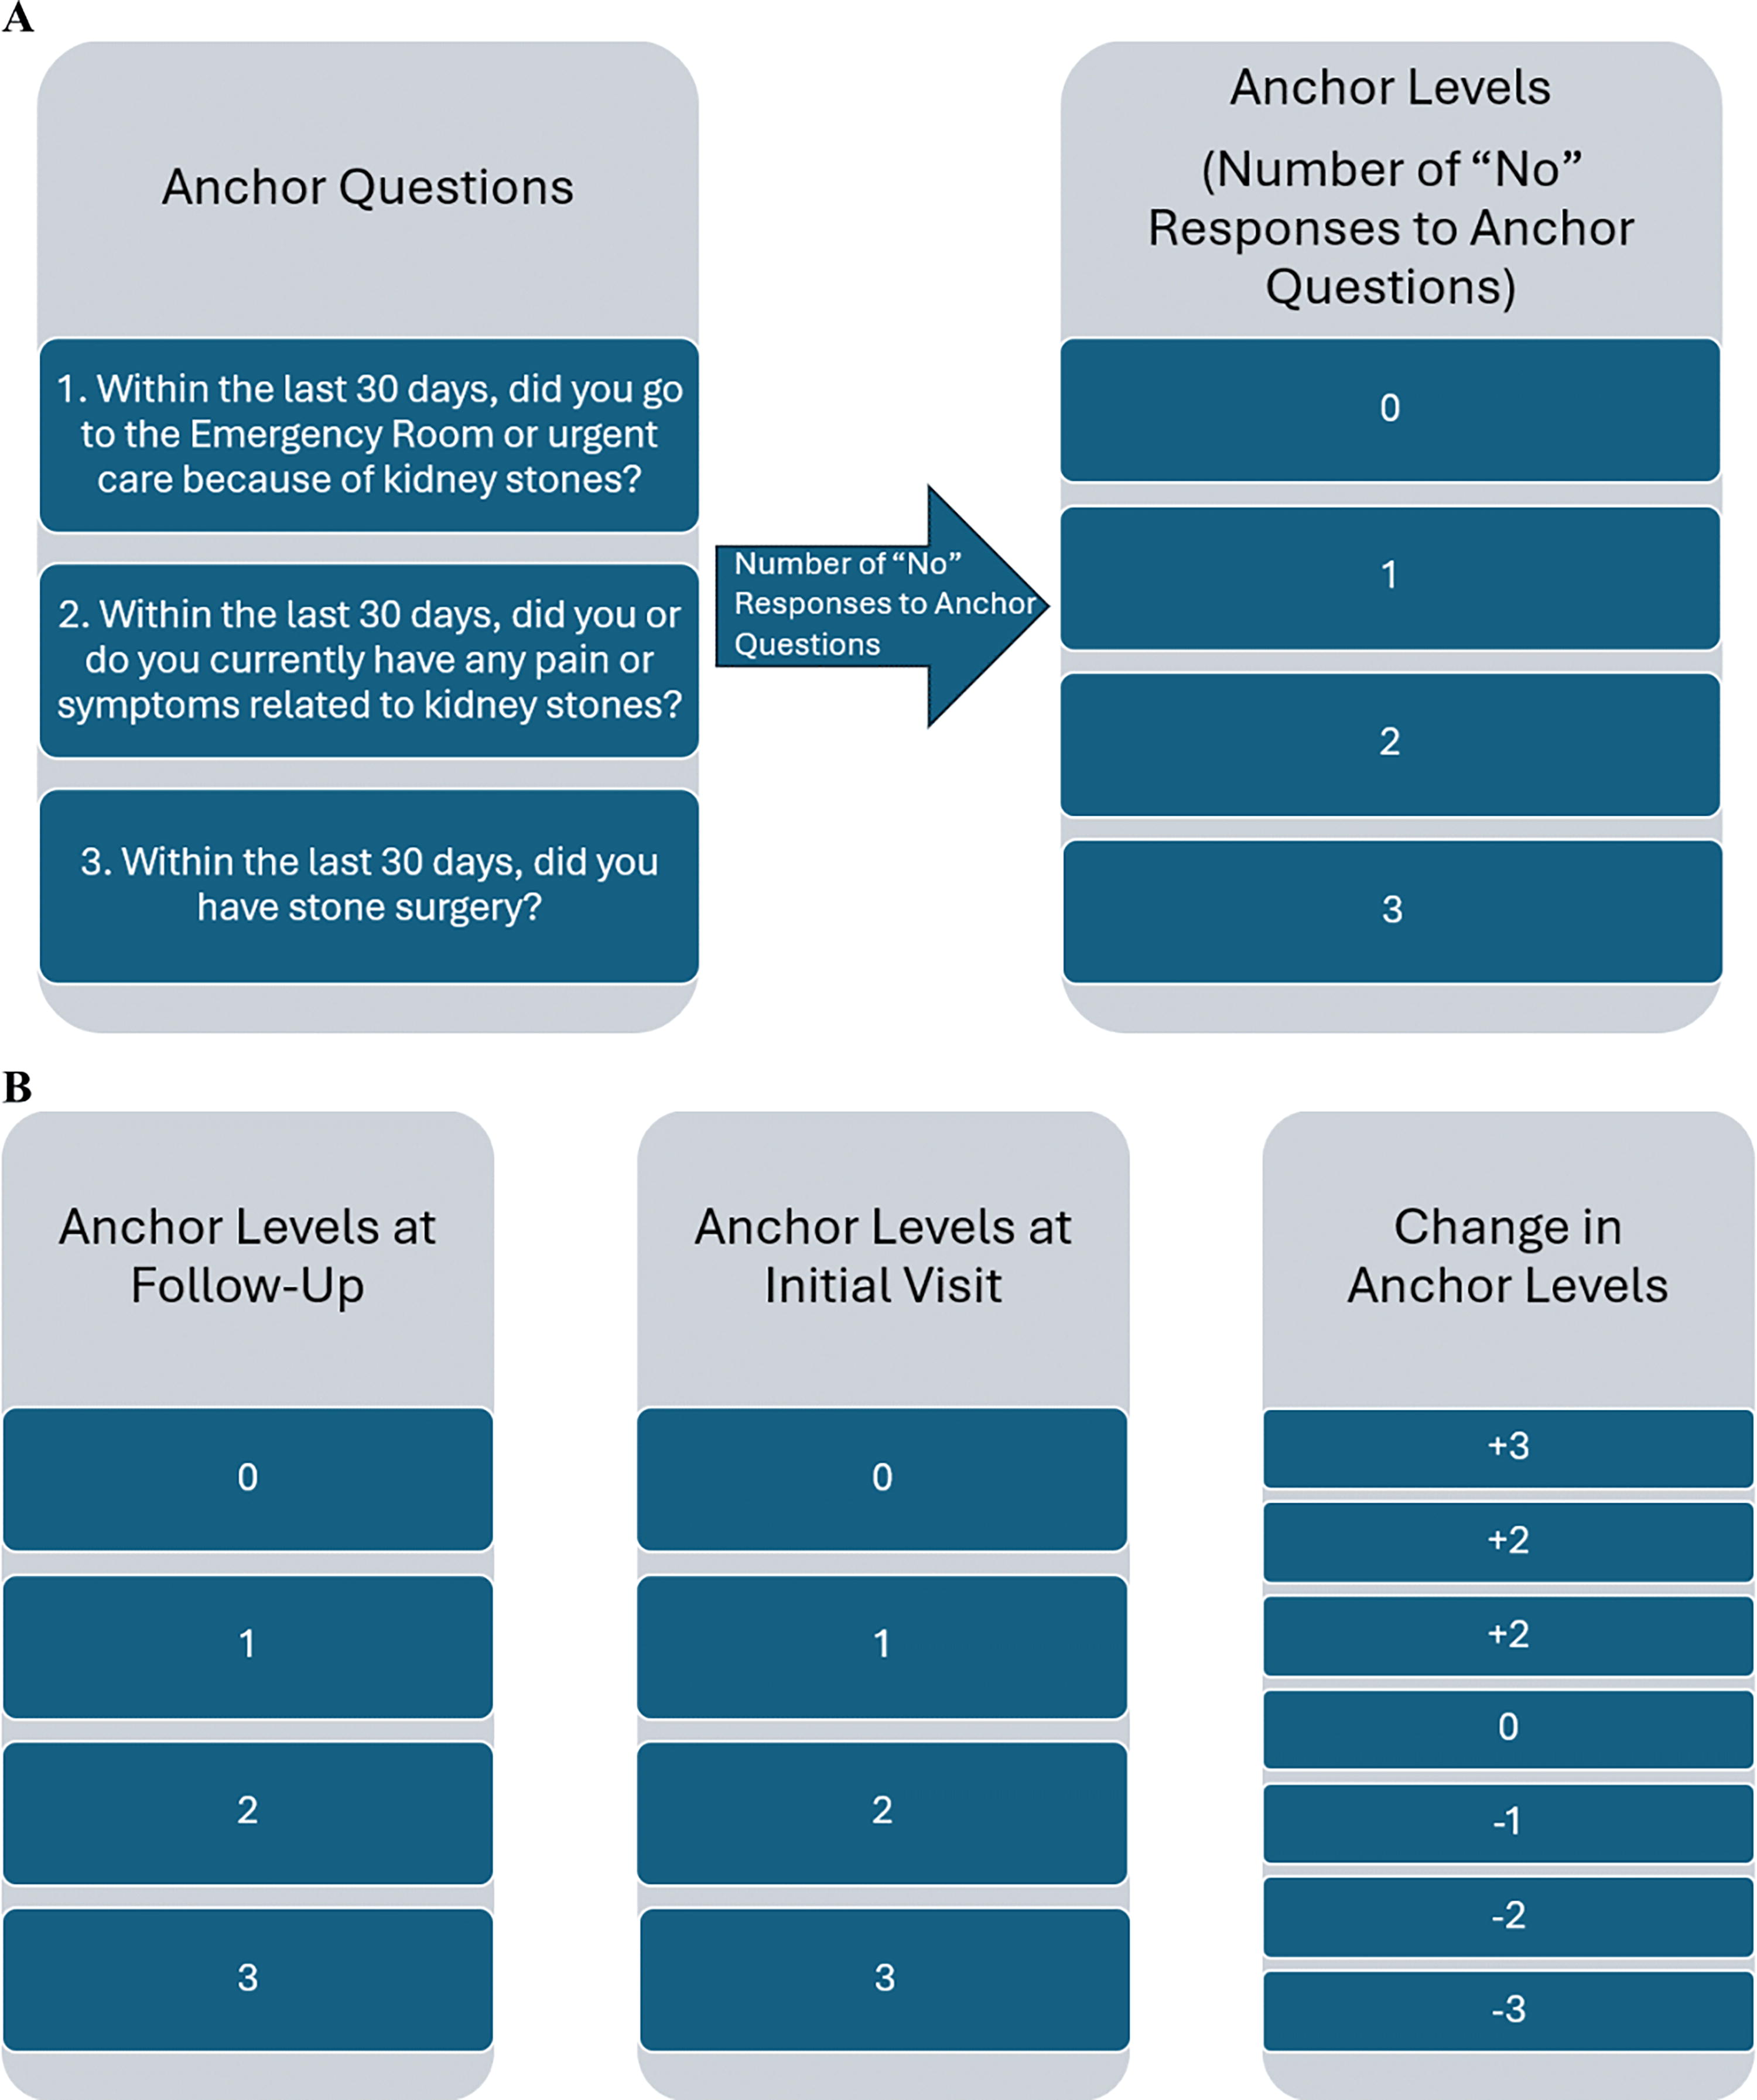
Anchor questions and development of anchor levels and global transition question.
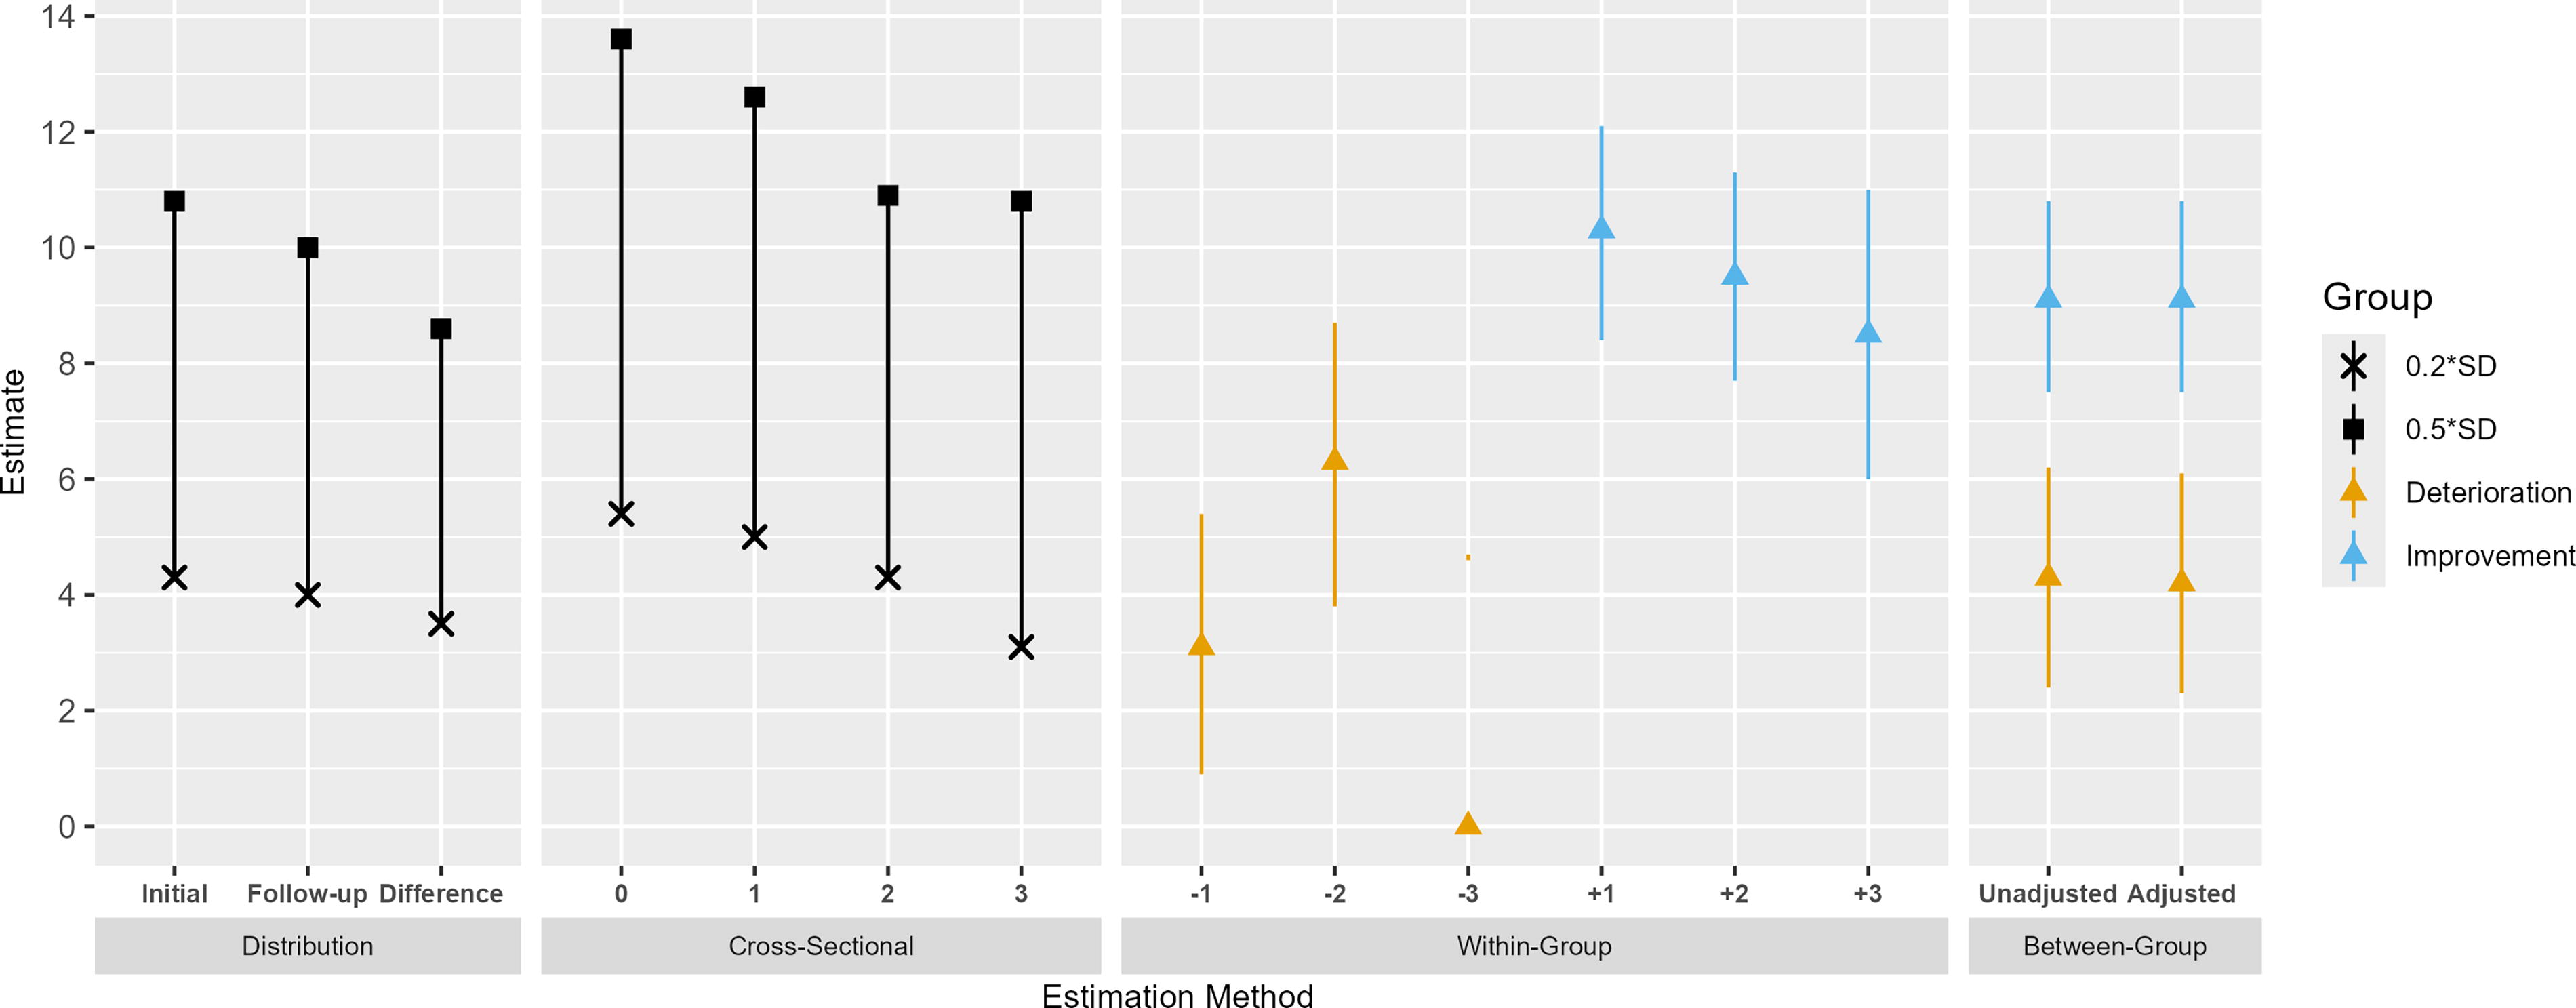
Minimum clinically important difference in Wisconsin Quality of Life score using anchor and distribution methods.
Statistical analysis
Descriptive statistics were calculated for age, sex, race, ethnicity, and follow-up time. Median age and follow-up time were reported with interquartile ranges. MCID estimates were determined using the distribution method and the anchor method. The anchor method was then utilized to calculate three different types of anchor-based estimates: cross-sectional estimates, within-group longitudinal estimates, and between-group longitudinal estimates. This three-level approach is described within the “taxonomy of change” framework by Beaton et al., and represents the three different ways an MCID can be estimated using the anchor method. 8 The MCID estimation methods used in our study are described below. Statistical significance was predetermined at a threshold p-value less than or equal to 0.05. All analyses were performed using R version 4.3.0.
Calculating MCID using the distribution method
We calculated the mean and standard deviation (SD) for WISQOL standardized scores and subdomain scores at initial visit, follow-up visit, and for the difference between initial and follow-up visits. For each SD, the distribution-based MCID estimates were determined using two definitions commonly used in the literature. 9,10 The first definition, 0.5 times the SD, is the most accepted threshold by which a patient can clinically discriminate a difference in PROM and was initially popularized by Norman et al. 11 The second definition, the SD multiplied by 0.2, is the way to calculate the MCID from the “effect size” in statistics, which is commonly considered to be “small” if it is at least equal to 0.2 and no more than 0.5. 12 Taken together, these estimates represent a range of MCID estimates that are large enough to be detectable but small enough to be considered to be of minimal clinical importance.
Anchor assessment
Mean WISQOL standardized scores and SDs for an anchor response of “yes” or “no” for each question were calculated at initial and follow-up visits. Scores were compared between responses of “yes” and “no” using independent-sample t-tests. Each anchor was then assessed for correlation with a change in total WISQOL score by calculating the Pearson correlation between change in anchor response and change in WISQOL score. We empirically considered thresholds of r = 0.3 or higher to be significant. 13 A sensitivity analysis was performed by correlating the change in WISQOL score with different combinations of the three anchor questions.
Calculating MCID using the cross-sectional anchor-based method
This method compares the difference in mean WISQOL standardized scores across levels of the anchor questions. The mean WISQOL standardized scores and SDs were calculated for each level of anchor response, determined by the number of anchor responses of “no,” as described previously. Then, the distribution method definitions of MCID estimates were also applied using 0.5 SD and 0.2 SD. 14
Calculating MCID using the within-group anchor-based method
Using this method, MCID estimates were obtained by taking the mean WISQOL standardized score and subdomain scores for each level of change in improvement (change in GTQ of +1, +2, or +3) and deterioration (change in GTQ of −1, −2, or −3). 9,15 Estimates for changes of ±2 and ±3 were adjusted by dividing the estimate by the magnitude of the change. Confidence intervals (CIs) were generated using the SD at each level.
Calculating MCID using the between-group anchor-based method
Between-group anchor-based estimates were obtained using two linear regression models, one for improvement and one for deterioration. Comparison groups were defined as “change” if the change in anchor response was +1 for the improvement model or −1 for the deterioration model. A categorization of “no change” was given if the change in anchor response was zero. The MCID estimate was defined as the mean difference (MD) between the “change” and “no change” groups for each model. 9,15 Unadjusted and adjusted models were utilized, with adjusted models controlling for age, sex, and race.
Results
A total of 1197 individuals with both an initial clinic visit with WISQOL score and a follow-up visit with WISQOL score were included in the study. Subjects were primarily White (95.8%) and male (51%) with a median age of 62 years. Median follow-up time was 3.9 months (Table 1). The mean total WISQOL score was 78.4 at initial visit and 81.6 at a follow-up visit. The mean change in WISQOL score from initial visit to follow-up was 3.1 (Table 2).
Wisconsin Stone Quality of Life Survey Characteristics
IQR = interquartile range.
Distribution-Based Minimum Clinically Important Difference Estimates for Wisconsin Stone Quality of Life at Initial and Follow-Up Visits
SD = standard deviation; WISQOL = Wisconsin Stone Quality of Life.
Distribution-based MCID estimates are reported in Table 2 as the fractional SDs (0.2 and 0.5) for the initial and follow-up visits. These estimates for MCID of the total WISQOL score ranged from 3.5 to 4.3, for a definition of 0.2 SD, and from 8.6 to 10.8, for a definition of 0.5 SD. Mean subdomain scores and distribution-based MCID estimates for subdomain scores are also included in Table 2.
Mean WISQOL standardized scores for a response of “yes” or “no” for each question at initial and follow-up visits are reported in Supplementary Table S1. Results of the sensitivity analysis demonstrated that utilizing all three anchor questions had the highest correlation with total WISQOL score (r = 0.372). Full results of the sensitivity analysis are in Supplementary Table S2.
The cross-sectional anchor-based MCID estimates ranged from 3.1 to 5.4 for a definition of 0.2 SD and from 7.8 to 13.6 for a definition of 0.5 SD. These estimates were lowest for the anchor response level 3, which represented a healthier state (estimates of 3.1 and 7.8), and highest for anchor response level 0, representing the least healthy state (estimates of 5.4 and 13.6). Estimates for scores and subdomain scores are presented in Table 3.
Cross-Sectional Anchor-Based Minimum Clinically Important Difference Estimates for Wisconsin Stone Quality of Life Total Scores and Subdomain Scores
The within-group anchor-based MCID estimates of WISQOL total standardized score for improvement ranged from 8.5 to 10.3 and for deterioration ranged from 3.1 to 6.3. Of note, the estimates for the emotional impact and impact on vitality subdomain scores were not significantly different between time points for anchor difference level “−1.” Also, CIs were wide and included the null hypothesis for anchor difference level “−3” for all WISQOL standardized scores and subdomain scores. Estimates for scores and subdomain scores are presented in Table 4.
The between-group anchor-based MCID estimate for improvement was 9.1 in both unadjusted and adjusted models (adjusted CI: 7.5–10.8, p < 0.0001). The estimate for deterioration was 4.3 for the unadjusted model and 4.2 for the adjusted model (adjusted CI: 2.3–6.1, p < 0.0005). Estimates for scores and subdomain scores are presented in Table 5. Of note, the estimates for the impact on vitality subdomain score were not significantly different between deterioration and no change in both unadjusted and adjusted models (p > 0.05). A depiction of MCID estimates for all four methods is shown in Figure 2.
Within-Group Longitudinal Anchor-Based Minimum Clinically Important Difference Estimates for Wisconsin Stone Quality of Life Total Scores and Subdomain Scores
MD = mean difference.
Between-Group Longitudinal Anchor-Based Minimum Clinically Important Difference Estimates for Wisconsin Stone Quality of Life Total Scores and Subdomain Scores
CI = confidence interval.
Discussion
For improvement, the anchor-based estimates ranged from 8.5 to 10.3, with an average of 9.4, and for deterioration the estimates ranged from 3.1 to 6.3, with an average of 4.7. These ranges approximate a clinically meaningful difference in WISQOL score to represent a change in HRQOL in stone formers. The three anchor questions used in this study assess highly significant changes in health from a clinical perspective. Accordingly, our estimates of the “minimally significant” change in WISQOL score are conservative. Future studies could utilize anchor questions representing more granular changes in patient condition to assess whether a more “minimally significant” estimate can be obtained. Regardless, this is the first study reporting an MCID score for the WISQOL tool to date.
These estimated reference ranges can be used to enhance the use of the WISQOL score in the clinical setting to track improvement in HRQOL in response to management strategies for stone disease. Our team published a recent study showing a lower WISQOL score in patients living in neighborhoods with high social vulnerability, with an estimated MD of 8.1 (p = 0.001). 16 Using our MCID estimate, this was statistically significant and may also be clinically meaningful. Another recent study by our team found that females on average had a WISQOL score that was 9.1 points lower than males (p < 0.001), again which may represent a clinically meaningful difference according to our MCID estimate. 17
A study by Stern et al. demonstrated that younger and female stone formers had a worse WISQOL score than their older or male counterparts. 4 This study categorized the standard score into five quantiles due to non-normally distributed WISQOL data; however, despite defining their outcome differently, the quantiles represented a 20-point change in score, which is above the threshold for clinical significance using our estimate for the MCID. Another study by Ahmad et al. identified several factors associated with a lower WISQOL score, including lower income, non-White race, and unemployed work status. 5 The definition of the outcome was an average of the 5-point Likert scale. After translating this to standard score, all MDs were clinically significant except notably the female gender and severe recurrent stone formation.
This study is not without limitations. The most obvious limitation is that estimating the MCID varies depending on the study population used to estimate it. However, when adjusting for age, sex, and race in our between-group linear regression model, the estimates did not change significantly, which suggests that these demographic factors play a minimal role in influencing our estimation of the MCID. Yet, this is a single-center study, so the MCID estimate is most relevant to our patient demographic. Furthermore, different stone former subgroups based on etiology of disease or number of comorbidities may have different MCID estimates. More research is needed to clarify these estimates. Furthermore, our study had variable intervals between initial and follow-up visits, with a median interval of about 4 months. Standardizing this interval would reduce bias from variable follow-up.
Conclusions
In summary, we have determined that an MCID range of 3.1–13.6 approximates the threshold for detecting a clinically significant change in WISQOL score when managing HRQOL in stone formers. A conservative recommendation would be to use a difference of 9 as a threshold. These findings can be used to further implement WISQOL in guiding clinical decision-making. More research is needed to determine subgroup-specific MCID estimates.
Footnotes
Author Disclosure Statement
S.O.Q. has the below affiliations. Coloplast: on the BPH advisory board. Cook: Lecturer and proctor for holmium laser enucleation of the prostate. Wolf: proctor for holmium laser enucleation of the prostate.
Funding Information
There are no funders to report for this submission.
Supplementary Material
Supplementary Table S1
Supplementary Table S2