
Abstract
Abstract
Nations around the world are considering strategies to mitigate the severe impacts of climate change predicted to occur in the twenty-first century. Many countries, however, lack the wealth, technology, and government institutions to effectively cope with climate change. This study investigates the varying degrees to which developing and developed nations will be exposed to changes in three key variables: temperature, precipitation, and runoff. We use Geographic Information Systems (GIS) analysis to compare current and future climate model predictions on a country level. We then compare our calculations of climate change exposure for each nation to several metrics of political and economic well-being. Our results indicate that the impacts of changes in precipitation and runoff are distributed relatively equally between developed and developing nations. In contrast, we confirm research suggesting that developing nations will be affected far more severely by changes in temperature than developed nations. Our results also suggest that this unequal impact will persist throughout the twenty-first century. Our analysis further indicates that the most significant temperature changes will occur in politically unstable countries, creating an additional motivation for developed countries to actively engage with developing nations on climate mitigation strategies.
Introduction
Recent research has examined differences in climate change exposure between developed and developing nations. Tol et al. note that poor countries tend to be hotter, and thus agricultural and other economic activities in these nations are closer to their upper temperature tolerance.3 Therefore, as temperature increases as a result of global warming, the economies of poor countries near the equator will be more severely affected. Tol predicts, however, that this discrepancy will slowly decrease during the next century as a result of more rapid warming at high latitudes.4 Research conducted by Yohe et al. further examines exposure to climate change by using a model to generate predictions for the degree to which each nation will be affected by temperature change.5 Yohe et al. find that developing countries will be more severely affected by climate change than developed nations when they consider the aggregate impacts of warming. They note, however, that the effects of warming are predicted to be severe for all nations if they calibrate their model to consider the possibility of extreme weather events. A recent study by Srinivasan et al. adds to the climate change exposure literature by comparing the exposure of nations to climate change by national per-capita income. Srinivasan et al. find that poor nations bear far greater costs of climate change.6
In addition to studying changes in temperature, researchers have indicated significant concern about the effects of variations in precipitation and runoff on the availability of water.7 Milly et al. use an ensemble of twelve climate models to predict a 10–40% increase in runoff in equatorial Africa, northern North America and northern Eurasia, along with a 10–30% decrease in runoff in southern Africa, southern Europe, and the Middle East.8 Milly et al. note that such changes in regional runoff could have severe effects on economic and individual welfare. In contrast, Vorosmarty et al. predict that water availability will be influenced less by changes in runoff and precipitation due to climate change than by changes in water demand resulting from population growth.9
Climate change research has also focused on the capacity of different nations and regions to adapt to climate change and what factors determine a particular area's vulnerability. Tol et al. stress the influence that gross domestic product and per-capita income have on a nation's vulnerability to climate change, while noting that equality and social welfare can also be important.10 Keskitalo and Kulyasova add that the effectiveness of local and national governance is vital to successful adaptation to climate change.11 Seely et al. further suggest that sufficient technology is necessary for adapting to changes in climate.12 Brooks et al. use statistical analysis to investigate which factors out of the many potential variables mentioned in other research are most important in determining vulnerability to climate change at the national level. They find eleven key indicators of climate change vulnerability, including governmental, financial, educational, and health statistics. Based on these indicators, Brooks et al. suggest that countries located in Sub-Saharan Africa are the most susceptible to climate change impacts.
The Intergovernmental Panel on Climate Change (IPCC), which represents the consensus of hundreds of prominent climate researchers, agrees that developing regions are more vulnerable to climate change. The IPCC's most recent report, issued in 2007, notes that “there are sharp differences across regions and those in the weakest economic position are often the most vulnerable to climate change.”13 The IPCC's 2007 report also includes highly robust predictions for climate change variables, representing the consensus of multiple climate models.
Despite the impressive body of research regarding both vulnerability and exposure to climate change, no studies have comprehensively compared these two factors at the national level. Many studies, such as those conducted by Milly et al. and Vorosmarty et al., focus primarily on exposure, while those by Keskitalo and Kulyasova, Seely et al., and Brooks et al. focus on vulnerability. The IPCC reports extensively analyze both vulnerability and exposure, but they examine these variables mainly at the global and regional level. The modeling of climate change impacts conducted by Yohe et al. incorporates measures of the adaptive capacity of nations, a concept that is a major component of climate change vulnerability.14 Yohe et al., however, use their assessment of adaptive capacity to scale the impacts of climate change exposure for particular countries, instead of comparing exposure and vulnerability. Srinivasan et al. and Tol et al. both directly compare exposure and vulnerability in their research by relating climate change and national income. However, they focus exclusively on national income in their analyses.
This article seeks to extend existing research regarding the distribution of climate change impacts by analyzing the justice dimensions of climate change in a new way. We use geospatial analysis to predict the effects of climate change at the country level, and then determine whether there is a correlation between the exposure of these nations to climate change and their vulnerability as measured by a variety of social and economic factors. Thus, we seek to determine if the countries that are the most highly exposed are also the most vulnerable to climate change. We also attempt to gain a broader understanding of potential differences in exposure among countries by including precipitation and runoff variables in our analysis. Through our examination of precipitation and runoff, we hope to elucidate whether vulnerable nations will be more severely impacted by changes in water resources than developed nations. Finally, we analyze climate change predictions for multiple years throughout the twenty-first century to explore whether differences in the impact of climate change in developed versus developing nations converge or further diverge over time.
Methods and Data
Estimating exposure to climate change
As the data substrate for our geospatial analysis, we downloaded climate predictions generated from the Community Climate System Model (CCSM), created by the National Center for Atmospheric Research (NCAR).15 For three variables—surface temperature, runoff, and precipitation—we obtained predictions for every month in 2075 and every month in 2009 as a reference point, and aggregated these monthly predictions into an annual average. For each of these three variables, we used predictions that were based on the IPCC's A1B emissions scenario. All spatial data were imported into ArcGIS 9.2 (ESRI, Redlands, WA) for analysis.
We began our analysis by calculating the difference between the 2009 predictions and 2075 predictions for temperature, precipitation, and runoff. To compare this predicted change in the variables for different countries, we performed a spatial join between our model outputs and a political map of the world. This join averaged the values for each of the model output points that fell within a country's borders into a single value for that country. Since the model data were formatted as a grid of points covering the globe (see Figure 1, step 1), there were some small countries for which we could not estimate a value because no points were located inside their borders (see Figure 1, Step 2). We addressed this problem for precipitation and temperature by creating a circular buffer around each point in the grid (see Figure 1, step 3). We then re-ran the spatial join, and each country intersected at least one of the buffered areas, allowing us to generate a value for every country (see Figure 1, step 4). Unfortunately, this same solution could not be applied for runoff, as the runoff for each point in the ocean was zero, which would cause our buffering system to calculate a value of zero for island nations. We were thus forced to exclude small countries from our analysis of predicted change in runoff.
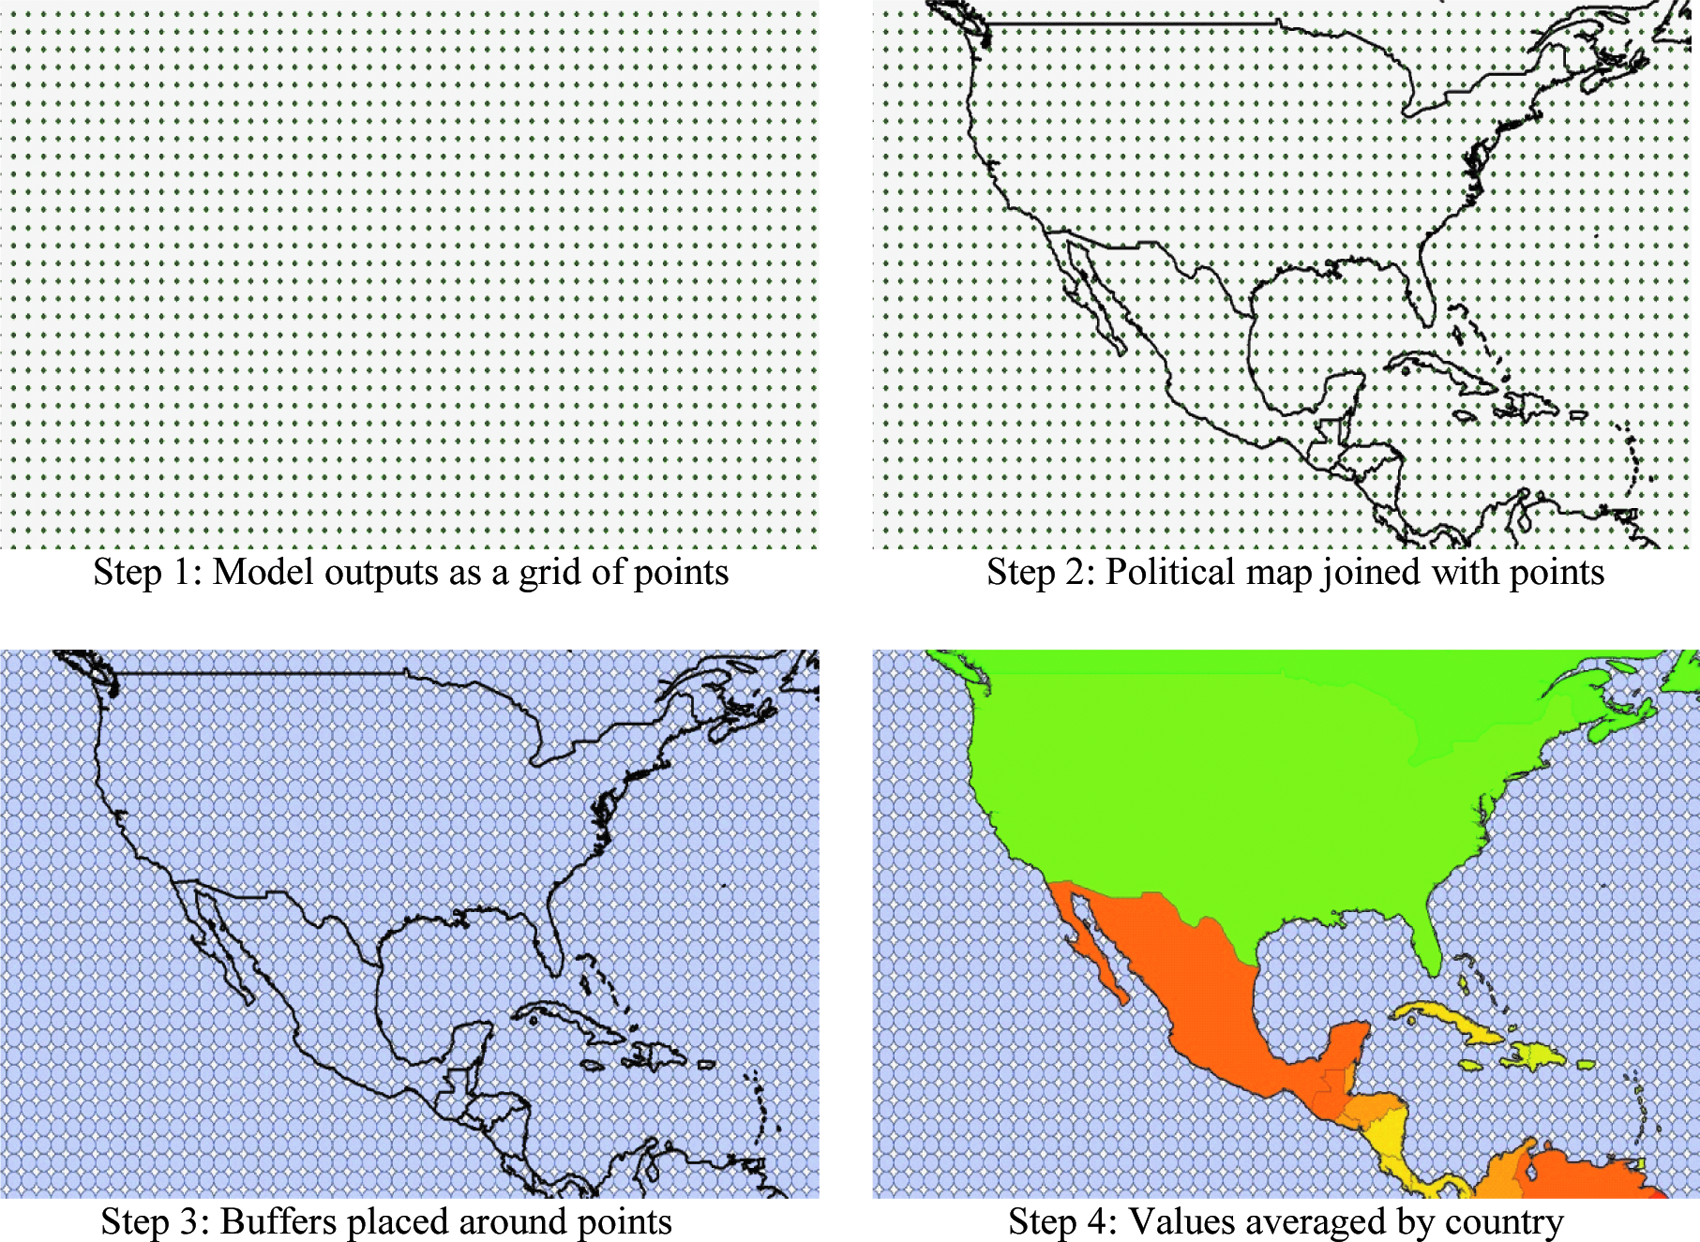
Illustration of the steps used for generating country-level values of climate predictions.
Scaling the effects of climate change exposure
Once we had calculated the average predicted change in precipitation, runoff, and temperature, we interpreted how these changes would affect different countries. For runoff and precipitation, we began by calculating the percent change in these variables for each country. We used percent change to account for the fact that a small change in runoff or precipitation would have a much greater effect in arid regions than rainy ones. Using the percent change in precipitation and runoff may exaggerate the uncertainty inherent in climate model predictions for arid areas. Nevertheless, it serves as a more accurate metric than absolute change for comparing the effects of these variables between nations, since it takes into account the relative importance of precipitation and runoff for each country. We then assumed that a percent increase in these variables was linearly beneficial to nations, and a percent decrease was linearly harmful. This assumption is certainly an oversimplification, as increases in annual precipitation and runoff can benefit countries greatly by providing water for human use, but they are also associated with flood risks, possible water contamination, and shifts in seasonal runoff timing.16 Unfortunately, current climate models cannot accurately predict the influences of these additional factors. Assessing the effects of precipitation and runoff on a linear scale thus provides a reasonable estimate for the general impacts of changes in these two variables on the welfare of countries.
For temperature change, on the other hand, a linear model is not applicable. For much of the world, increasing temperature will have a host of negative effects including heat waves, decreased crop productivity, and spread of vector-borne diseases. Nations with cold average temperatures, however, may actually benefit from temperature increases that provide them with longer growing seasons and milder winters. We therefore employed an inverted V-shaped curve for assessing the effects of temperature change, which designates increased temperature as beneficial up to an “optimum temperature,” above which increases are considered to have a negative impact. Mendelsohn et al. show that agricultural production follows an inverted U-shaped curve, with output peaking at 11.7 degrees Celsius.17 Nordhaus extends this principle to other economic sectors such as industry, and shows that overall market output peaks between 7 and 14 degrees Celsius.18 We chose to use Mendelsohn's optimum temperature of 11.7 degrees for our optimum temperature, and then used a “V-shaped” curve in which any increase in temperature above this point was linearly detrimental and any increase below this point was linearly beneficial. Thus, an increase from an average annual temperature of 12 degrees C to 13 degrees C would be assigned a value of −1 in our scale, while an increase from 5 degrees to 6 degrees would be given a value of +1. Our focus on optimum temperature ignores the fact that natural ecosystems are adapted to the current climate of their location, and are thus likely to be negatively affected by any change in temperature. Since this study is focused primarily on the effects of climate change on human welfare, the concept of an optimum temperature still represents a reasonable analytical approximation.
Correlating exposure with vulnerability
To objectively compare climate change exposure to each country's political and economic well-being, we calculated the correlations between each of our scaled variables and five measures of vulnerability. First, we used the Human Development Index (HDI), as calculated by the United Nations Development Programme (UNDP). The HDI comprises measures of life expectancy at birth, educational attainment, and standard of living.19 A country's HDI score is important to our study, as healthier and wealthier (both financially and in terms of human capital) populations may be better equipped to handle climate-related stresses.
Second, we used the UNDP's technology achievement index (TAI), which is designed to capture the achievement of countries in creating and diffusing technology and building human technological skills. The TAI combines measures of technology creation, diffusion of recent innovations, diffusion of old innovations, and human technological skills.20 The TAI is explicitly not a measure of national leadership in technology development, but rather measures the extent to which the country as a whole is participating in creating and using technology. We included the TAI in our analysis since technological capability will be vitally important to implementing the changes that are necessary for adapting to climate change.
Third, we used the World Governance Indicators (WGI), established by the World Bank to assess the quality of governance and governments. The WGI include measures of voice and accountability, political stability and absence of violence, government effectiveness, regulatory quality, rule of law, and control of corruption.21 We include the WGI as key measures of vulnerability as they indicate how resilient countries may be to the “shocks” introduced by climate change.
Fourth and fifth, we included two additional variables that were not part of an indexed measurement, but nonetheless contribute to a nation's vulnerability to climate change. In order to account for the fact that nations with a greater reliance on agriculture will be more severely affected by climate change, we included the percent contribution of agriculture to each nation's GDP. We obtained these data from the World Bank's World Development Indicators.22 To assess each country's ability to provide assistance to their citizens coping with climate change, we included per capita spending on health care and education. For this measure, we downloaded data regarding health and education spending from UNDP's Human Development Report and calculated the sum of health and education spending per capita.23
As an additional piece of analysis, we highlight the predicted change in precipitation, runoff, and temperature for Low Income Countries Under Stress (LICUS) and African nations. LICUS states are designated by the World Bank as countries with extremely low per-capita income, as well as weak institutions and governance. In order to be considered LICUS, nations must have a per-capita income within the threshold of International Development Association eligibility, and a governance rating of 3.0 or less on the World Bank's Country Policy and Institutional Assessment rating scale.24 LICUS states and African nations are both particularly vulnerable to climate change, as they are low on multiple vulnerability metrics. For this reason, in our results, we highlight LICUS and African nations separately to determine how these two subsets of vulnerable nations are affected by climate change. LICUS states are important to examine for an additional reason: their unstable government institutions could deteriorate if they are badly impacted by climate change. Climate change in LICUS states could thus be considered a national security concern in addition to a justice issue. In fact, security agencies and militaries around the world have already started to view climate change in unstable countries as a national security threat.25
Examining trends for multiple years
After calculating correlations between the socioeconomic measures and the climate variables for the change between 2009 and 2075, we examined the change between 2009 and several other end years. We downloaded model predictions for temperature in 2033, 2066, and 2099, and correlated each of these predictions with the HDI. These correlations serve as an indicator of whether our findings are stable for the twenty-first century.
Results
Temperature
In our analysis of temperature change, we find that most countries moved away from the assumed optimum temperature of 11.7 degrees. Figure 2 shows that many of these countries are located in South America, Africa, and Southeast Asia. Most of the countries in these regions are developing, and thus typically scored low on the WGI, HDI, and TAI. Countries at high northern latitudes, including the United States, Canada, Russia, and Northern Europe, tended to benefit from temperature change.

Change from optimum temperature by country.
Despite a set of European and Middle Eastern nations that were developed but moved away from optimum temperature, we found a clear correlation between developing nations and detrimental temperature changes (see Table 1). HDI, TAI, WGI, and spending on education and healthcare all had a positive correlation with change from optimum temperature, meaning that nations that were more vulnerable moved away from optimum temperature (all p < .0001). Percent contribution of agriculture to GDP had a negative correlation with temperature change, also indicating that vulnerable nations moved away from optimum temperature (p = .002).
Precipitation and runoff
Our maps for precipitation and runoff show a much different picture than the maps for temperature. The average annual precipitation increased for most countries between 2009 and 2075, providing a net benefit to these nations (see Figure 3). The change in average annual runoff was also primarily positive, though not as consistently as precipitation (see Figure 4). The distribution of positive and negative effects was essentially random between nations, without clear regional trends. This finding suggests that there is a relatively equal distribution of impacts resulting from precipitation and runoff changes between developed and developing nations.
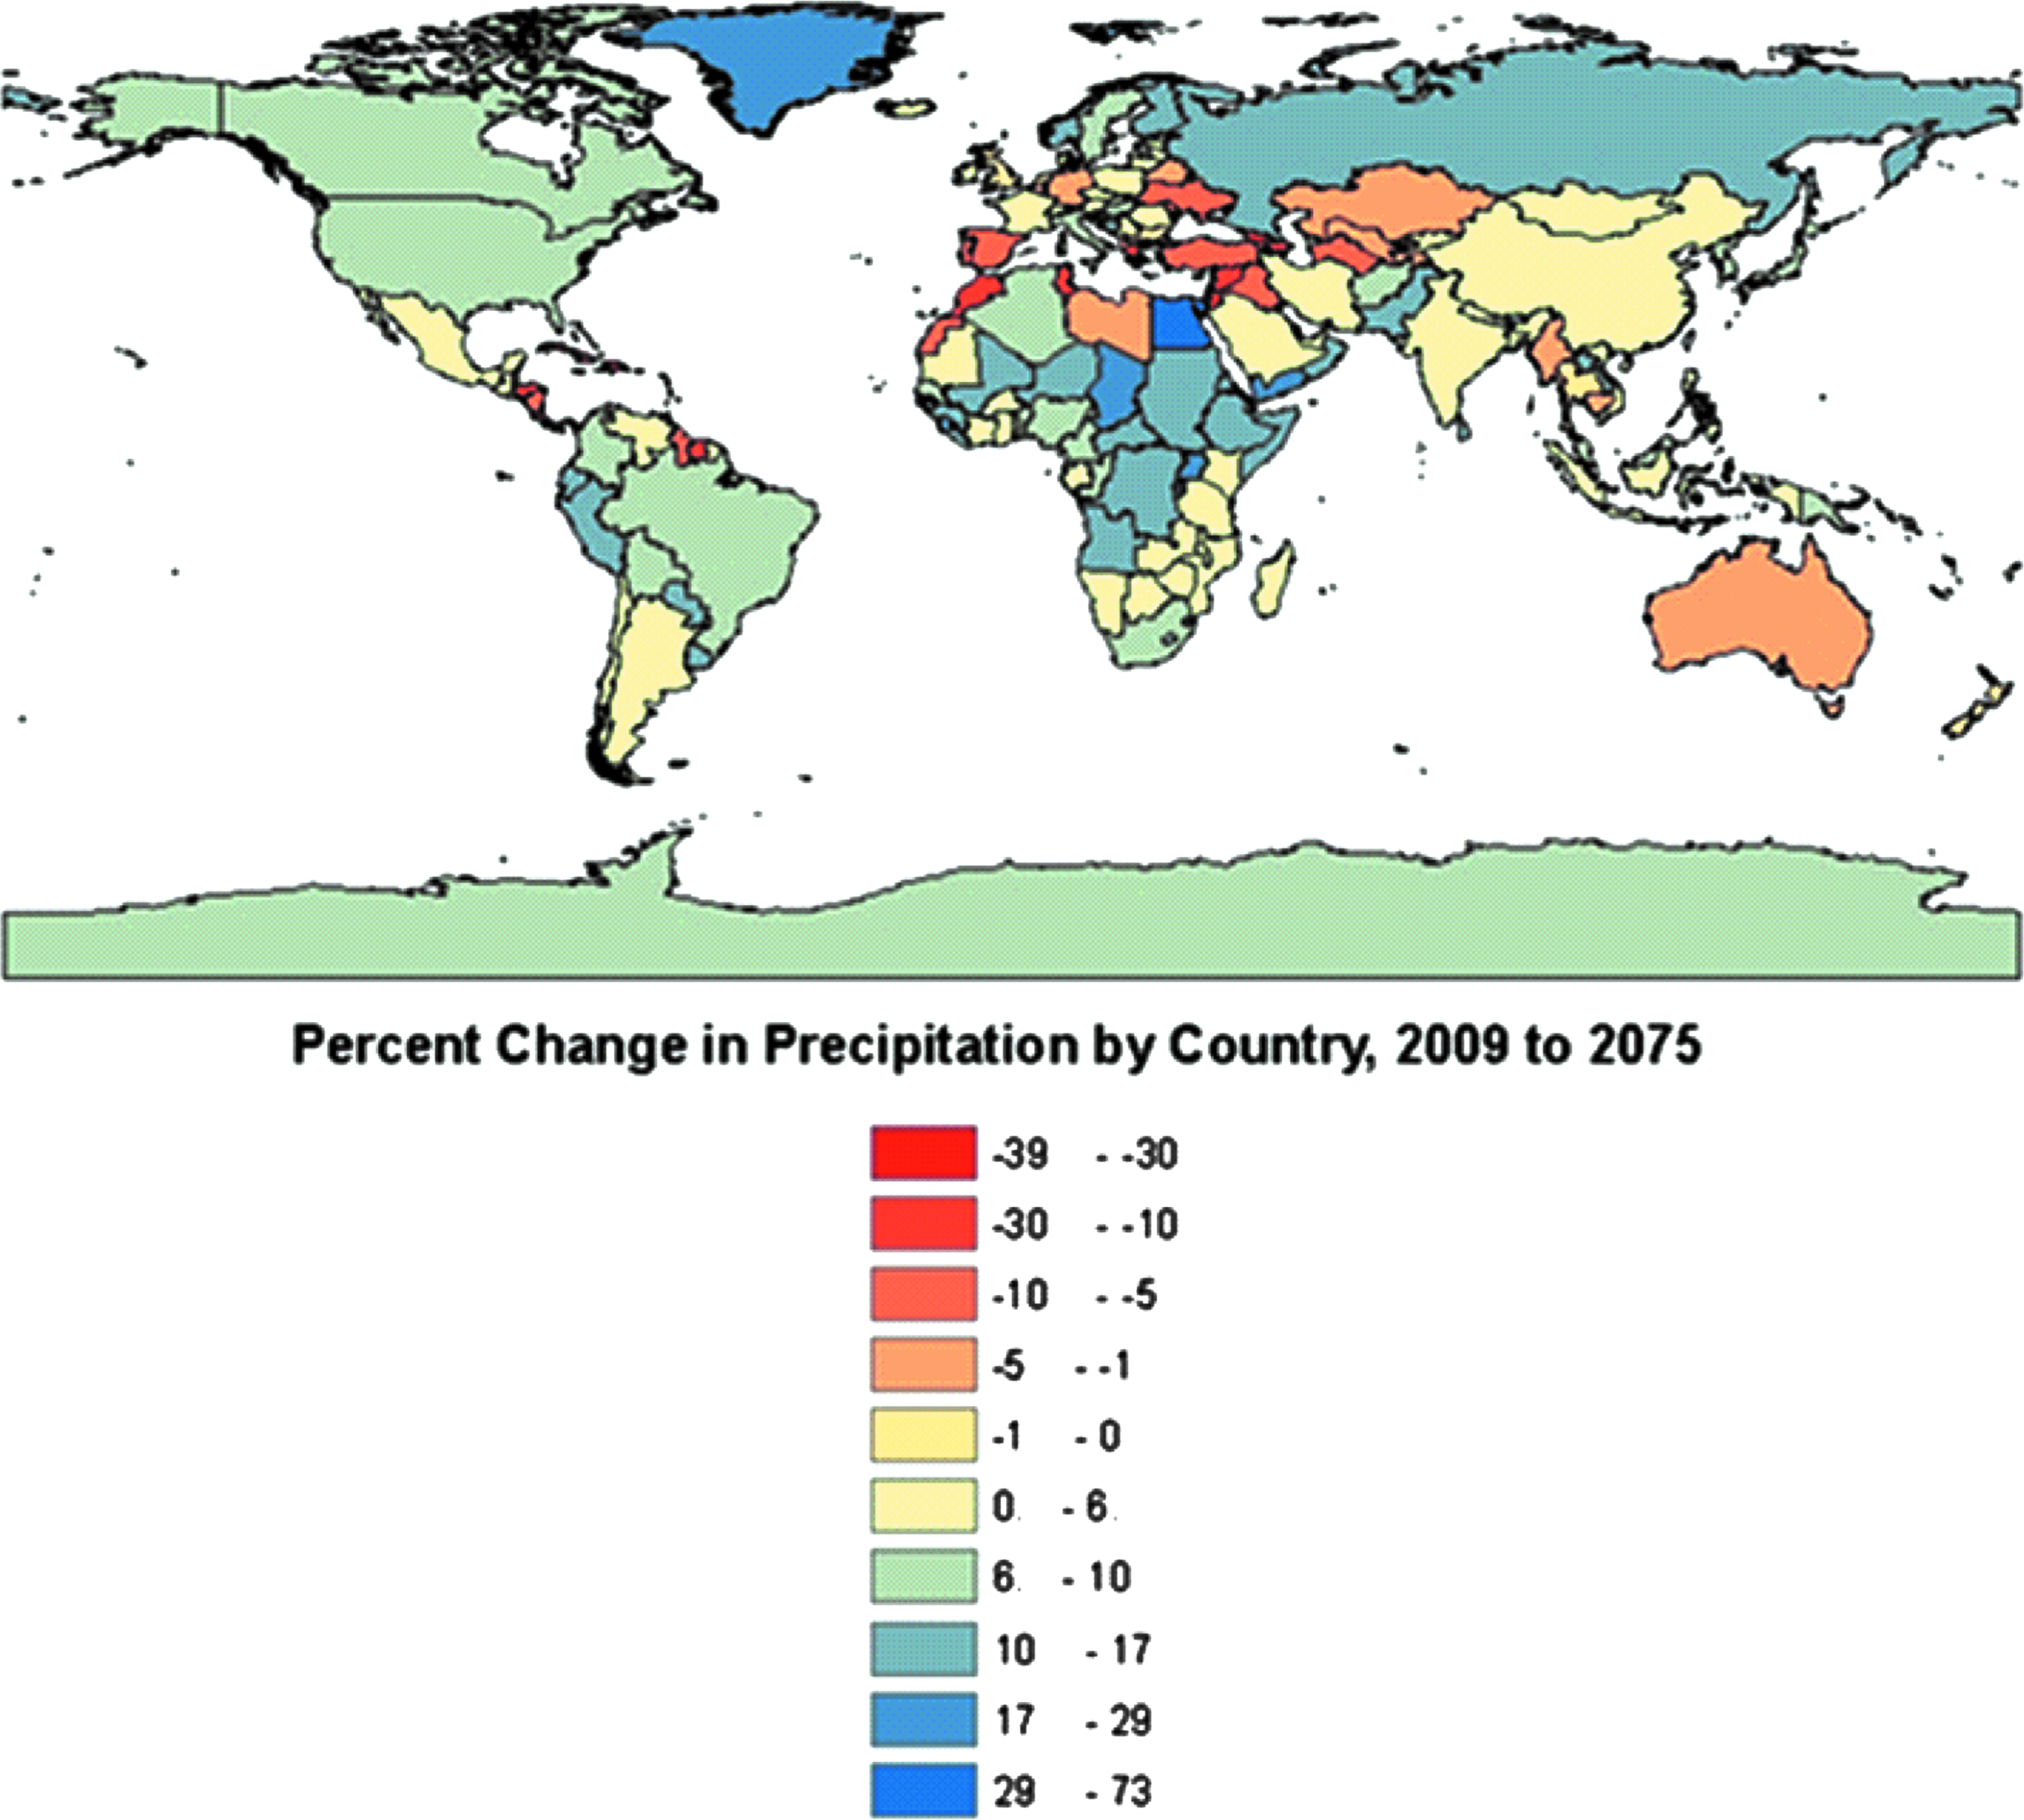
Percent change in precipitation by country.
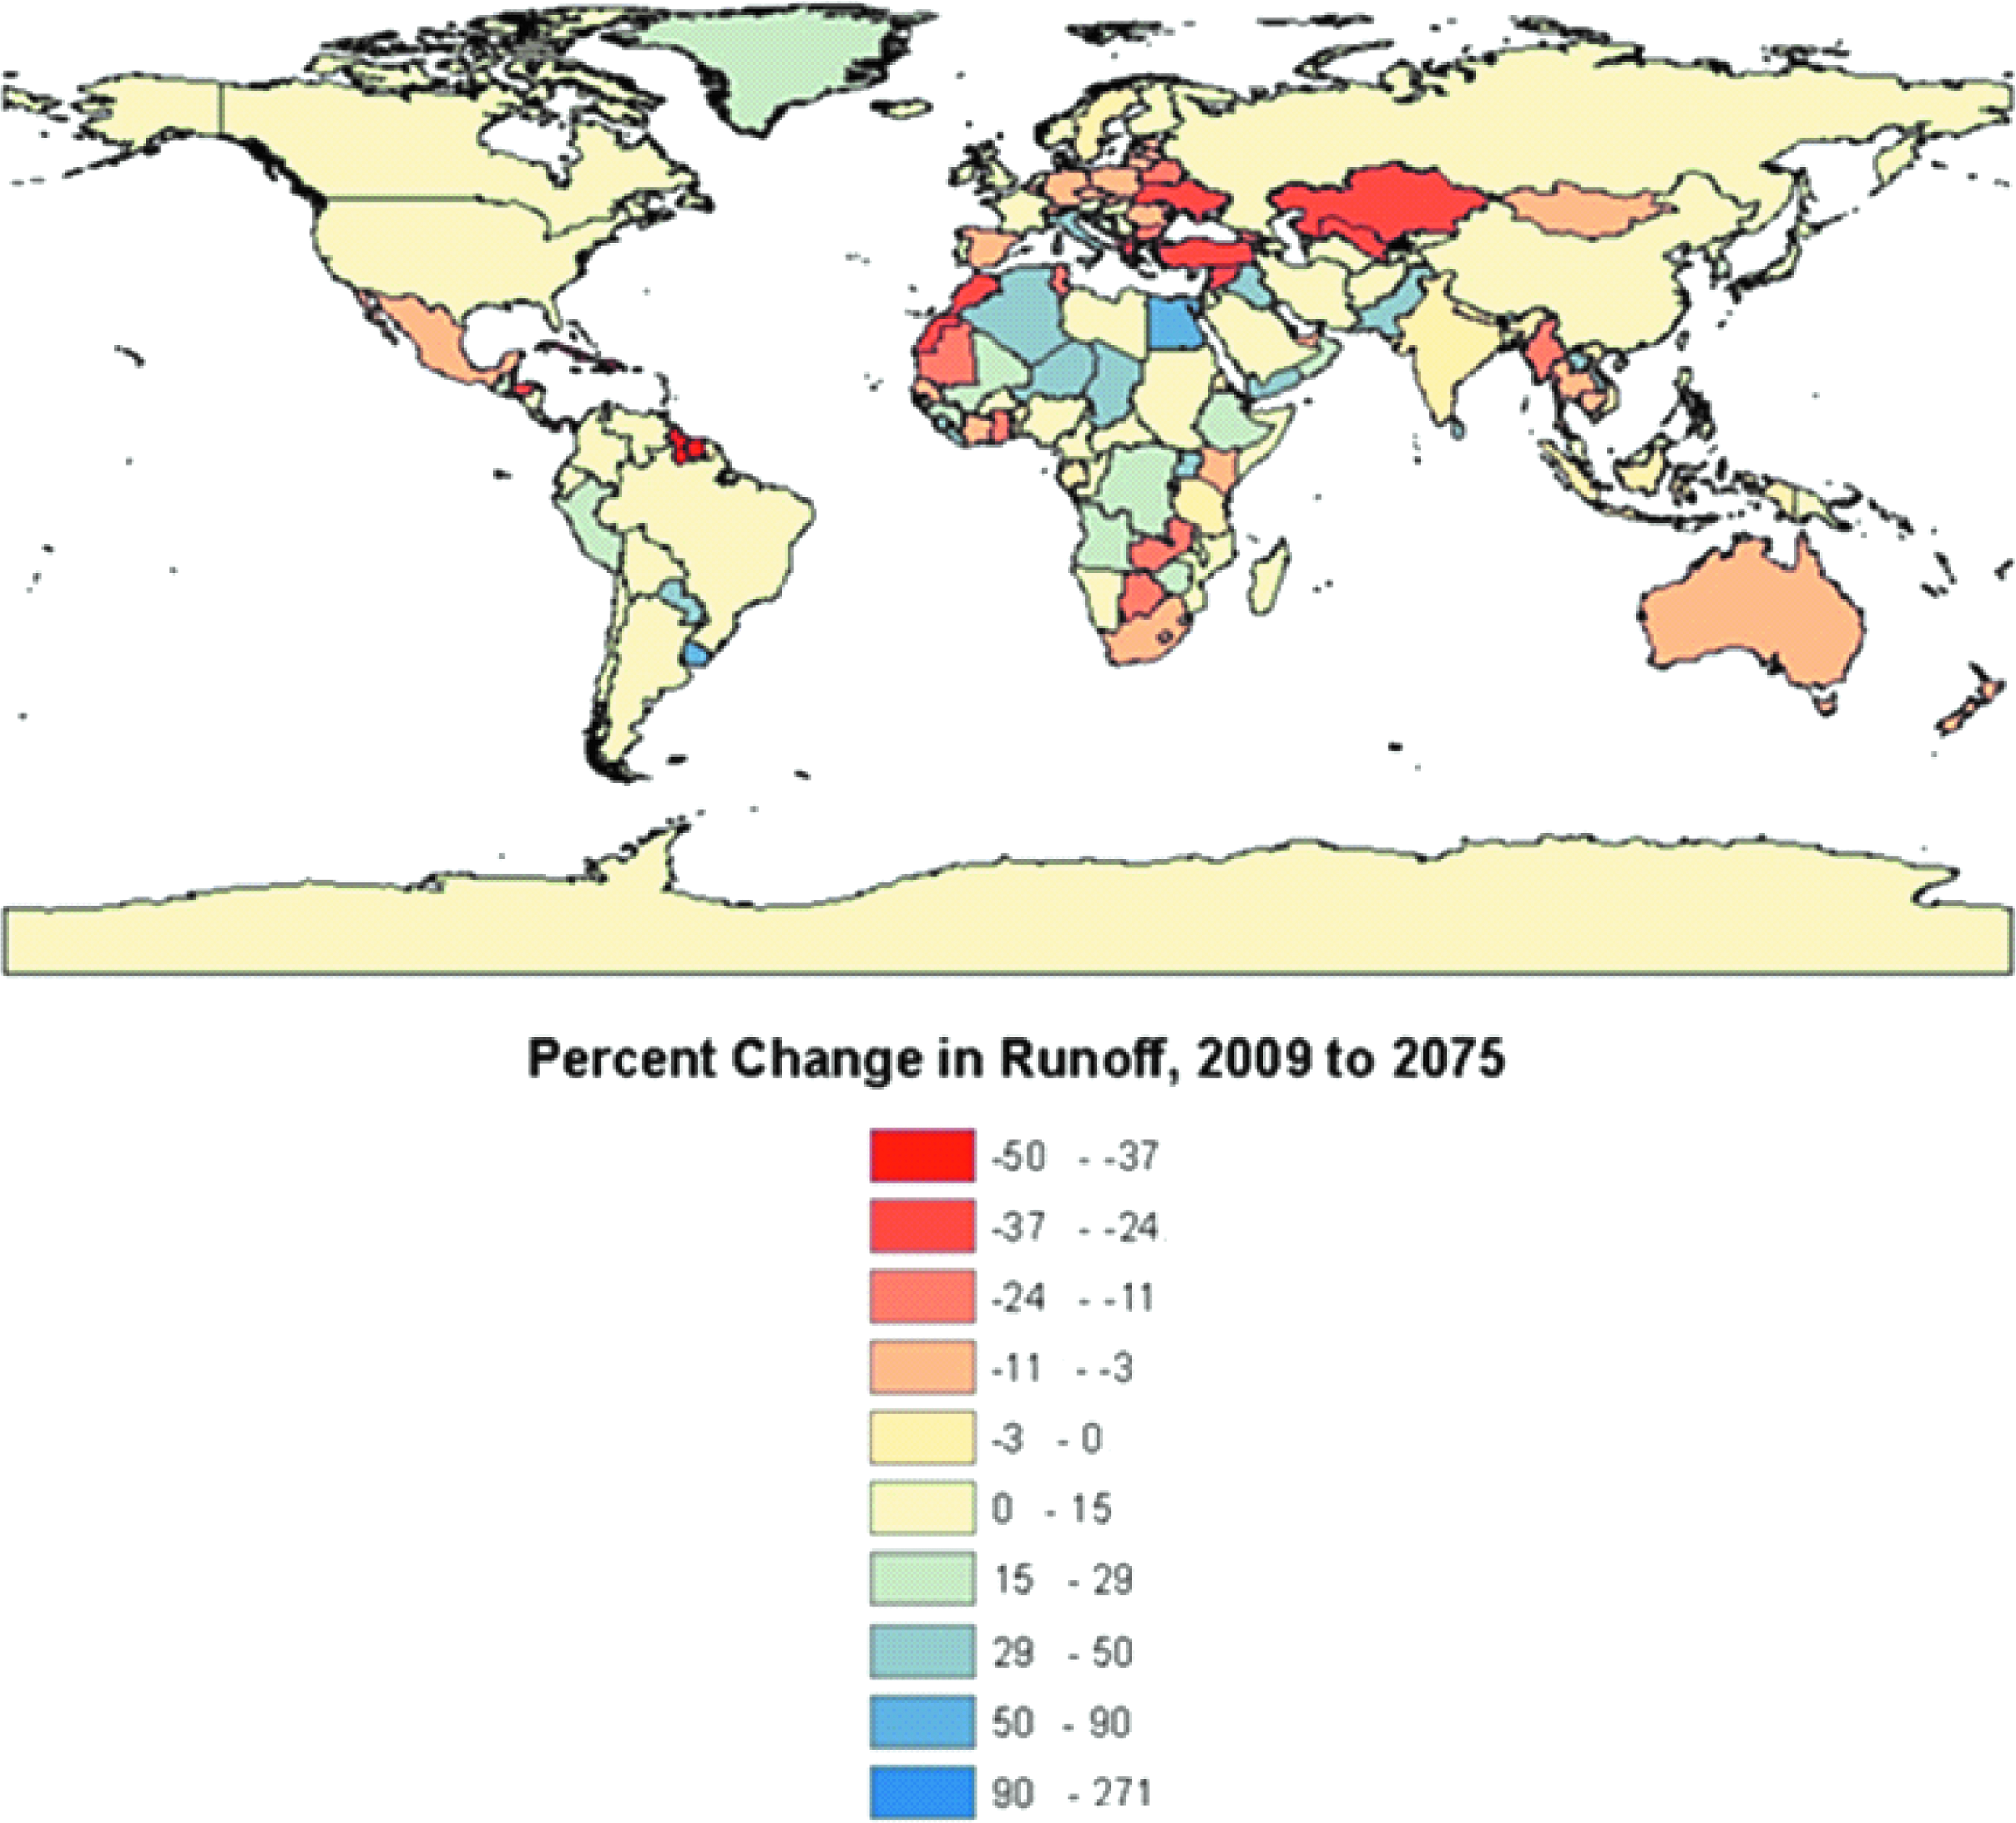
Percent change in runoff by country.
The correlations between precipitation and runoff and the vulnerability metrics were almost all insignificant (see Table 1). Out of twenty of these correlations, only three, the correlation between precipitation and HDI (p = .0002), the correlation between precipitation and WGI Regulatory Quality (p = .024), and the correlation between precipitation and percent contribution of agriculture to GDP (p = .006), were statistically significant. The first two of these correlations were both weakly negative, indicating that countries with low HDI and WGI values actually benefit from precipitation change. The correlation between precipitation and percent contribution of agriculture was weakly positive, indicating that nations with a high dependence on agriculture also benefit from precipitation change. Overall, there was little correlation between runoff and precipitation and national well-being, as measured by our vulnerability metrics.
LICUS and African nations
In our analysis of LICUS and African nations, we found that all of these vulnerable nations moved away from the optimum temperature (see Figure 5). For precipitation, on the other hand, more LICUS and African nations were affected positively than negatively. The effects of runoff were mixed, with approximately half of the LICUS and African nations predicted to increase in runoff and the other half predicted to decrease.
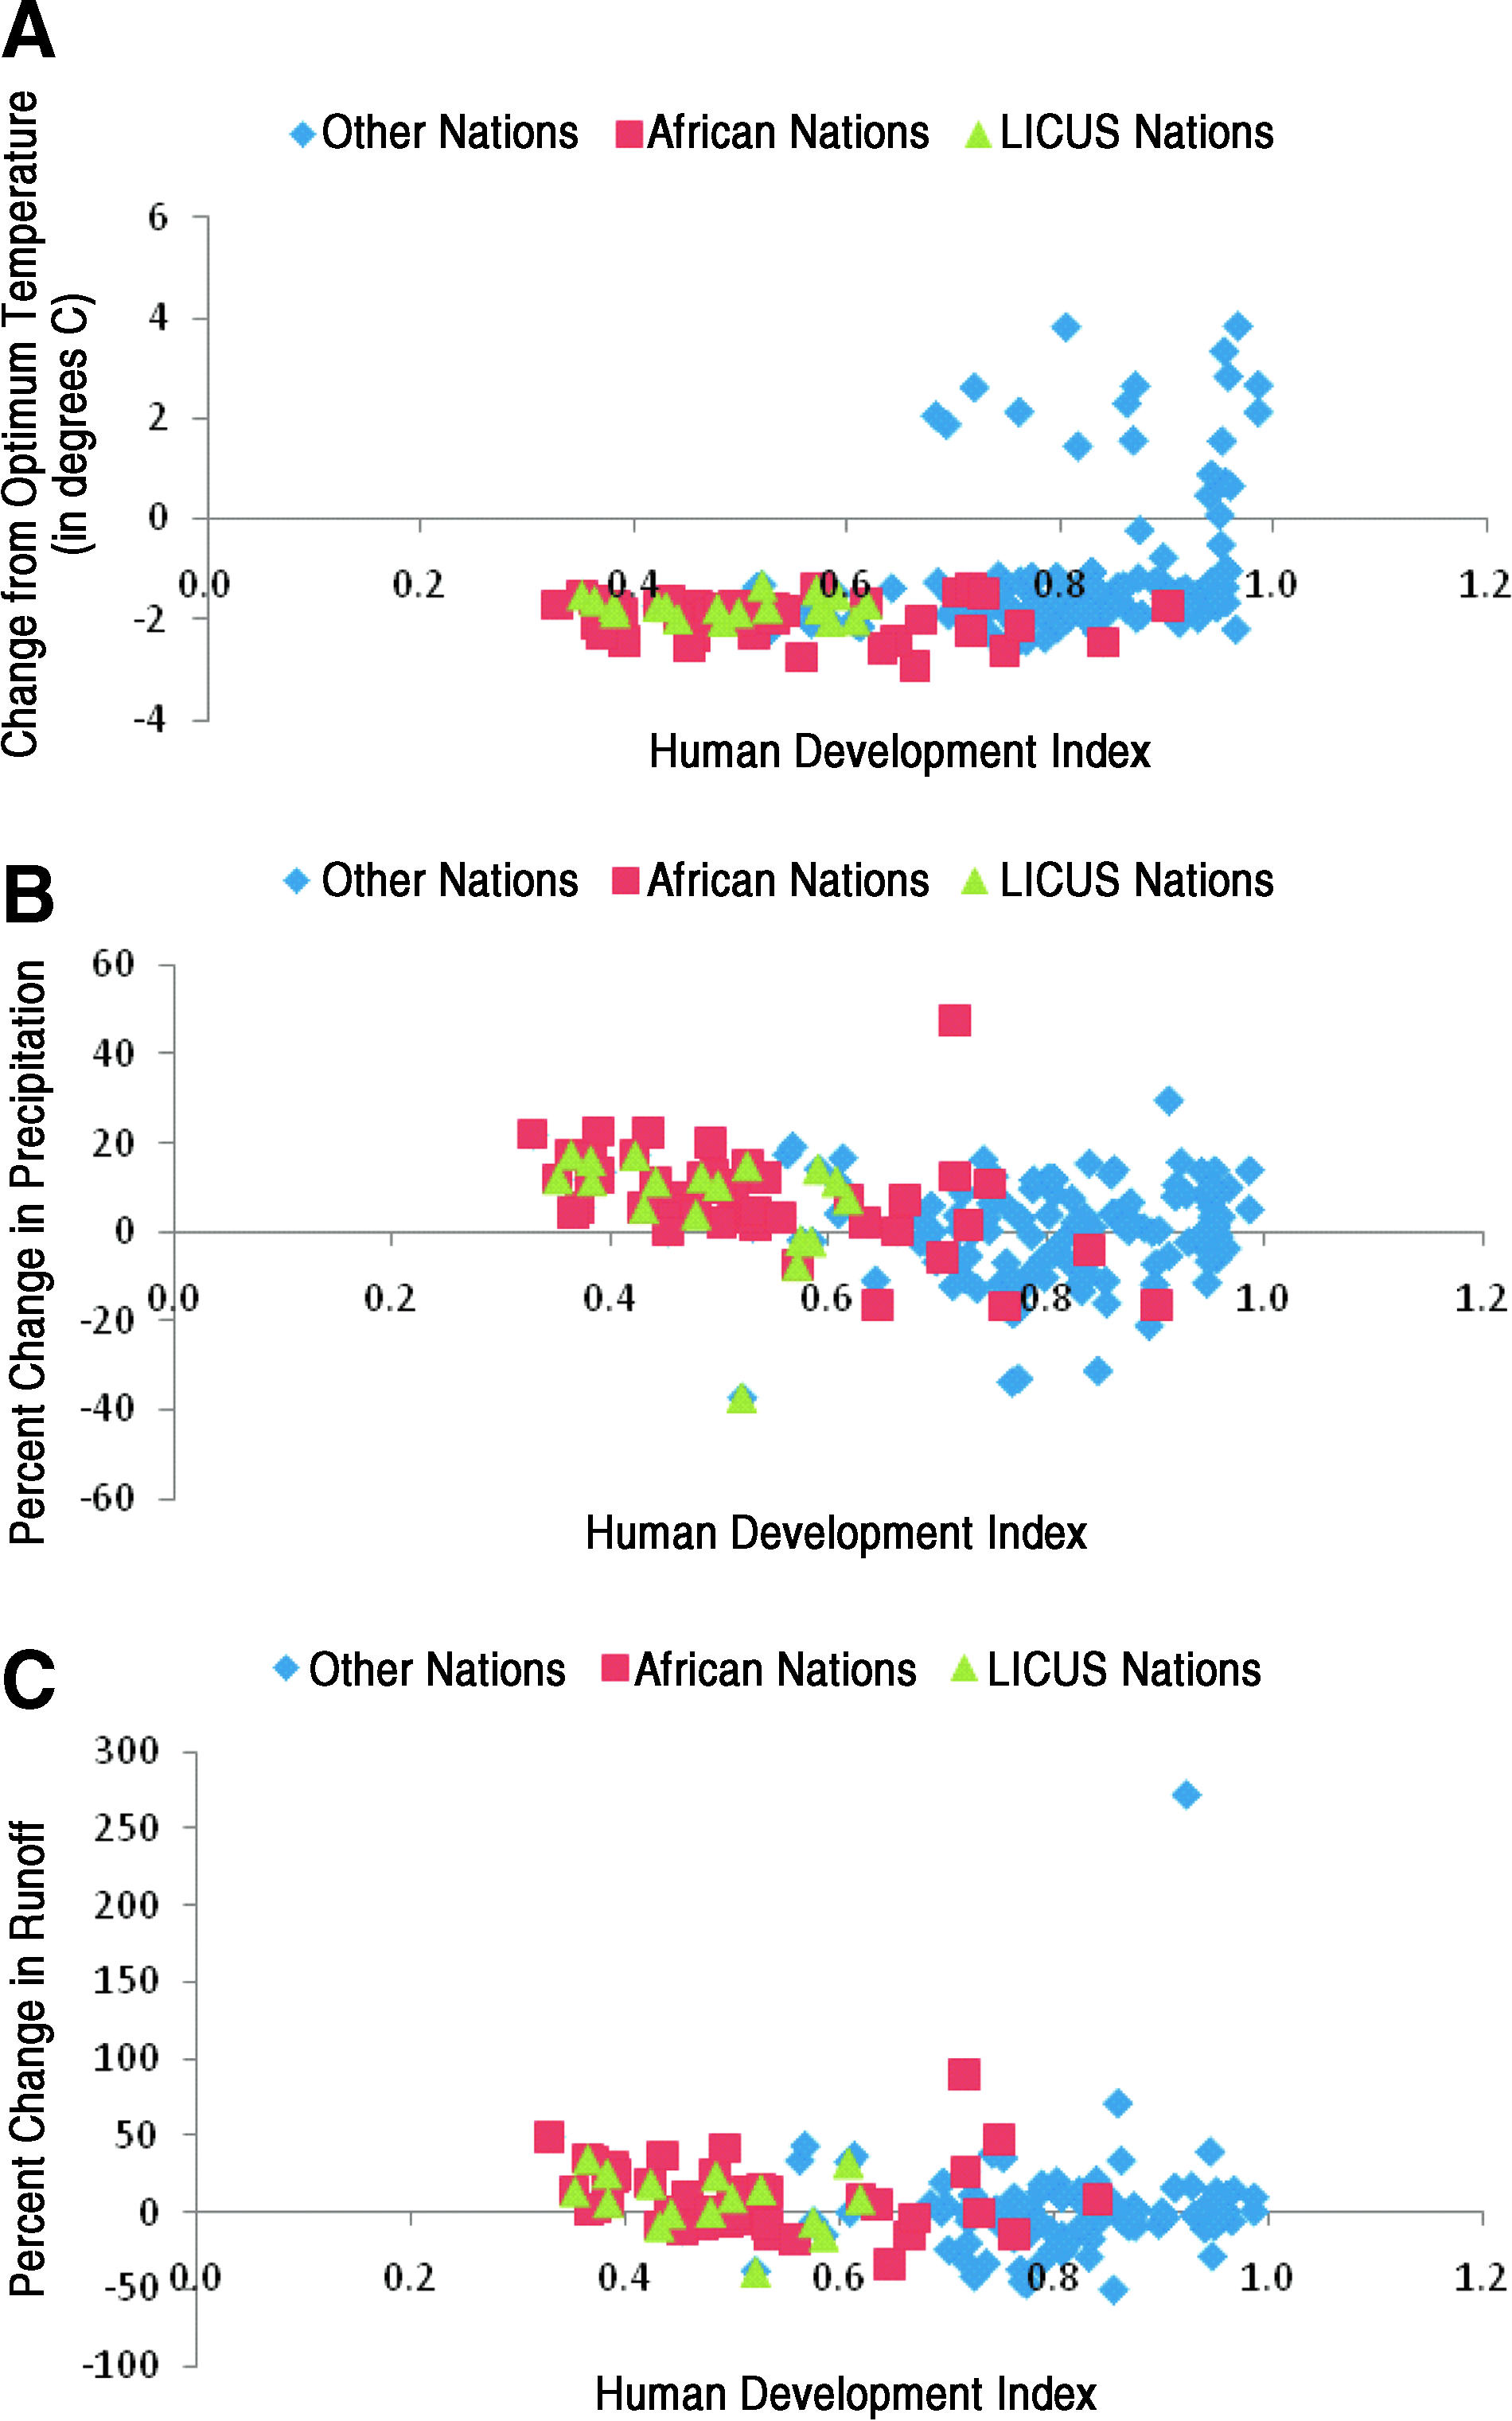
Correlations with HDI focusing on LICUS and African Nations.
Temporal stability
We found that the correlation that we chose to examine temporally, HDI and temperature, remained significant throughout the twenty-first century (see Table 2). The p-value for each correlation was <.0001, suggesting that the relationship between HDI and the impacts of temperature change will persist over this time span. Furthermore, in additional analysis (not shown here), we regressed the temperature changes in 2033, 2066, and 2099 on HDI in three separate estimations. The regression coefficient on temperature increased from ∼1.7 in 2033 to ∼3.9 in 2099, indicating that the gap in temperature effects between low HDI and high HDI countries widens during the next century.
Discussion
The correlations between predicted temperature change and our measures of vulnerability indicate that developing nations do, in fact, face a higher degree of exposure to negative impacts of temperature change. This increased temperature burden on already vulnerable nations could lead to crop failures, slowing of economic development, and even political turmoil. The negative effects of temperature change could lead to particularly dire consequences for LICUS and African nations, all of which move away from the optimum temperature between 2009 and 2075. In addition, our use of a “V-shaped” scale for temperature impacts may actually underestimate increases in temperature for countries that are already far warmer than optimum. If the impacts of temperature on human welfare follow a true U-shaped curve, then very warm nations will be affected even more severely by future climate warming. Furthermore, our analysis of predicted temperature change for multiple time periods suggests that the unequal distribution of temperature impacts will persist over the next century. In fact, our forecasted distribution actually becomes more disparate moving from 2033 to 2099.
Our results for precipitation and runoff imply that the effects of these variables on the welfare of nations will be slightly positive as a whole, as the majority of nations are predicted to increase in precipitation and runoff. The distribution of precipitation and runoff effects is more even than the distribution of temperature impacts. Only three correlations in our analysis involving precipitation were statistically significant, and no correlations involving runoff were significant. Furthermore, in the three precipitation correlations that were significant, nations low on HDI and WGI are actually predicted to become better off. Nevertheless, our predictions for runoff and precipitation change are not all positive; some countries with pre-existing water issues are forecasted to decrease in precipitation and runoff, such as Israel, Jordan, and Syria in the Middle East. It is also important to note that increases in temperature increase the rate of evapotranspiration, which can deplete water resources. While our examination of change in runoff captures some of the effect of increased temperature on evapotranspiration, it is likely to underestimate the overall change in this variable. Moreover, it is clearly an oversimplification to assume that increases in precipitation and runoff are uniformly beneficial, absent any consideration of rainfall intensity or extreme weather events.
There are many variables not included in this study that can affect both exposure and vulnerability to climate change. In terms of exposure, changes in the prevalence of extreme weather events such as heat waves or tropical storms can have a greater impact on the welfare of countries than changes in average annual temperature, runoff, or precipitation.26 Changes in the range of tropical diseases, temporal distribution of rainfall, or number of frost days can also have significant effects on national welfare. The three variables used in our analysis as measures of climate change exposure are intended merely to provide a broad, generalized assessment of climate change impacts and to serve as a potential proxy for other effects. In terms of vulnerability, additional factors that can make a nation susceptible to climate change include the availability of insurance and financial lending, access to improved water sources, and the prevalence of vector-borne diseases. We did not include these vulnerability factors because they were either unavailable as a single quantifiable variable at the country level or they were captured by another index used in this study.
Conclusions
Our analysis indicates that developing nations are faced with both increased exposure to temperature change and high vulnerability to global warming impacts as measured by our vulnerability metrics: the human development index, the technology achievement index, the world governance indicators, percent contribution of agriculture to GDP, and spending on healthcare and education per capita. This double threat to developing nations is certainly an environmental justice issue, with associated policy implications. As Jouni Paavola suggests, developed nations might provide targeted aid to developing countries with the goal of improving their adaptive capacity to climate change.27 Such aid would help developing nations that may be unable to adapt to climate change on their own to address the large impacts they are predicted to receive. In some cases, it may even be in the best interests of developed nations to provide climate change assistance to developing nations for national security reasons. In particular, the fragile LICUS states, which are all negatively impacted by temperature change, are especially at risk for significant upheaval associated with climate change impacts.
Footnotes
Acknowledgments
The authors gratefully acknowledge research support provided by Joshua Tootoo and Anna Bauer.
1
Intergovernmental Panel on Climate Change, “Climate Change 2007: Synthesis Report” (2007): 65.
2
Richard S.J. Tol et al., “Distributional Aspects of Climate Change Impacts,” Global Environmental Change 14 (2004): 261.
3
Ibid., 259.
4
Ibid., 265.
5
Gary Yohe et al., “A Synthetic Assessment of the Global Distribution of Vulnerability to Climate Change from the IPCC Perspective that Reflects Exposure and Adaptive Capacity,” (2006) <
6
U.T. Srinivasan et al., “The Debt of Nations and the Distribution of Ecological Impacts From Human Activities,” Proceedings of the National Academy of Sciences 105 (2008): 1768–1773.
7
Charles J. Vorosmarty et al., “Global Water Resources: Vulnerability From Climate Change and Population Growth.” Science 289 (2000): 284.
8
P.C.D. Milly et al., “Global Pattern of Trends in Streamflow and Water Availability in a Changing Climate,” Nature 438 (2005): 347.
9
Charles J. Vorosmarty et al., “Global Water Resources: Vulnerability From Climate Change and Population Growth. Science 289 (2000): 284–288.
10
Richard S.J. Tol et al., “Distributional Aspects of Climate Change Impacts,” Global Environmental Change 14 (2004): 264–266.
11
E. Carina H. Keskitalo and Antonina A. Kulyasova, “The Role of Governance in Community Adaptation to Climate Change,” Polar Research 28 (2009): 60–70.
12
M. Seely et al., “Advances in Desertification and Climate Change Research: Are They Accessible for Application to Enhance Adaptive Capacity?” Global and Planetary Change 64 (2008): 236–243.
13
Intergovernmental Panel on Climate Change, “Climate Change 2007: Synthesis Report” (2007): 65.
14
Gary Yohe et al., “A Synthetic Assessment of the Global Distribution of Vulnerability to Climate Change from the IPCC Perspective that Reflects Exposure and Adaptive Capacity,” (2006) <
15
National Center for Atmospheric Research, “GIS Climate Change Scenarios” (2009) <
16
Intergovernmental Panel on Climate Change, “Climate Change 2007: Synthesis Report” (2007): 49.
17
William R. Cline, Global Warming and Agriculture: Impact Estimates by Country (Peterson Institute, 2007): 44.
18
W. D. Nordhaus, “Geography and Macroeconomics: New Data and New Findings,” Proceedings of the National Academy of Sciences of the United States of America 103 (2006): 3510–3517.
19
United Nations Development Programme, “Fighting Climate Change: Human Solidarity in a Divided World,” Human Development Report 2007/2008 (2008).
20
United Nations Development Programme, “Making New Technologies Work for Human Development,” Human Development Report 2001 (2001).
21
World Bank Group, “Governance Matters 2009: The World Governance Indicators Project,” (2009) <
22
World Bank Group, “Quick Query: Selected from World Development Indicators,” (2009) <
23
United Nations Development Programme, “Indicators—Human Development Report 2009,” (2009) <
24
World Bank Group, “Which Countries are Licus?” (2009) <
25
Dabelko, G.D., “Planning for Climate Change: the Security Community's Precautionary Principle,” Climatic Change 96 (2009): 13–21.
26
Gary Yohe et al., “A Synthetic Assessment of the Global Distribution of Vulnerability to Climate Change from the IPCC Perspective that Reflects Exposure and Adaptive Capacity,” (2006) <
27
Jouni Paavola, “Science and Social Justice in the Governance of Adaptation to Climate Change,” Environmental Politics 17 (2008): 644.