
Abstract
Abstract
Local industries are often a driving force for the local economy. Due to the inter-dependency between the local economy and the industry, environmental issues perceived by the residents are sometimes overlooked. The community-based participant environmental justice study reported here presents how different groups of stakeholders worked together to solve environmental concerns from the residents of Moncure, North Carolina. Town hall meetings were held to discuss environmental issues of the community with representatives from both the community and local industries. A study design was prepared by scientists from North Carolina Central University and the U.S. Environmental Protection Agency in order to provide independent scientific data on the air pollutants of interest to the residents. Two one-week-long samplings were conducted in January and August in 2007 to conduct a survey concerning the levels of air pollutants including volatile organic compounds (VOC) and aldehydes. During each sampling season, samples were collected for 24 hours each day for 7 consecutive days. Seasonal variability for both selected VOCs and aldehyde compounds of interest were observed. It was concluded that the levels of VOCs and aldehydes in the community were not above the levels of health concerns and lower than the values typically observed in other places in both the United States and other countries. During this study, the role of a community liaison was well perceived not only for his role in organizing the study but also in the facilitation of the field data collections. The community liaison maintained communication between the different research and community stakeholders.
Introduction
As part of a co-operative agreement with the U.S. Environmental Protection Agency (EPA), a community-based environmental justice (EJ) study named the Environmental Risk and Impact in Communities of Color (ERICC) was conducted during the years 2006 and 2007 to assess potential environmental exposures in localities like that of Moncure, North Carolina. The residents of this community believed that they had been impacted by environmental hazards associated with a number of local industrial enterprises including laminated wood production, a coal-fueled power plant, and brick manufacturing. This agreement also sought to develop the research infrastructure of the North Carolina Central University (NCCU) Environmental Science Program for long-term sustainability to better serve local communities. 7
Moncure is located in northern Chatham County, 25 miles southwest of Raleigh, the capital of North Carolina. The demographic composition of the community is not that of a typical EJ community, 8 as the percentage of minority residents is less than 50%, and the median income level of the residents is higher than that observed in typical EJ communities mainly due to the stable economy supported by the local industries.
The industrial facilities are located in a clustered pattern near the residential areas of Moncure and were presumed to be the major sources of air pollution impacting the community. Scorecard.org, an Internet resource that archives publicly available data collected by federal regulatory agencies, indicated historical emissions far above the national average levels for some hazardous air pollutants (HAPs) reportedly released from local industries during the late 1990s and early 2000s. 9 The ERICC study measured airborne concentrations and presents the spatial and seasonal distribution patterns of select volatile organic compounds (VOCs) and aldehydes during one-week long sampling periods in each of two seasons, summer and winter to investigate the community's concerns. This study shows how EJ concerns can be handled objectively by using scientific data in the presence of community support.
Study Methods
Selected criteria air pollutants (CAPs) and hazardous air pollutants (HAPs) were screened to assess the ambient levels in Moncure, NC. In this report, only the data from selected aldehydes and VOCs that local residents were most interested in are presented.
Community selection
The Moncure community was selected based on eleven criteria which were used to rank three communities on EJ concerns as shown in Table 1. Moncure was selected by following the calculated prioritization scores. A separate study was performed in the East Central Durham area and will be discussed elsewhere.
The criteria were selected by study committee members from the communities and participating institutions.
Community involvement
The Moncure community has a long history of engaging in pro-environmental activities. Town hall meetings were held with local residents and industry representatives to ensure that all in the community had a voice in the conceptualization of this study. During the initial town hall meetings, various types of pollution issues related to air and water quality were presented. The Southeast Chatham County Advisory Council (SCCAC) was an active voice for the community during the final stage of designing this study.
Among the sources of archived data used for developing the study design were: Scorecard, 9 EPA's Annual Toxics Release Inventory (TRI), 10 EPA's Risk Screening Environmental Indicators (RSEI) model, 11 and the Chatham County, North Carolina Public Health Department.
A list of pollutants and appropriate sampling methods were selected for screening-level assessment based on factors such as residents' concerns in the community, level of existing data, scientific expertise, available equipment for sampling, and available budget. Information about measurement parameters, equipment, and sampling methods are presented in Table 2.
Field sampling
Sampling location selection: Quadrant approach
Sampling locations were selected using a quadrant grid system based on multiple factors including: (1) distance from the prominent industrial cluster, (2) historical wind direction information, (3) accessibility to the sampling sites, (4) relative distance of the residential areas from the center of the quadrants, and (5) distance from major traffic roads. Historical data about wind direction for each season was collected from a commercial Web site (<
Neighborhood-based outdoor sampling was conducted at five different locations within the study area by using the front yards of four individual houses and a fire station at the center of the grid system as shown in Figure 1. Locations were selected on both sides of U.S. Highway 1 in order to cover most of the geographical area around the potential sources.
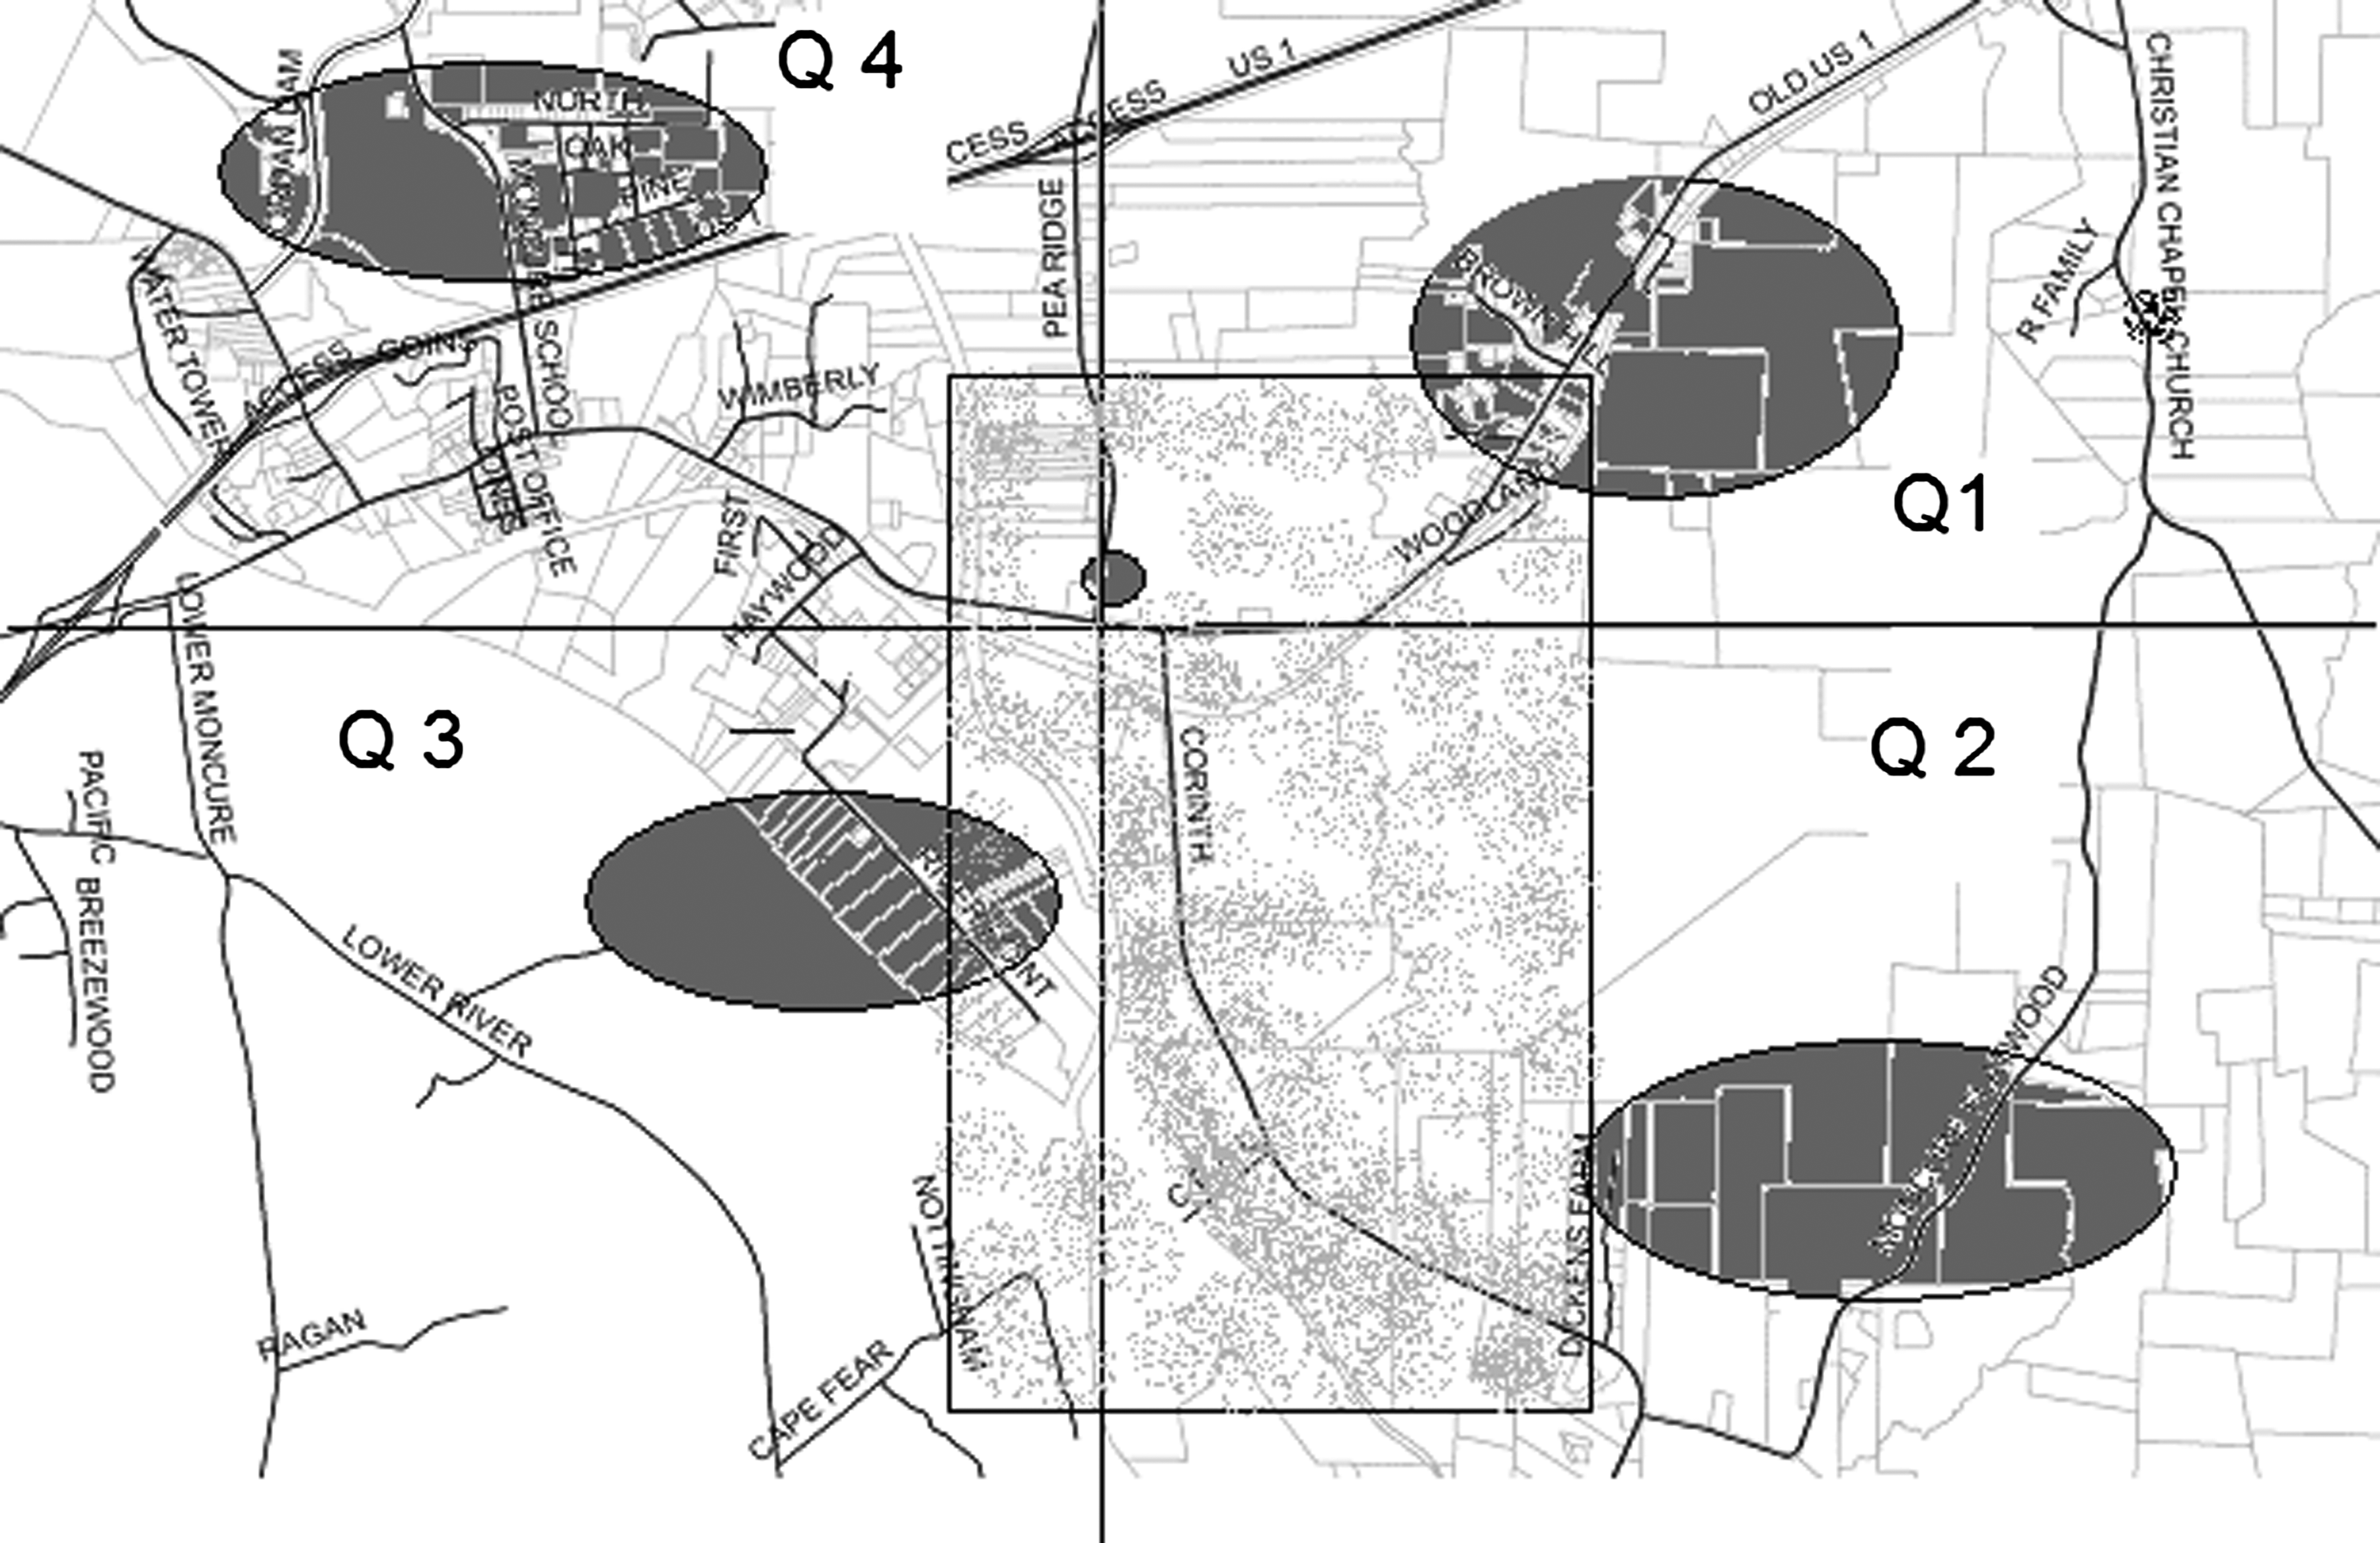
Four quadrant sections covering the Moncure community. Gray ovals indicate proximal areas where samplings were performed.
As shown in Figure 1, most residential houses (large shaded dots) are located along three major streets. Major industrial sites releasing air pollutants documented in the TRI database were located along a corridor bisecting the community presented in the inset rectangle area of Figure 1. The sampling area was divided into four quadrants using two imaginary lines. An effort was made to locate the four neighborhood satellite sampling stations equidistant from the center of the grid (fire station). In quadrant 3 (the southwest quadrant), a site in a clustered residential area within the same county was selected although the distance from the center was not equal to those from other sites due to the proximity from the county border. Figure 1 is an aerial photo geographic information system (GIS) map overlaid with geographical features. The large oval markers indicate the general area where the samplers were located. As a way to maintain confidentiality, the size of the oval marker was intentionally made big.
Target analytes
Each sampling unit held several air samplers: three passive samplers for SO2, NO/NO2/NOx, and ozone, a minimum of one active sampler for formaldehyde and acetaldehyde, and a minimum of one passive sampler for VOCs, all housed within an EPA-designed aluminum shelter for outdoor service (Figure 2). A mobile unit containing real-time measurement equipment was co-located at the fire station at the center of the grid. All sampling parameters and equipment used in the study are listed in Table 2. Only results for VOCs and aldehydes from the time-integrated monitors are reported here.
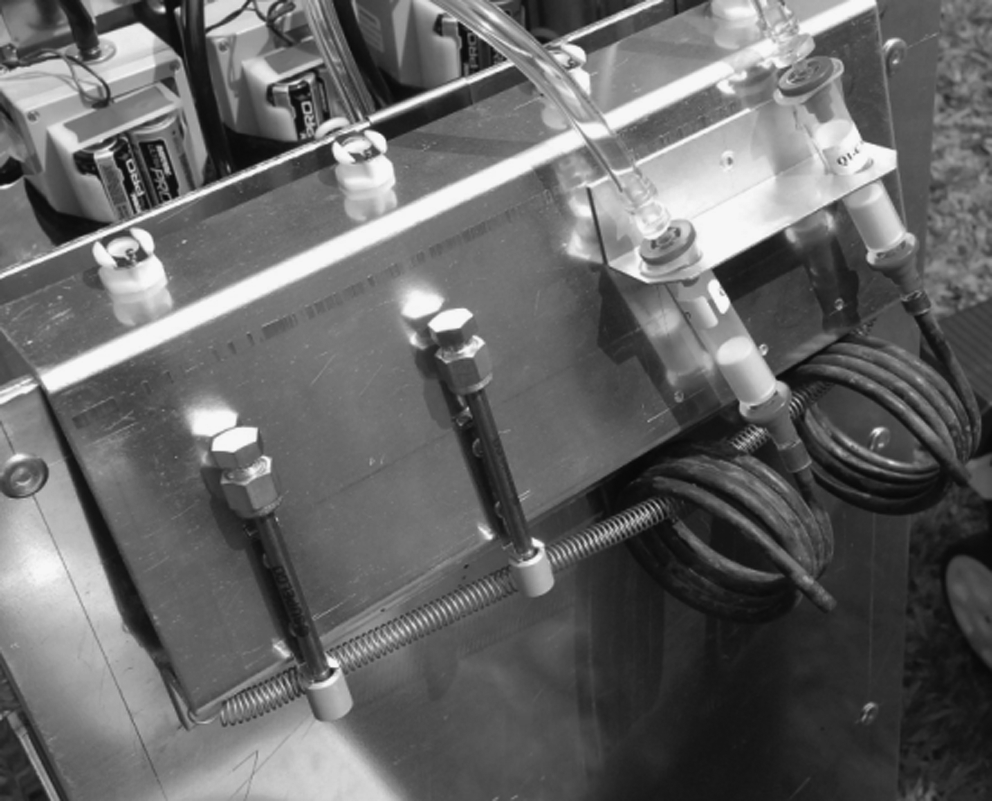
CarboPack-X passive samplers were used for VOC measurement and DNPH cartridges were used for aldehyde measurement inside the aluminum shelter.
Sampling duration
Sampling for all pollutants was conducted continuously over seven days in both winter and summer seasons. Each monitoring period represented a 24 +/− 2 hour integrated sample collection. Multiple field sampling teams were used to ensure all sampling events were being conducted simultaneously during the same time periods.
Sampling and analysis methods
VOCs
Passive diffusive samplers containing Carbopack-X (Supelco, Bellefonte, PA) were used to sample 25 VOCs including Benzene, Toluene, Ethylbenzene, and Xylenes during all seven days of the sampling period. Each device was recovered at the end of a 24-hour period and replaced with a new one for the next 24-hour sampling period. Collected samples were analyzed by GC/MS by the onsite EPA VOC laboratory (Alion Science and Technology). Detailed descriptions of these devices have been reported elsewhere.12, 13
Aldehydes
Compounds with carbonyl groups such as formaldehyde and acetaldehyde were collected using commercially available 2, 4-Dinitrophenylhydrazine (DNPH) coated cartridges (Waters Chromatography, Milford, MA) attached to calibrated air pumps (SKC Inc., Eighty-Four, PA) as recommended by EPA Compendium Method TO-11A. Ozone scrubber cartridges were used inline to minimize the effects of unwanted ozone reactions with the DNPH. At the end of each 24-hour cycle, used cartridges were collected for analysis at both the EPA laboratory and the NCCU Environmental Science Laboratory using Liquid Chromatography with UV-detection. New cartridges were inserted for the next 24-hour period. The same procedure was repeated for all seven days.
Quality assurance (QA) and quality control (QC)
The number of additional samples collected for quality control purposes (duplicates and field blanks) was determined by following an EPA-recommended protocol. All air sampling pumps were calibrated in the morning of the first sampling day and then again at the completion of each 24-hour sampling period. Special handling of passive VOC samplers to protect against handling artifacts was demonstrated to participating field technicians by EPA colleagues before sampling started. All samplers were kept in a cooler with blue ice before and after use.
Each sample collected was assigned a unique tracking number, using a combination of fifteen numbers and letters. A data collection sheet provided by EPA was used for each monitoring station for each day. A chain-of-custody sample tracking list was used as detailed in the study's Quality Assurance Project Plan.
Results
Method detection limits and EPA Reference Concentrations (RfC) for chronic inhalation exposures are presented in Table 3 for select VOCs (1,3-butadiene, benzene, carbon tetrachloride, toluene, and xylene) and aldehydes (formaldehyde and acetaldehyde). Daily measurements averaged over the one-week-long sampling periods for each quadrant are presented in Tables 4 through 7 and Figures 3 through 6 (see below). Observations below the detection limits were assigned a value of zero for calculation of the weekly averages.

WindRose data for evaluating Winter Day 1 VOC levels (with green triangles representing local industries).

One-week average VOC concentrations, winter season.
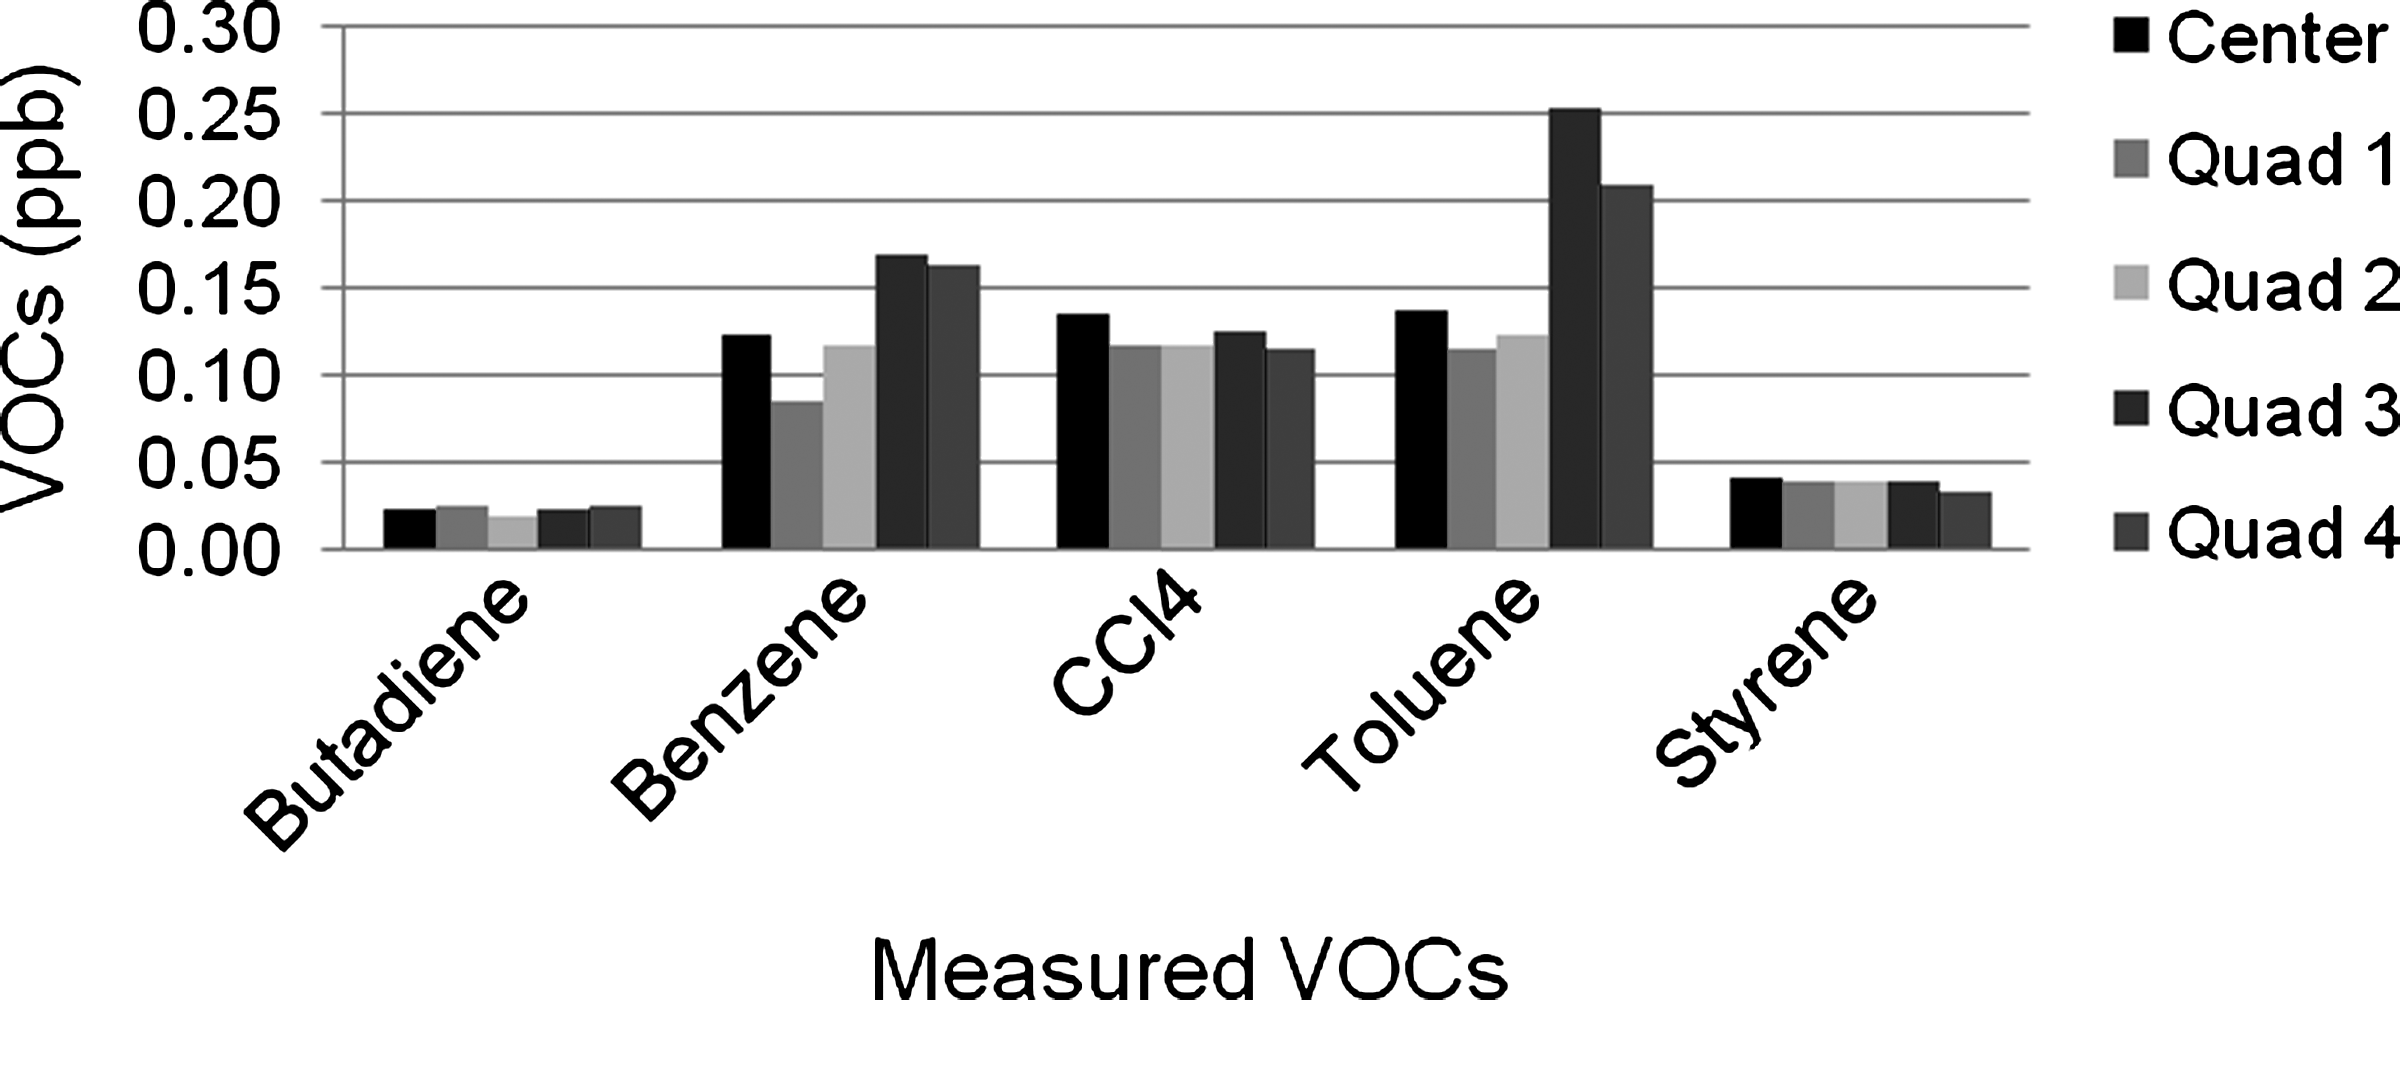
One-week average VOC concentrations, summer season.

One-week average aldehyde concentrations, winter season.
The RfC is an estimate of a continuous inhalation exposure to the human population (including sensitive subgroups) that is likely to be without an appreciable risk of deleterious effects during a lifetime. RfC from <http://www.epa.gov/iris>.
Volatile organic compounds (VOCs)
Winter season
WindRose plots during the week in the winter season indicated calm wind conditions, with wind speeds typically less than 4 mph. The wind conditions during day 1 are shown in Figure 3, illustrating the field meteorology conditions recorded using the portable weather station at the central site. Daily WindRose plots of wind direction and speed along with spatial pollutant concentrations by quadrant (not presented) were utilized to investigate the spatial variation in the observed concentrations. The weekly average VOC levels measured in winter (Figure 4) were low in each quadrant, typically under 0.4 ppb, with only toluene exceeding 1 ppb at the central monitoring station.
Summer season
WindRose plots for the summer season were not drawn due to an incomplete data set collected from the portable weather station and a period of multiple days with a stagnant (low wind speed) air mass as reported by the commercial weather source. The weekly average values of VOCs measured in each quadrant during the summer are presented in Figure 5. The overall levels of VOCs in all quadrants during the summer season were lower than those observed during the winter season for all compounds except styrene, which showed slightly higher levels at most of the sampling sites (e.g., benzene for winter and summer: 0.27 and 0.23 ppb, respectively).
Aldehydes (formaldehyde and acetaldehyde)
Winter season
Aldehyde concentrations measured during the one-week-long screening period is summarized in weekly average values illustrated in Figure 6. Daily WindRose plots (not presented but similar to Figure 3) for all 7 days during winter screening period were utilized for understanding the spatial variation of aldehydes in the same way as with the VOCs during winter, but the plots are not presented here.
Summer season
Figure 7 presents the weekly average aldehyde levels for each quadrant. The average values of formaldehyde observed during the summer season in all sites were higher than during winter while the values for acetaldehyde were the opposite. The seasonal variance for acedtaldehydes was statistically significant at P = 0.05 according to student t-test. The two-tailed p-values for formaldehyde and acetaldehyde (levels of winter and summer) were 4.637E-06 and 3.168E-02 respectively.
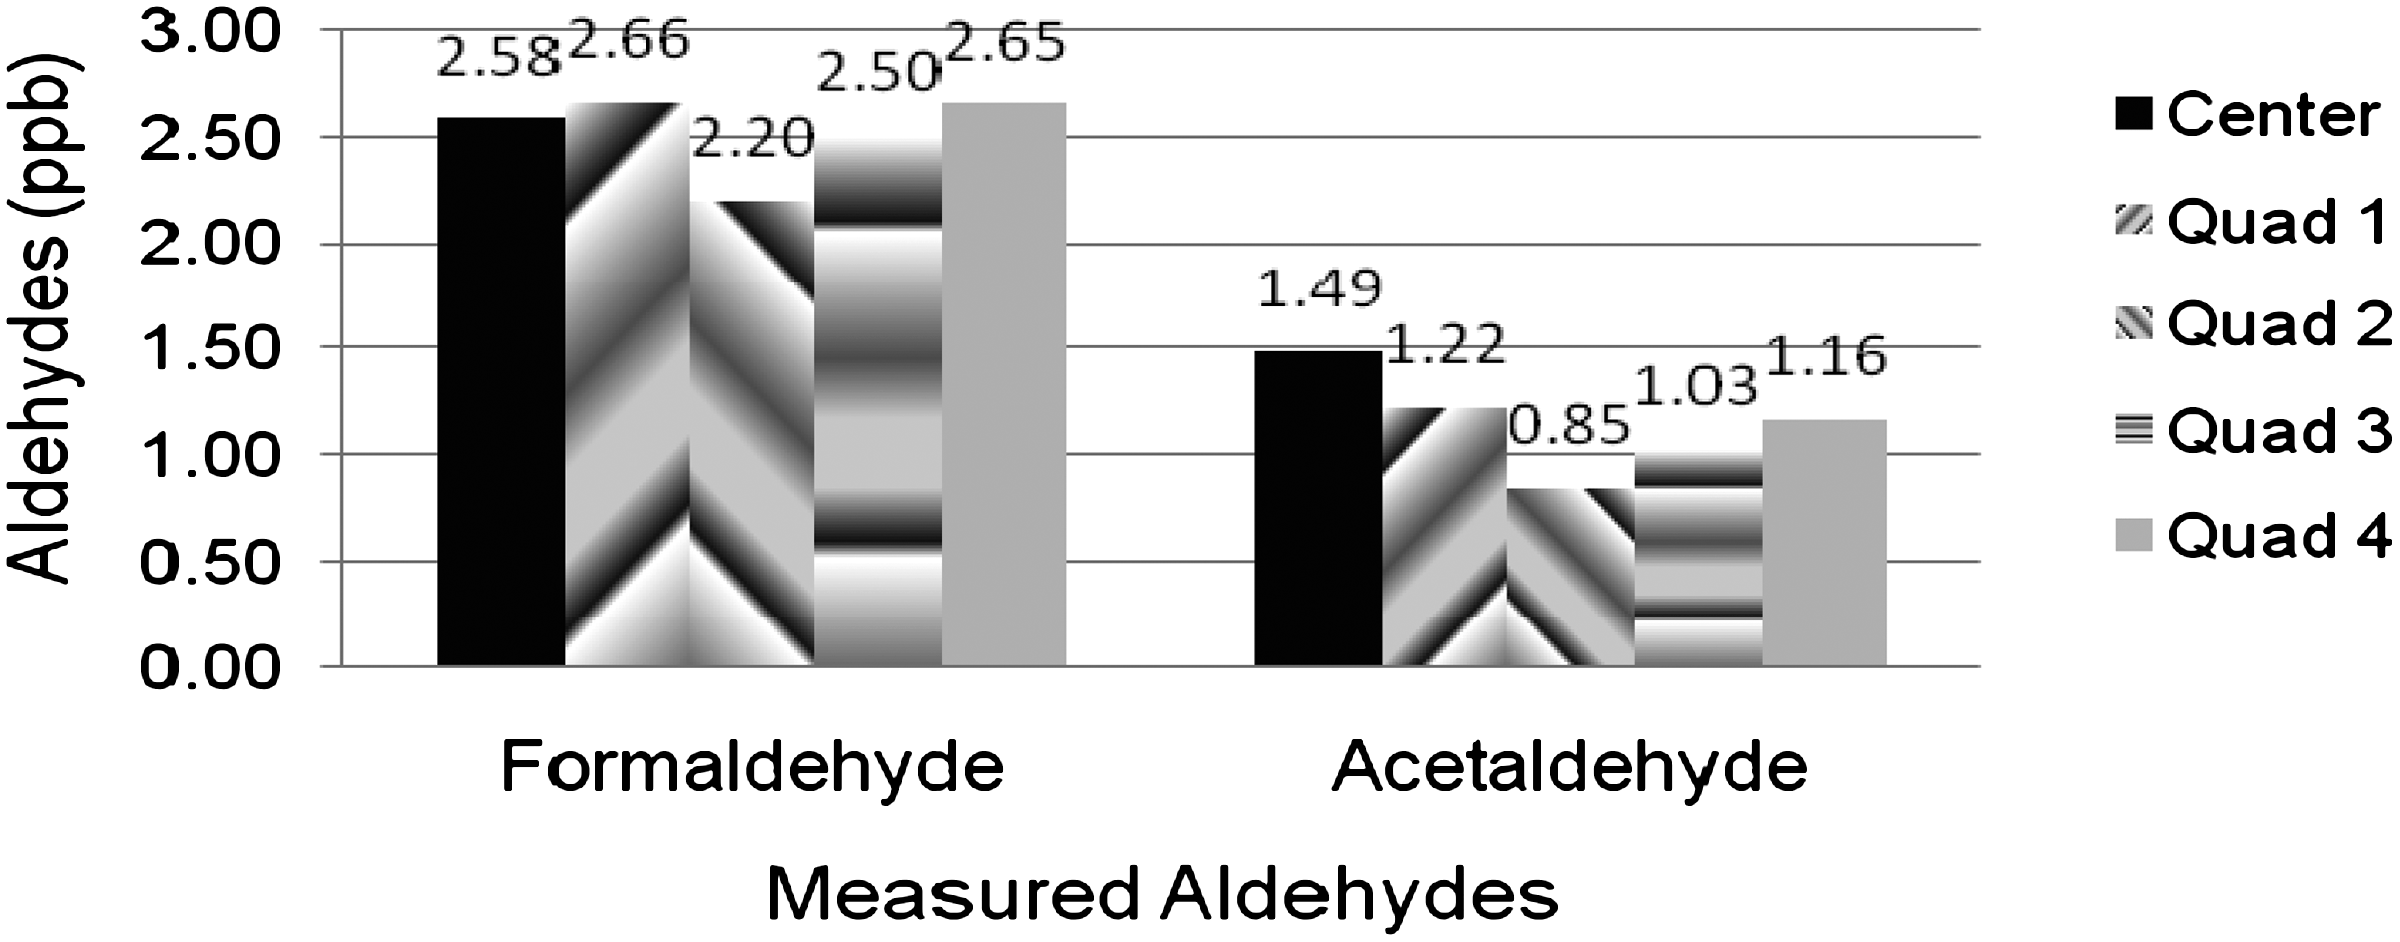
One-week average aldehyde concentrations, summer season.
Discussion
Local residents suspected high aldehyde levels to be present in the ambient air of the Moncure community in early 2000 based on reported emissions information. 9 This led to a growing health concern and the formation of community activity groups. The Southeast Chatham County Advisory Council (SCCAC) is one example of such a group that played a major role in presenting the voice of the community about this concern. To investigate the community's concerns in a nonbiased manner, the assistance of community liaisons was pursued in this study. Community liaisons with strong ties with the local community as well as local industry representative proved to be an invaluable tool for the successful completion of this study. In this study, the community liaison selected was a local resident who had lived in the community for several decades, had been well known to local residents both in minority and non-minority groups, had been working at one of the industries of the community's interest. He also worked as a communication facilitator among the three groups of residents, local industries, and scientists conducting the study.
Two years prior to this study, a local manufacturer of wood composite panels that was suspected of being a major source of aldehyde emissions announced that it had introduced a new engineering process as a way to reduce emissions. However, many residents still believed that they continued to be exposed to a high level of formaldehyde, with some claiming air pollution levels to be over 50 ppb. The growing concerns of the community could be seen as reasonable in the absence of any airborne chemical measurements.
This field screening study in two seasons representing extremes in meteorological conditions provided objective scientific data for use by both industry and community groups in the aforementioned concern. From the results observed in this study, the new engineering processes implemented by the wood panel manufacturer seemed to be effective for minimizing the level of aldehydes in ambient air (below 2.7 ppb for formaldehyde and 4.5 for acetaldehyde as shown in Figures 6 and 7). The results from this study also provided a reference point that can be used for air quality evaluation in the community in the coming years, with these data serving as a baseline levels for future comparisons.
The formaldehyde and acetaldehyde concentrations measured in the current study are lower than ambient air concentrations typically reported in urban settings and are similar to concentrations reported in rural settings around the world. Weisel et al. 14 reported outdoor air concentrations from three urban cities (Los Angeles CA, Houston TX, and Elizabeth NJ) with pooled means (+/- SD) of 17.6 (+/- 5.80) and 12.9 (+/- 10.3) for formaldehyde and acetaldehyde, respectively, from the Relationships of Indoor, Outdoor, and Personal Air (RIOPA) study (n = 395). Some historical formaldehyde levels in Schenectady, NY have reported a range between 1 and 31 ppb while the levels in the nearby mountains were between 0.8 and 2.6 ppb during the summer. 15 In semi-rural settings in Denmark, the average concentrations observed were 1.2 ppb for formaldehyde and 0.8 ppb for acetaldehyde. 16 A ten-year long outdoor exposure monitoring study conducted in six provinces of Canada between 1989 and 1998 showed a similar range of representative values. 17 The formaldehyde concentrations ranged from below the detection limit (0.042 ppb) to a maxima of 27.5 ppb for eight urban sites, 12.0 ppb for two suburban sites, and 9.9 ppb for six rural sites. In urban settings in the United States, the levels of carbonyl compounds were often higher than the levels of other organic compounds, suggesting that motor vehicles and photochemical reactions strongly influence the levels of carbonyl compounds. 18
VOC concentrations at Moncure were, for the most part, also lower than those observed in urban areas in United States. For both winter and summer seasons, the levels of benzene, toluene, and styrene observed in Moncure were lower than the values reported for the three cities of the RIOPA study (pooled averages 0.67, 1.88, and 0.11ppb for benzene, toluene, and styrene respectively). 14 The levels of carbon tetrachloride in Moncure, however, registered higher than those observed in the urban areas (i.e., greater than 0.11 ppb in both seasons). When the VOC levels in Moncure are compared with those at different places around the world, the benzene levels in urban settings including those near gas stations were at least an order of magnitude higher, starting from about 10 ppb, and displayed larger variability. In rural settings the reported concentrations are rarely higher than 1 ppb and display far less variability.19–22
Both the VOCs and the aldehydes showed some seasonal variation in this study, with levels of VOCs (except styrene) and acetaldehyde typically lower in the summer, and levels of formaldehyde typically lower in the winter. Spatial variation, however, were neither distinctive nor consistent across the sampling sites. The effects of wind speed and directions on the daily concentrations at the five sampling sites were investigated visually (for example, Figure 3) in an attempt to identify sources; however, evidence of the industrial corridor as the source of the air contaminants was not convincing.
This study measured relatively unexceptional levels of formaldehyde, acetaldehyde, benzene, toluene, styrene, 1,3-butadiene, and carbon tetrachloride. These results should not be taken to suggest that the air quality claims of the community members are not legitimate, but the results provide compelling evidence that for the time period involved and for the pollutants monitored, concentrations at low environmental levels were observed. The availability of more refined tools for use by communities in assessing and evaluating potential environmental health stressors would be useful, and the development of these tools should be a priority in the environmental justice scientific community.
Conclusions
For an environmental justice project like ERICC, where multiple parties with various backgrounds take part, the presence of a community liaison through which the voices from the community and industries can be communicated with scientists and engineers seemed to be very helpful for the successful completion of the study.
The levels of aldehydes and selected VOCs monitored during the two seasons for one-week-long periods in the community of Moncure, North Carolina in 2007 clearly show that the ambient levels were below EPA reference concentrations for chronic inhalation exposure. The monitored levels of those chemicals in other urban and rural places in both U.S. and other countries support the conclusion of this study. Seasonal variance between summer and winter were apparent in terms of concentrations of aldhydes and VOCs in ambient air although spatial variance was not distinctive.
Footnotes
Acknowledgments
The U.S. Environmental Protection Agency through its Office of Research and Development partially funded and collaborated in the research described here under EPA Cooperative Agreement No. R-82946901 to North Carolina Central University. It has been subjected to the Agency’s review and has been approved for publication. Authors appreciate all participants including the students from the DEEGS (Jerray Battle, Lauren Lawrence, Algernon Finley, Peter Muriuki), Ms. Faustina Meheux for lab support, Mr. Louis B. DeLaine for WindRose preparation, and other resident volunteers from Moncure who made these field sampling procedures possible. Authors also appreciate the local volunteers working at Moncure fire station for their generous support field sampling for both winter and summer seasons in 2007.
Author Disclosure Statement
Drs. Bang, Anderson, DeLauder, Malhotra, and Egeghy and Mr. Williams, Mr. Whitaker, and Ms. Morrison have no conflicts of interest or financial ties to disclose.
Dr. Bang is an associate professor in the Department of Environmental, Earth, and Geospatial Sciences at North Carolina Central University (NCCU) in Durham, NC. Dr. Anderson is Chair of the Department of Environmental, Earth and Geospatial Sciences and interim dean of the College of Sciences and Technology at NCCU. Dr. DeLauder is interim dean of the School of Graduate Studies at NCCU. Dr. Malhotra is an assistant professor in the Department of Government History at Fayetteville State University, AR. Dr. Egeghy is an environmental health scientist at the National Exposure Research Laboratory in Research Triangle Park, NC. Mr. Williams is a research physical scientist at the National Exposure Research Laboratory. Mr. Whitaker is a research chemist at the National Exposure Research Laboratory. Ms. Morrison is in the Department of Soil, Water, and Environmental Sciences at the University of Arizona in Tuscon, AZ.
Although this work was reviewed by the EPA and approved for publication, it does not necessarily reflect official Agency policy.