
Abstract
Abstract
This study examines the proximity to neighborhood public open spaces (NPOS) across different socio-economic areas in metropolitan Tehran. Three proximity variables included access to, number of, and total area of NPOS, which were measured using geographic information systems in a large geographical area. Area-level socio-economic status (SES) was measured by considering income, education, and employment at the scale of census zones and categorized into quintiles. The results show that there are significant differences (without clear pattern) in access to and number of NPOS among SES quintiles in Tehran; however, there was no significant difference in total areas of NPOS across SES quintiles.
Introduction
While the reason for differences between physical activities by people living in different SESs is mainly unexplored, 11 various characteristics of the built environment within these areas may be one of the causes. The correlation between different aspects of the built environment such as access to facilities, residential density, land-use mix, neighborhood aesthetics, street connectivity, and physical activity has been documented during the past decade, especially in public health literature.12–20
Neighborhood public open space (NPOS) such as a park or playground not only provides a place where people can be engaged in physical activity like walking, but also they are interesting destinations which can persuade people to walk to reach them. Therefore, they are considered as a potential setting to influence physical activity in neighborhoods.
However, there are few studies which analyze NPOSs within areas of varying SES. Timperio et al., 11 in their study carried out in the context of an Australian city (Melbourne), found out that there are no differences in the availability of public open spaces (merely in terms of quantity not quality) across neighborhoods with different SESs. Their study does not support the general expectation that low SES neighborhoods have less public open space than high SES ones. Crawford et al., 21 in another study in the same area as the former study, analyzed the qualities of public open space according to neighborhood SES. The results show that public open spaces in high SES neighborhoods have more amenities in comparison with low SES neighborhoods; however, there is no difference in number of playgrounds and recreation facilities.
The present study would be one of the first attempts to examine the neighborhood public open space, typically parks, across different SES areas in an unexplored context like Tehran in a developing country. This study addresses these questions:
- Are there any significant differences in three proximity variables of NPOS across area- level SES quintiles in metropolitan Tehran? - If there are, between which SES quintiles?
Methodology
Study area
The present study was carried out in metropolitan Tehran, one of the larger capital cities in the Middle East, with a total population of 7,797,520. 22 It is located on the southern slopes of the Alborz mountains and the city includes an area more than 600 km2. 23 Cities in developing countries exhibit considerable diversity according to their built environment and socio-economic structures. Also cities in developing countries vary considerably according to their place in the urban hierarchy within their own countries. 24 Tehran, as a large city in Iran, shows many features of cities in developing counties. The city has a high density of population and a concentration of economic and administration infrastructure. The average density of Tehran in the built-up areas is 146 people per hectare which can be categorized as a dense city according to world standards. 25 Tehran is comprised of 22 administrative regions and 371 neighborhoods.
Measures
Area level socio-economic status
Census zones were used to define geographical units to capture area-level SES data. There were 3,173 census zones across metropolitan Tehran with a mean area of 22.3 ha and a mean population of 2,125.
As there was no previous SES index for this case study, we had to develop a simple one. According to the available data on the census zones scale, three variables of area-level SES were chosen in this study: employment, literacy, and income. A review of economic literature shows that income is a function of employment and literacy, but this matter should be regarded with reference to the special conditions of developing countries. According to the Statistical Centre of Iran (2006) the number of higher educated people waiting for jobs is greater than that of illiterate or less educated persons. This is due to the fact that the educated people seek higher salaried or paid jobs while the illiterate or less educated can easily find jobs in the less-well-paid informal sector. So the interdependence of variables like literacy and employment should be considered along with the economic characteristics of developing countries. 26
The data related to these variables were obtained from the census zones database provided by the Statistical Centre of Iran (2006). We standardized all the variables and summed them up into one SES score. Then, all census zones were assigned into SES quintiles. Table 1 shows the characteristics of these SES quintiles.
Proximity of NPOS
NPOS in this study refers to all public parks with a minimum area of 300 square meters which are all freely accessible to all people. Three selected proximity variables of NPOS were measured as follows:
Access to NPOS
To measure the objective access (on a street basis) to the nearest NPOS, geometric census zone centroids were considered as origin points and geometric centroids of parks parcels provided by Municipality of Tehran 2006 were defined as destination points. We applied network distance rather than Euclidian, as the former is more accurate. 27 A road map of Tehran provided by Municipality of Tehran 2006 and ArcGis9.3 network extension was used to calculate the distance between each origin point and a nearest destination point.
The number of NPOS
The number of NPOS in each census zone was counted by using ArcGis9.3. Then, to take into account the population factor, the number of NPOS was calculated per 1,000 population for each census zone.
The total area of NPOS
The total area of NPOS in each census zone per 1,000 population was calculated.
Statistical Analysis
Differences in the three proximity variables of NPOS (access to, number of, and total area of NPOS) were analyzed across SES quintiles using one-way analysis of variance and post hoc comparison analysis. All statistical analysis was done by using SPSS-PC for Windows 17.
Results
About 34% of total population were in the two higher SES quintiles (4, 5), while two lower SES quintiles (1, 2) had about 46% of the total population. The area of quintile 1 and quintile 2 is about 41% of total area and also the area of quintile 4 and quintile 5 is about 41%, too. (See Fig. 1.)
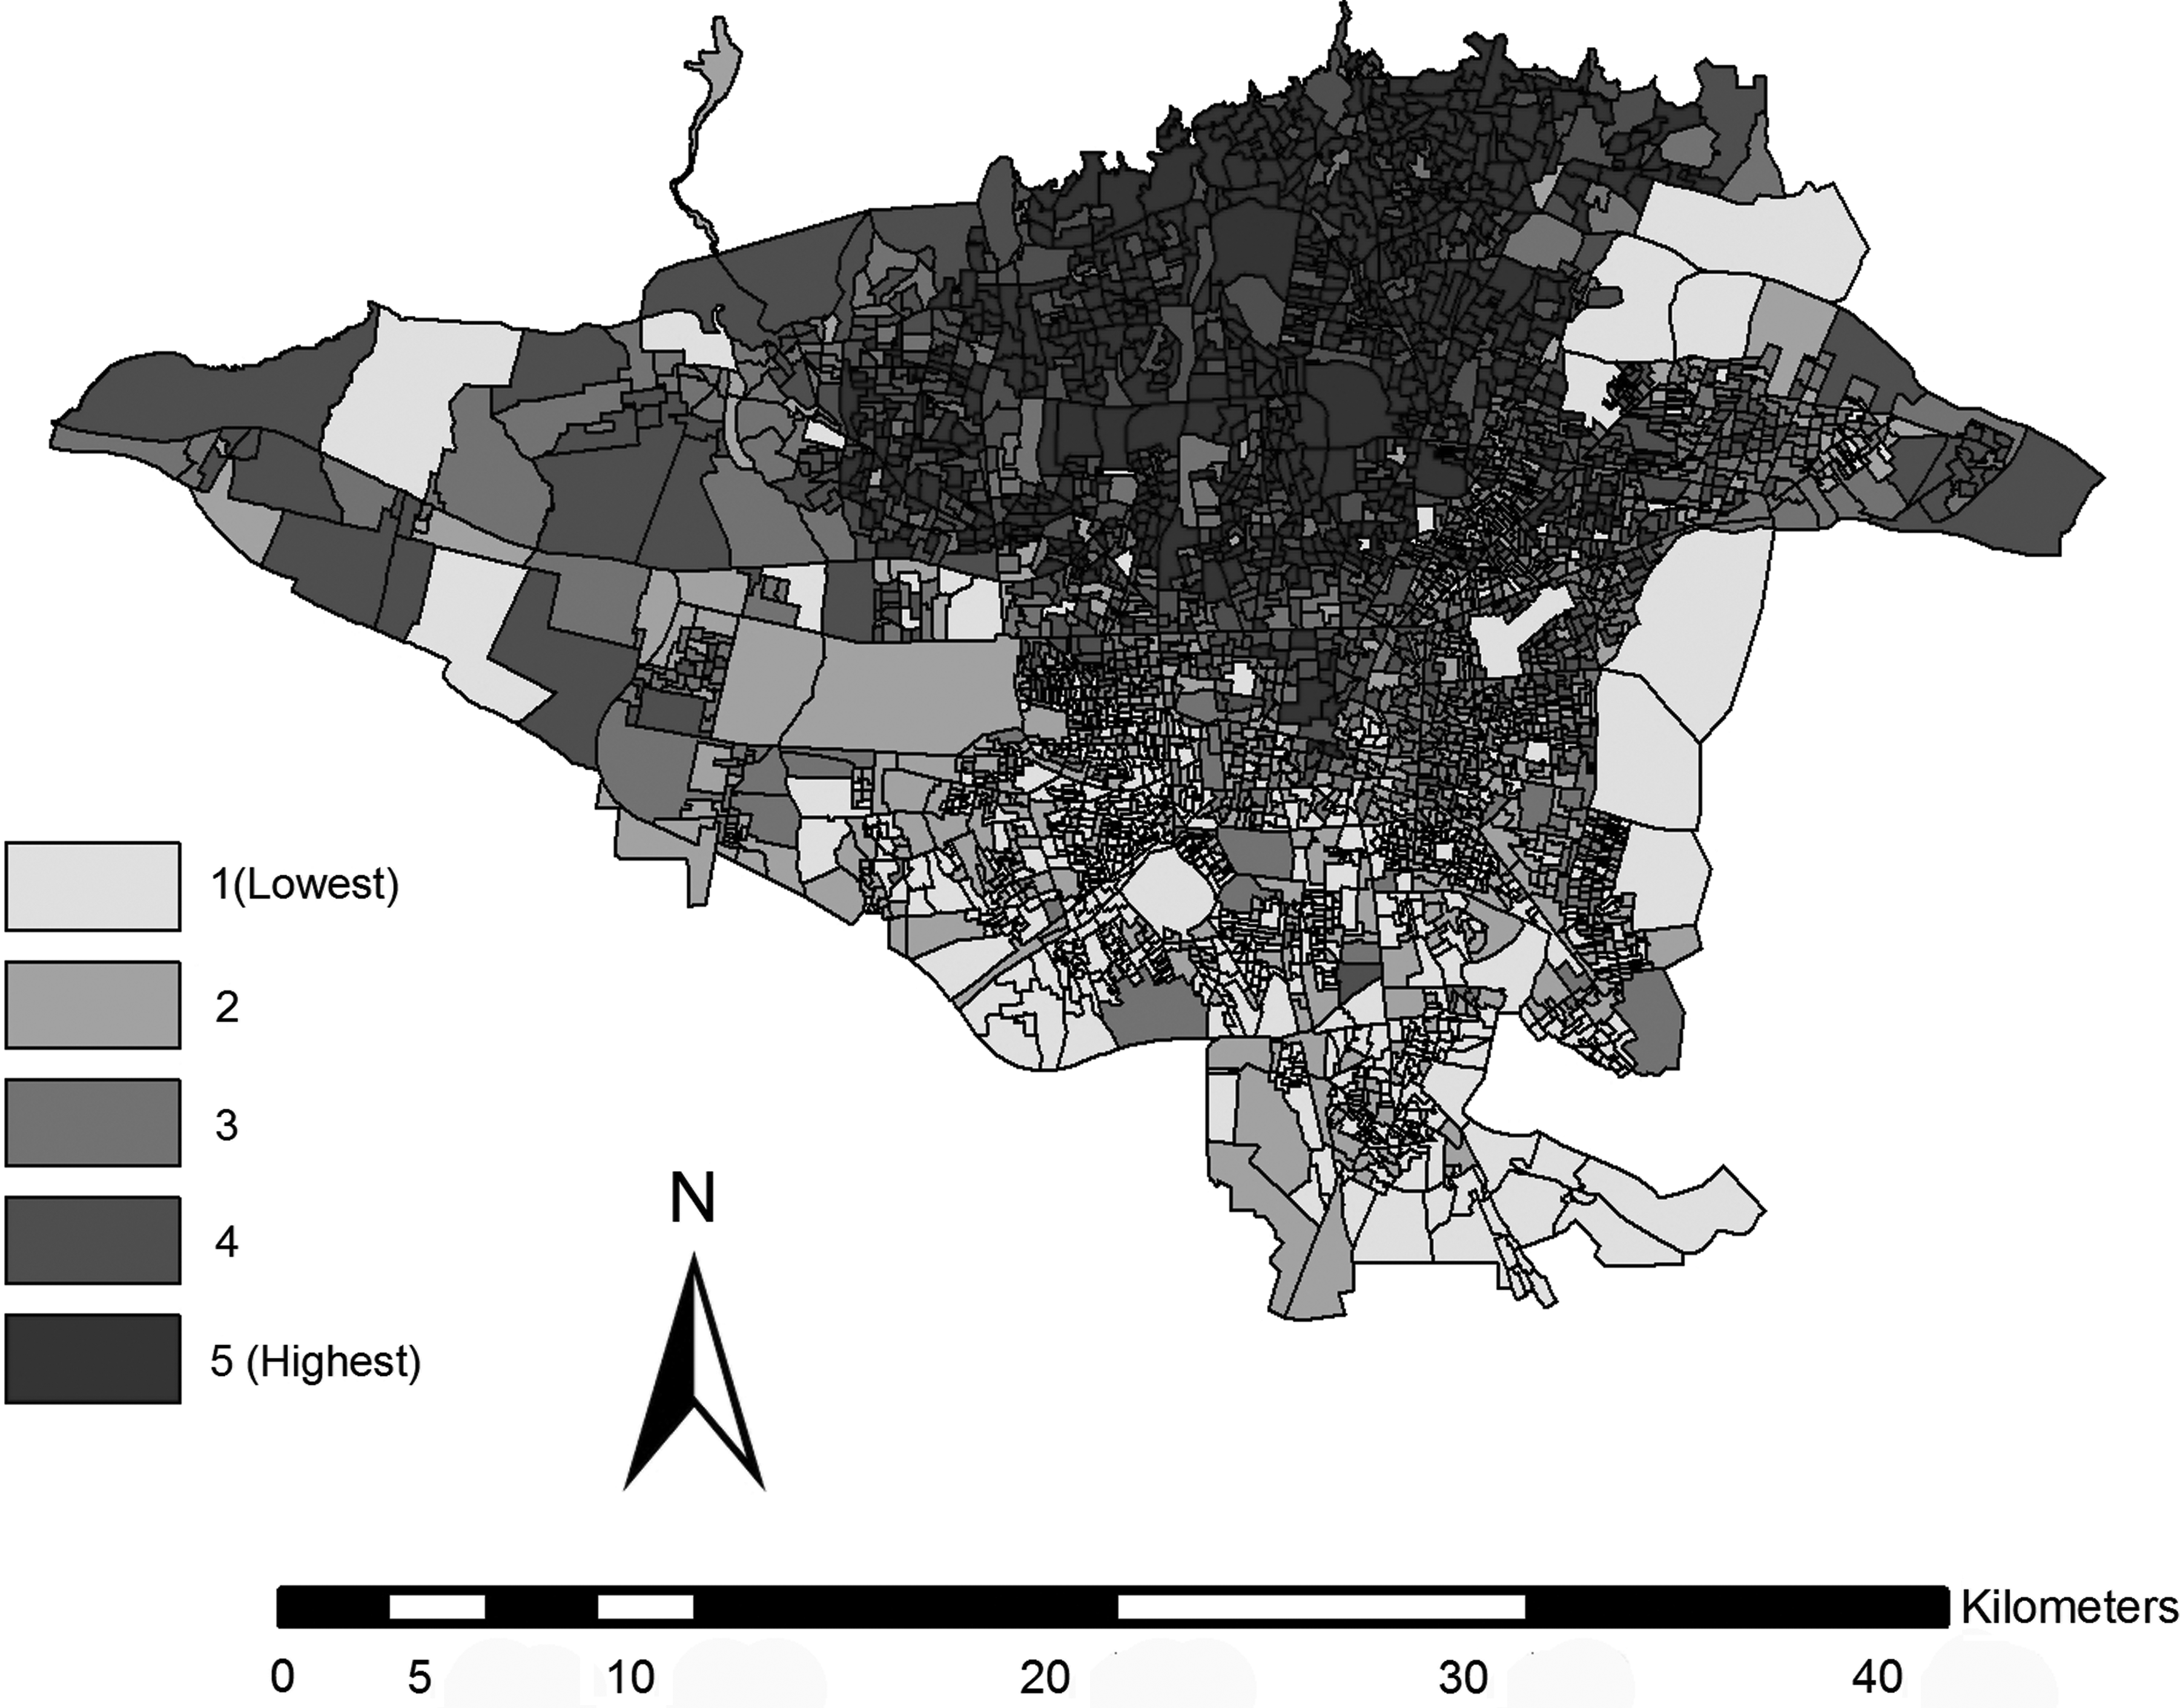
SES quintiles across Metropolitan Tehran.
The one-way analysis of variance (ANOVA) summary and its post hoc comparison of proximity variables of NPOS across different SES quintiles is presented in Table 2. (See Fig. 2.)
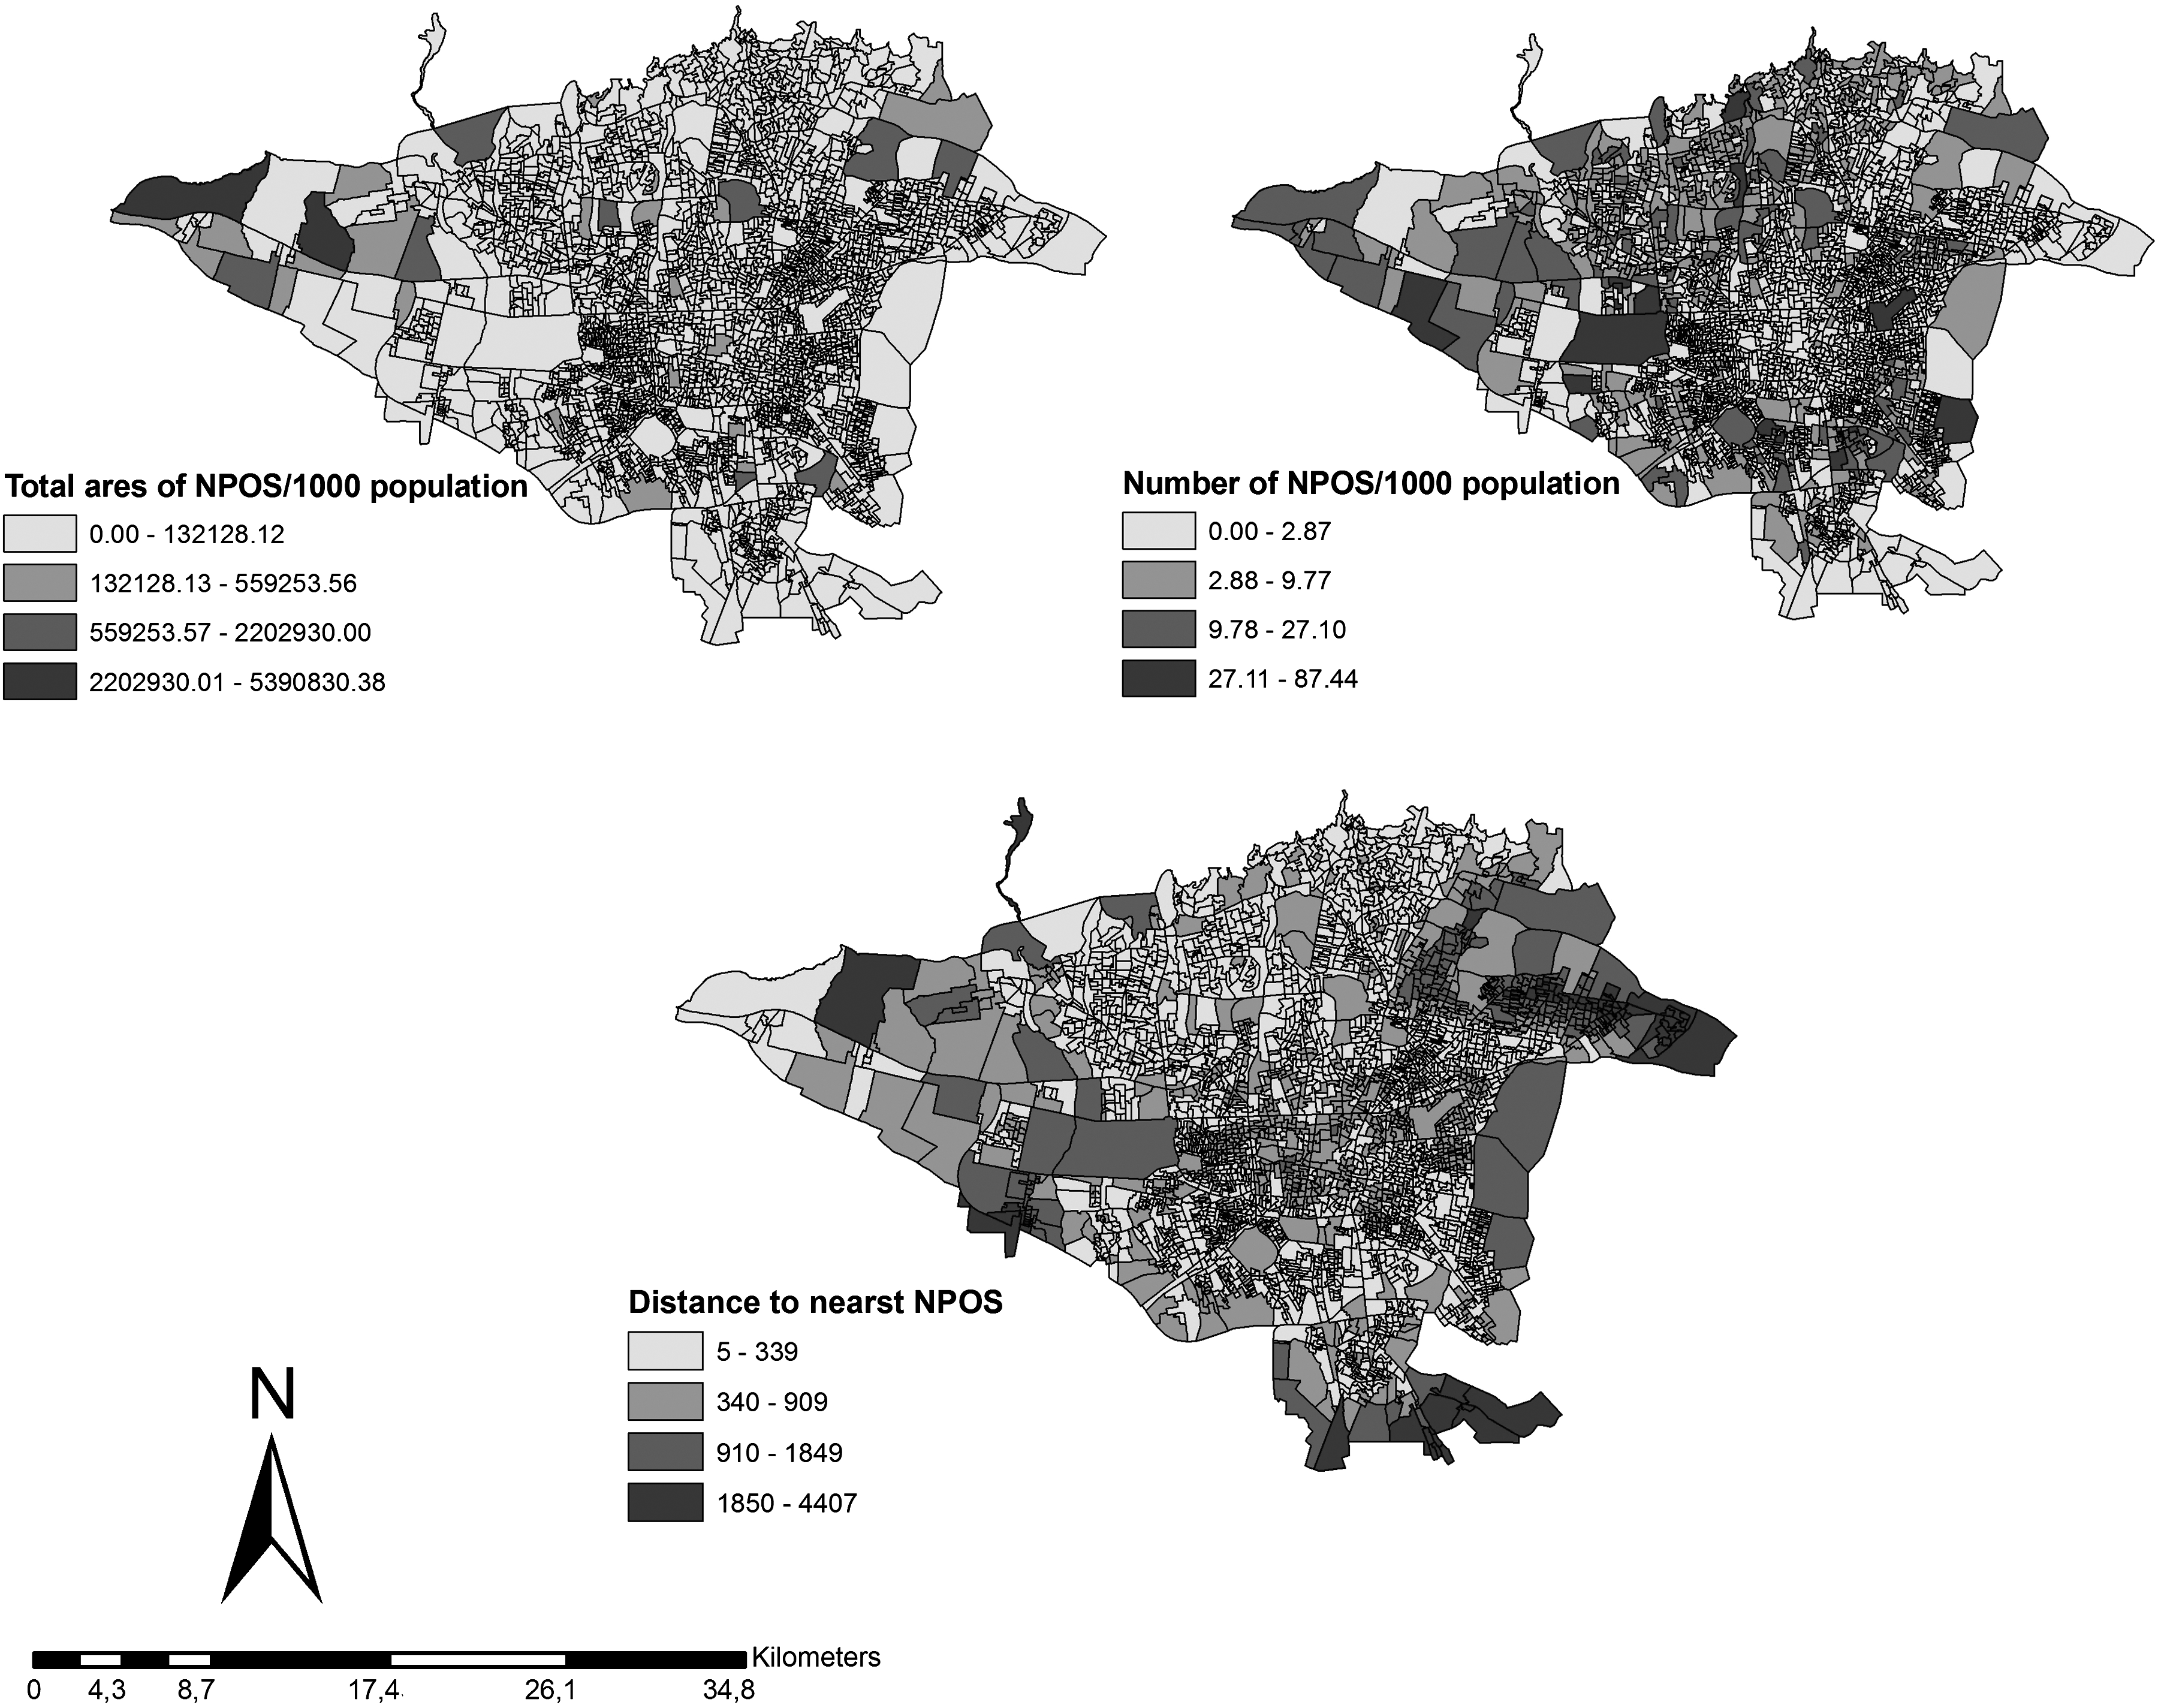
Proximity variables of NPOS across census zones.
Significant trend ρ ≤ 0.01.
Significant differences between quintile 5 and others, and between quintile 4 and quintile 1, and between quintile 3 and two quintiles 1, 2 (Tukey post hoc tests, p ≤ 0.05).
Significant differences between quintile 5 and quintile 3, and between quintile 3 and quintile 1 (Tukey post hoc tests, p ≤ 0.05).
There were significant differences in access to NPOS and also number of NPOS per 1,000 population between SES quintiles. There was, however, no significant difference in total areas of NPOS per 1,000 population across SES quintiles. Also, the highest SES (quintile 5) had the best access to NPOS and the highest number of NPOS per 1,000 population among all SES quintiles. Furthermore, although there was a significant difference in number of NPOS per 1,000 population across SES quintiles, there wasn't a significant difference between highest and lowest SES areas.
Discussion and Conclusion
This study is one of the first attempts to examine the proximity of NPOS across SES areas of metropolitan Tehran in the context of a developing country. This study shows that various variables of proximity to NPOS can differ across SES quintiles. In the case of Tehran, while there were significant differences (however, without clear patterns) in access to and number of NPOS across SES quintiles, the area of NPOS was distributed without significant difference.
Interestingly, the highest SES area and the lowest one were nearly at the same level related to the number of NPOS. Also, the lowest SES had the second best access to NPOS among all areas. This is irreconcilable with the general hypothesis that people who live in low SES areas have poor access to public open space. In the case of Tehran, the differences between proximity variables of NPOS across SES quintiles occurred without clear patterns.
Accordingly, proximity to NPOS may not be a good predictor of disparities in physical activity across different area-level SES in Tehran (consistent with the Timperio et al. 11 related to the availability of POS). Since area-level SES may not explain all characteristics of NPOS and the various aspects of NPOS may differ across SES areas. The results related to this issue are inconclusive according to different contexts. It is worthwhile for policymakers to consider the context in which they want to develop strategies prompting physical activity.
This study has several limitations. Subjective measures of proximity to NPOS like perception of access were not included in this study. It is possible that these measures are different across SES. Future studies should consider both objective and subjective measures to obtain a more comprehensive result. Also, all public parks with an area more than 300 meters were considered as NPOS, but their quality, such as park features, was not included in the study. Previous studies showed that attractiveness of parks, like presence of walking paths, water features, and lighting, can influence physical activity. 28 It is likely that the quality of resources is more important than their objective distribution. 29 Future studies can analyze whether quality of NPOS vary across SES areas in a city like Tehran.
Furthermore, this study focused on parks as NPOS while the definition of NPOS contains a wide range of spaces such as plazas and streets. It is worthwhile to add other spaces as NPOS and compare them through SES areas.
Footnotes
Acknowledgment
The authors would like to thank the anonymous reviewers for their valuable comments.
Author Disclosure Statement
The authors disclosed no competing interests.