
Abstract
Abstract
Environmental justice (EJ) indicators, including a number of parameters ranging from pollutant concentrations to socio-economic status, were compiled for three case study locations that have a documented history of EJ issues. Instead of consolidating the 14 EJ indicators into a single metric, they are displayed separately to facilitate comparisons at four different spatial scales to allow characterization of local, city, county, and state environmental conditions. This methodology provides a broader assessment of EJ, conveyed more as a neighborhood story than as an associative relationship. Information and measurements for these EJ indicators were downloaded from national and local sources of publicly available, Web-based information. There are different motivations for conducting EJ assessments, but this approach provides an overview of the conditions for a given community so that a range of options can be considered to inform and support the EJ decision-making process.
Introduction
A basic tenet of EJ is that environmental burdens should not be borne disproportionately by any segment of the population, regardless of race, class, income, or geographic location. A key goal of EJ efforts is to achieve an equitable spatial distribution of environmental burdens and amenities, 3 as well as the meaningful involvement of all people in any process where environmental conditions and public health are at stake. 4
The term “disproportionate” means that the magnitude of health and environmental impacts is greater for a given community or population as compared to a reference counterpart, such as a comparable community or the area surrounding the target community. Two prominent challenges in assessing EJ issues are to evaluate the magnitude of the disproportionality 5 and to develop consensus on providing a methodology to determine whether impacts are disproportionately high.
Methods to quantify disproportionate impacts often reflect one or more of the following three philosophical lines of reasoning. One perspective is that environmental conditions have little or no effect on the health of a population, and that individual behavior, such as drinking and smoking, is the most likely contributor to adverse health effects. A second viewpoint suggests that environmental conditions affect all people equally, independent of race or class. This implies that chemical concentrations and personal exposures are the only determinants of disproportionality. The third perspective suggests that socio-economic factors such as race and income play the primary role in determining exposure to adverse conditions and the ability to cope with them, thus resulting in disproportionate impacts.6
Quantifying disproportionate impacts is challenging and has taken several forms, including calculating the proximity to and spatial density of pollution sources,7–9 to comparing estimates of cancer risk,10–12 to developing metrics compiled from disease incidence, environmental conditions, and socio-economic vulnerability factors.13,14
While single-parameter assessments or compiled metrics are a valuable tool to identify potentially impacted people or areas, the broader assessment of potential or actual disproportionate impacts within a community relies on a number of factors, from media-specific chemical concentrations to vulnerability factors, but the combination of information that pertains to a given community is often unique and specific to that community's local conditions, which includes community alliances and organizational outlook toward environmental projects. Another goal of this research is to assess to what extent this type of information is publicly available, and in what formats, building on work from Barzyk et al., on an overview of tools for cumulative assessments.15
EJ assessments based on cumulative exposure principles are focused on compiling a broad range of information about the community, including detailed comparative information on the community's population, the history of its development and pollution sources, its current status, and considerations of future impacts. Given this approach, a cumulative exposure assessment is intended to capture all stressors—past, present and future—that impact health while telling a story, a neighborhood story. It seeks to document all factors contributing to disproportionate impacts, ranging from the history of major polluting sources through time, to potential implications of socio-economic conditions, to future impacts.16
This work presents an approach for assessing disproportionality within a cumulative exposure assessment framework. Cumulative assessments include multi-media, and multi-pollutant exposures, from air and soil contamination, as well as vulnerability factors, including age and poverty status.17,18 Information from these cumulative assessments can be useful to researchers, community members, and policymakers because they provide a range of factors that may contribute to adverse health impacts.
Methods and Data
Guidance document
The Toolkit for Assessing Potential Allegations of Environmental Injustice, hereafter referred to as the Toolkit, provides a systematic approach in applying EJ Indicators, to assess potential or established situations of environmental injustice, and in resolving and responding to the situation. The Toolkit's systematic approach is intended to promote a common understanding of the issues and to provide flexibility in its application. The Toolkit acknowledges that each situation may require a different approach on whether to use it, how to use the tools and indicators, and the totality of circumstances that should be considered when evaluating an EJ concern. Because of the comprehensive range of considerations and the importance of local factors, including community-specific vulnerabilities, this type of EJ assessment must be performed on a case-by-case basis.2
The Toolkit recommends a four-phase assessment: 1) Problem Formulation; 2) Data Collection; 3) Assessment of Potential for “Adverse” Environmental and Human Health Effects or Impacts; and 4) Assessment of Potential for “Disproportionately High and Adverse” Effects or Impacts. The four phases are incorporated into a two-tiered approach: “Tier One (1): Screening-Level Assessment” and, “Tier Two (2): Refined Assessment.” The first tier recommends a more qualitative assessment of available information (e.g., a walk-through of the neighborhood) to determine whether a more refined, quantitative assessment is warranted and if the assessment requires EPA assistance or guidance. Results from Tier 1 would be used to define the Phase 1, Problem Formulation step, of a Tier 2 assessment. In this analysis, all case studies met the Tier 1 criteria to perform a more refined risk assessment, therefore the focus is on presenting and analyzing publically available quantitative information from national and local data sources, referred to as EJ Indicators.
EJ Indicators
Indicators are quantifiable information that highlight conditions or trends in the environment, community, or geographic area. Not all indicators can be cross-compared. Measurement units, spatial or temporal resolutions, and other considerations can prohibit a direct comparison. The 2008 EPA Report on the Environment states that indicators “can only partially answer key questions.”19 However, regardless of their inter-comparability, indicators still must pass a set of selection and quality criteria before they can be used to assess current conditions or trends.
The EJ Indicators listed in the Toolkit are categorized into four broad areas: environmental, health, social, and economic. The EPA Office of Environmental Justice ensured that the indicators met as many of the following selection criteria as possible: policy relevance, analytical soundness, and measurability.2 EJ Indicator categories, types, and examples are listed in the appendix; the Toolkit includes suggested publicly available data sources for each indicator.
Environmental indicators presented here include information from the Toxic Release Inventory (TRI) and National Emissions Inventory (NEI). Air quality monitor locations are also displayed in Figure 1. The corresponding air quality monitor measurements of criteria and hazardous air pollutants are available from the EPA through the Air Quality System (AQS) available on the Internet (Criteria Air Pollutants [CAPs]: <
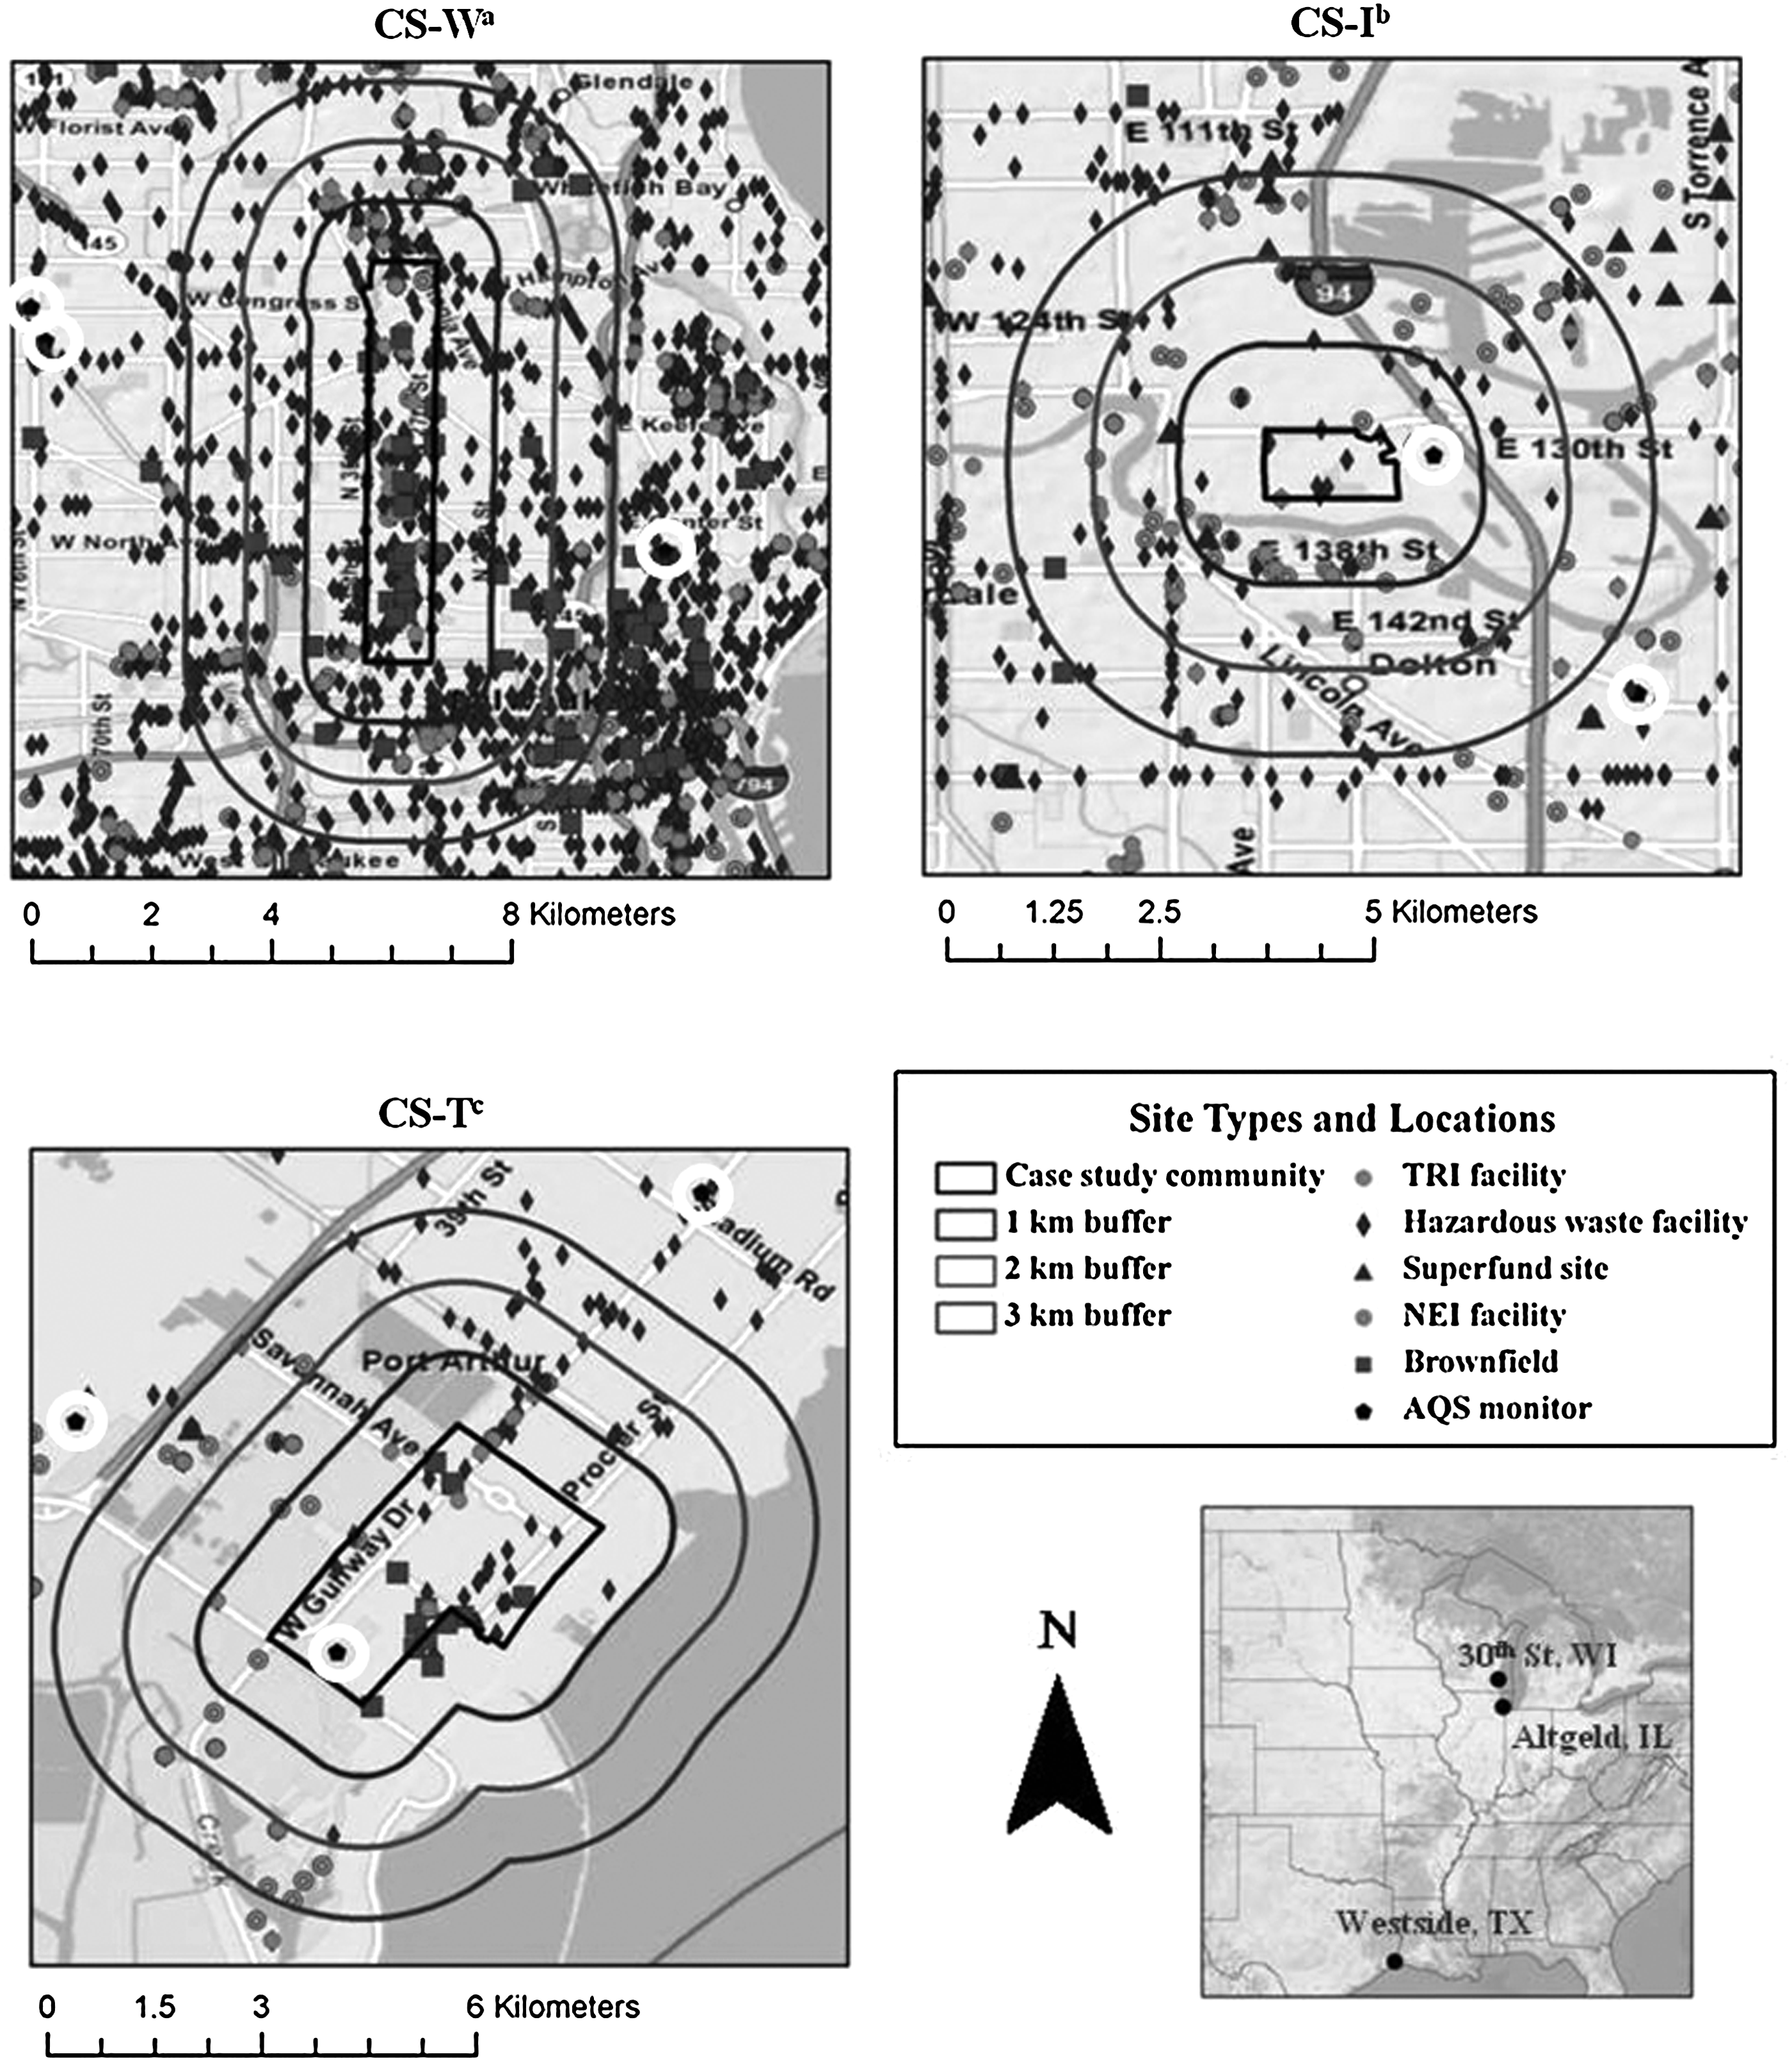
Maps of case study areas: a) CS-W(isconsin), b) CS-I(llinois), and c) CS-T(exas). 1, 2, 3 km buffers and locations of environmental sites and monitoring locations (circled).
Health indicators on infant mortality and low birth weight were available from local health departments, and the remaining indicators on sensitive populations were housed in national public databases. Health information on cancer, respiratory, and cardiovascular disease was also available from local health agencies, but since this information was not consistent across communities, it was not included in this analysis.
Social indicators, such as race/ethnicity and educational attainment, and economic indicators were available through the 2000 US Census Summary Files 1 and 3 at the block group level (Summary File 1: <
Case study locations
Results are presented for three case studies: 1) the 30th Street Industrial Corridor in Milwaukee, Wisconsin (Figure 1a); 2) Altgeld Gardens and Philip Murray Homes (referred to as Altgeld Gardens), a public housing development in Chicago, Illinois (Figure 1b); and 3) the Westside Community of Port Arthur, Texas (Figure 1c). First, a description of each community is provided, then results from the fourteen EJ Indicators are presented. These results primarily reflect the first and second phases of the Toolkit: Problem Formulation and Data Collection. The Discussion section includes considerations and challenges for assessing adverse effects and disproportionate impacts.
The 30th Street Industrial Corridor (termed CS-W) is a 5.5 km2 (2.15 mi2) area with a long history of industrial development. At least ten major industrial operators were located in the community throughout the history of its development. Some operators remain, but there are several underused and underutilized industrial sites. The corridor is designated as one of ten EJ Showcase Communities by the EPA to receive funding and technical assistance during its redevelopment. It also has received funding for brownfields redevelopment. The community residents are in the lower socio-economic status (SES) groups in Milwaukee.
The second case study is Altgeld Gardens in the Calumet region (termed CS-I). The community is surrounded by a number of heavy manufacturing facilities, and closed and active landfills.20 With nearly 1,200 units in a 0.6 km2 (0.25 mi2) area, it is the largest public housing development of the Chicago Housing Authority.21 These residents are in a lower SES community in Chicago.
The third case study is the Westside Community (termed CS-T), which is another EJ Showcase Community. Westside is approximately 4.9 km2 (1.9mi2), although environmental and health concerns extend beyond the borders of the community. It is located in a heavily industrialized area with numerous refineries and chemical plants adjacent to the community's border. It is also a major port town, which includes the potential of air emissions associated with goods movement.22 The community has numerous environmental and health concerns, and the residents are predominately in lower SES groups.
Results
Analysis of EJ Indicators
The fourteen EJ Indicators for the three communities are displayed in Figure 2 with bar and pie charts designed to facilitate the assessment of the similarities and differences of the indicators across scale and between communities. These indicators illustrate the environmental injustice trends for these communities. The community EJ Indicator (represented by the bar graph on the far left position in each frame) is compared to its city, county, and state EJ Indicator values (respectively) represented in the bar graphs for each attribute. Surrounding jurisdictions are often employed as reference populations in EJ assessments.
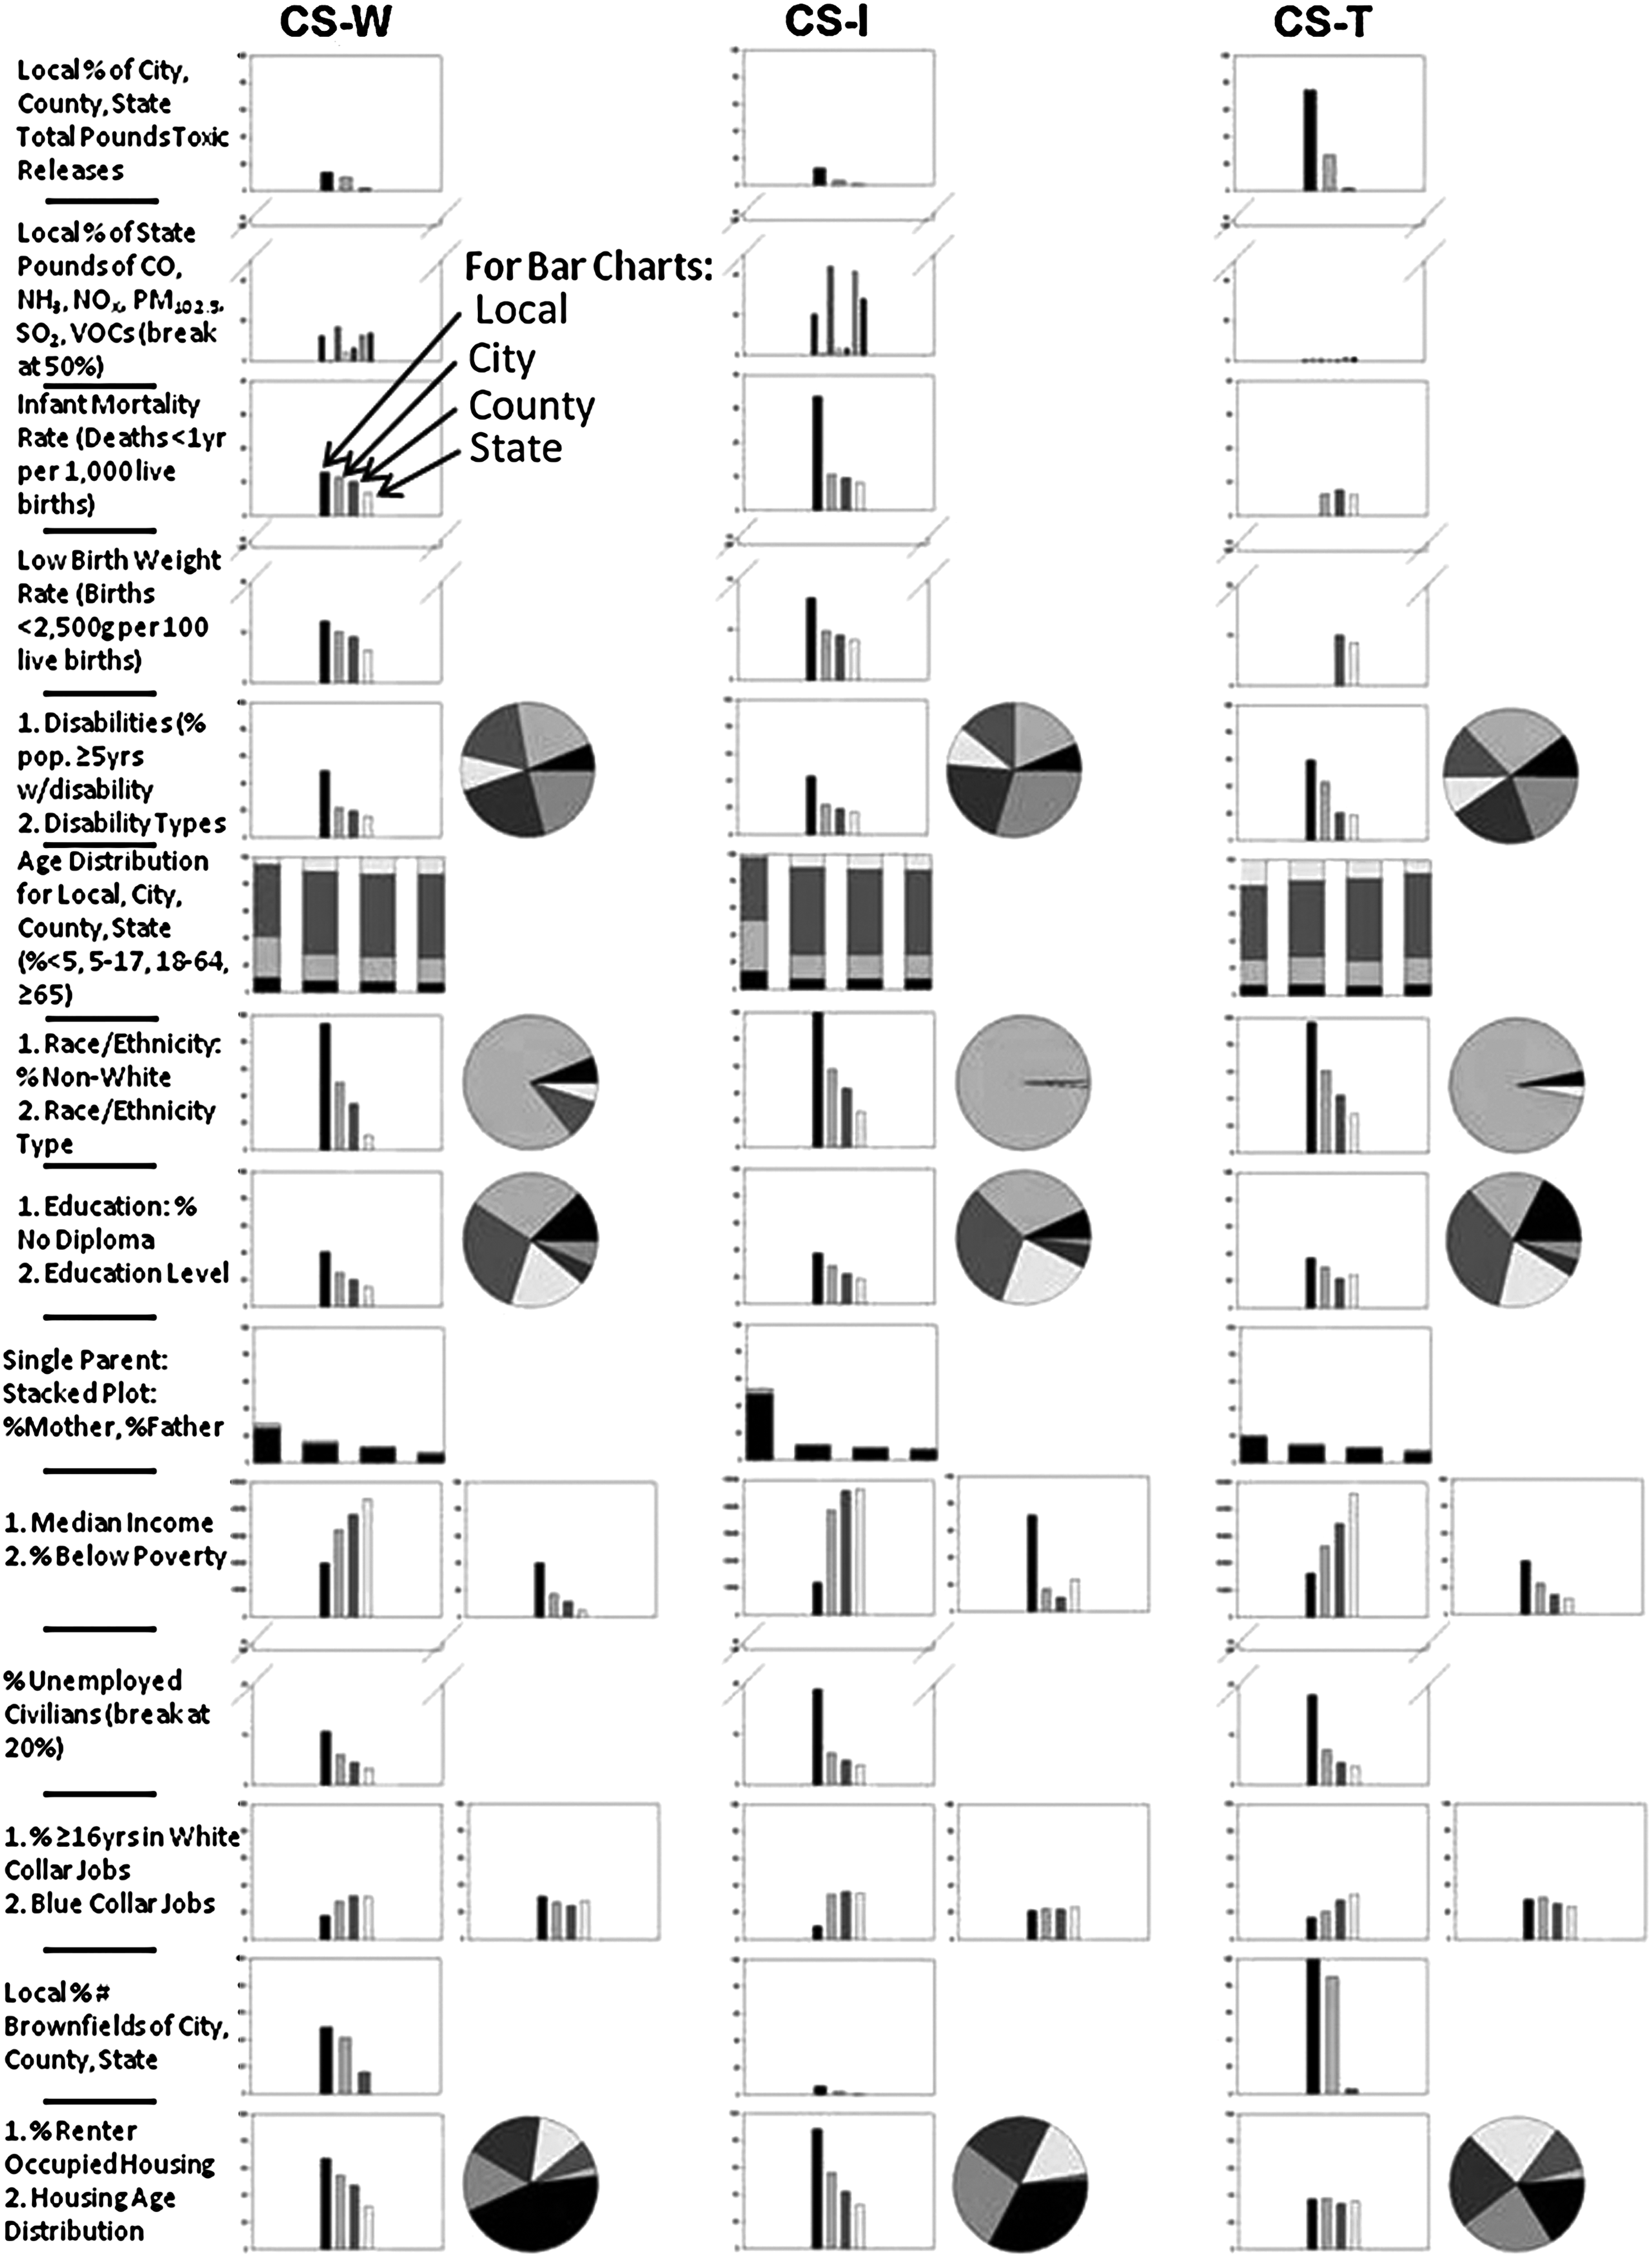
For case studies, CS-W(isconsin), CS-I(llinois), CS-T(exas). Bar charts represent local comparison with city, county, and state. Pie charts are category types for local area.
A simple scan of Figure 2 illustrates how communities with known EJ issues are disproportionately impacted as compared to city, county, and state reference values. If there are disadvantaged communities within those areas, the height of the far left bar graph provides a visible indicator of the extent of the problem. Metrics like these have been incorporated into compiled values to provide an overall score of physical and social vulnerability.23,24
The EJ Indicators also display information from TRI and NEI. For TRI, the graph displays the total pounds of toxic releases within the local community as a percent of the total released in the city, county, and state. CS-W results suggest that the pounds released in the community represent a similar percentage for the city and county; CS-I illustrates a smaller percentage of the total city emissions, and even less for the county; CS-T suggests that a large percentage of the city's total emissions are produced within the community. NEI information is displayed as the county percent of total state emissions for six chemicals. The CS-I county has the highest percentages of the three case studies, with some chemicals having higher percentages than others. The low values for CS-T may be caused by the fact that Texas as a state has high total emissions. Absolute values for chemical concentrations could also be explored with the datasets that generated the graphs.
Health indicators presented here include infant mortality, low birth weight rates, and disabilities (Figure 2). The graphs represent rates for the community, city, county, and state respectively. CS-W community demonstrates high rates compared to the reference areas. CS-I community also has the greatest differential between its rates and the reference areas. CS-T community-level resolution was not available. Sensitive populations are identified by disability status and age group. Disability rates are highest for all case study communities. The CS-W community percentage is over twice that of the city (49.2% and 22.0%) and CS-I is nearly double (43.0% and 22.6%). The pie charts represent the types of disabilities (e.g., sensory and physical). In all communities, there appears to be a consistent distribution of disability types. The CS-W and CS-I communities have a higher percentage of children as residents than their reference areas, and a lower percentage of adults over 65 living in these areas. Socio-economic indicators presented here include race/ethnicity, education, and single-parent households. For the race/ethnicity indicator, the bar charts display the percentage of non-whites, and the pie charts display the distributions of race/ethnicity categories. In all cases, there are a higher percentage of African-Americans living in these communities; however other ethnic minority groups are also represented as illustrated in the CS-W community. For the educational attainment indicator, the bar chart displays the percent population 25 years and older without a high school diploma and the pie charts show the levels of attainment. Each of the three communities has the highest percentage of residents without a high school diploma. Single parent households are represented as stacked plots of percent of population, with single mothers comprising the majority of single parent households. The CS-I community has a higher occurrence of single-parent families than the city (52.4% and 11.8% respectively). In each case study, the percentage of single-parent families was higher than the reference areas.
Economic indicators included income level, employment status, occupation, brownfield properties, and housing characteristics. For each case study community, median household income is lower and the number of families living below the federal poverty line is higher than the reference areas. For example, the CS-W and CS-T communities are well below half of their corresponding states' median household income respectively ($20,000.00 [CS-W] and $43,791.00 [state]; $16,170.00 [CS-T] and $45,861 [state]). The CS-I community median household income is less than half that of the city ($11,933.00 [CS-I] and $38,625.00 [city]). The CS-I community also has a higher percentage of families living in poverty than the other two case studies (71.2%), and it has the greatest percentage differential between the community and reference areas (e.g., 54.6% between community and city).
The unemployment rate for each community is also greater than that of the reference areas, with a 4.6% difference between the CS-W community and city, a 12.8% difference for CS-I, and a 10.9% difference for CS-T. Each community's workforce is comprised primarily of workers in blue-collar jobs, e.g., construction and production occupations, at similar rates as the reference areas. The percentage of white-collar job holders, e.g., management and professional occupations, is noticeably lower, with the CS-I community having the greatest percentage differential (23.9%) between the community and the city. The brownfields indicator chart displays the percentage of brownfields within three kilometers of the community compared to the number of brownfields in the city, county, and state. The CS-W community had 47 brownfields within three kilometers, representing nearly half (49%) of the brownfields in the city, 41.2% of the total in the county, and 15.7% of the state total. All 13 brownfields in the city containing the CS-T community are located within the CS-T community's boundaries, which is nearly 90% (86.7%) of the county total. The indicators for housing and rental for the CS-W and CS-T communities illustrate that over half of the residences are renter-occupied. Pie charts represent the distribution of housing ages. The data indicate that 58.5% of housing units in the CS-W community were built before 1950, with 43.4% of the total number of units built before 1939. Also, 60.4% of the housing units in the CS-I community were built before 1950, while 39.6% of the housing units in the CS-T community were built before 1950.
Results indicate that in all instances where an EJ Indicator would suggest increased vulnerability, the community values exceeded the reference area values, sometimes by over a factor of two. The results imply that these communities could face more challenges in combating environmental hazards than a higher SES status community population. Even though results presented here do not include a rigorous quantitative assessment of disproportionate impacts, the EJ Indicators do provide a thorough overview of the community profiles.
Discussion and Conclusions
Previous journal articles used similar environmental information to assess environmental injustice, including TRI facilities,25,26 hazardous waste,27,28 Superfund,29 and NEI30 sites for proximity analysis. The health, social, and economic indicators have also been used to determine environmental injustice impacts, and represent a body of literature too extensive to list within the scope of this article.
One of the goals of this research is to illustrate that this information (e.g., TRI, NEI, US Census, etc.) is publicly available. The challenge is in downloading, analyzing, and interpreting the data within the context of an EJ framework. However, once the data is presented as a whole, it provides a fairly comprehensive view of community conditions and how they compare to conditions in the city, county, and state. The ability to process this information automatically in an online tool would be a valuable resource for communities and community-based researchers to capture a screening-level view of community conditions. This information could then be supplemented by and complemented with local information to provide a more refined assessment of historical, current, and potential future conditions. Development of this type of online tool is a long-term objective of a research program underway in the EPA Office of Research and Development.31
Two areas that were not addressed in this article relate to the quantitative assessment of disproportionate impacts and cumulative impacts. The visual interpretation of available EJ Indicators as they relate to the community, city, county, and state provide a fundamental basis for performing more quantitative analyses, and can be examined in more detail with additional assessments of disproportionality. We also suggest that any given community may have a unique set of conditions that they view as relevant in promoting awareness and action. Flexibility in processing information is not necessarily a detriment to an objective assessment, but supports the development of both informative and useful assessments. The fact that these data are housed in various databases, with various formats, and with inconsistent analysis and visualization routines hampers a community's ability to access and interpret the information.32 The areas that have the most need for this information have fewer economic and educational resources compared to their reference counterparts. This further increases the hurdles they must overcome to access even publicly available information.
Several methods have been proposed and used successfully to screen large geographic areas to identify potential environmental injustice concerns, but the definition and implementation of cumulative impact assessment remains a challenge for communities and researchers.16,33 These methods provide valuable tools to identify EJ communities, but broader information resources, such as the EJ Indicators presented in the Toolkit, when organized and coupled with direct links to appropriate regulations, policies, and grants, would help inform and empower communities to build consensus, determine relevant points of contact, and provide a range of information that could influence a broad range of stakeholders to action, from community activists, to local government officials, to community-based researchers. Automating this information in an accessible tool, such as the Toolkit, refined to incorporate cumulative analytical routines, is a necessary step towards building sustainable and healthy communities.
Footnotes
Acknowledgments
The authors would like to acknowledge the following people for their informative feedback and support: Anna Ciesielski, Brad Schultz, Valerie Zartarian, Davyda Hammond, Nancy Tian, the members of the Communities Research Program, and US EPA Regions 5 and 6.
Author Disclosure Statement
The authors disclosed no conflicts of interest or financial ties. The United States Environmental Protection Agency (U.S. EPA) through its Office of Research and Development conducted the research described in this article. It has been subjected to Agency review and approved for publication. Mention of trade names or commercial products does not constitute an endorsement or recommendation for use.
1
U.S. Environmental Protection Agency (U.S. EPA), Executive Order 12898 of February 11, 1994 <
2
U. S. Environmental Protection Agency, Toolkit for Assessing Potential Allegations of Environmental Injustice <
3
Faber, Daniel R., and Eric J. Krieg. “Unequal Exposure to Ecological Hazards: Environmental Injustices in the Commonwealth of Massachusetts,” Environmental Health Perspective 110 (2002): 277–288.
4
U.S. EPA. Environmental Justice: Basic Information. <
5
Phillips, Carl V., and Ken Sexton. “Science and Policy Implications of Defining Environmental Justice,” Journal of Exposure Analysis and Environmental Epidemiology 9 (1999): 9–17.
6
Shibley, Mark A., and Annette Prosterman. “Silent Epidemic, Environmental Injustice, or Exaggerated Concern? Competing Frames in the Media Definition of Childhood Lead Poisoning as a Public Health Problem,” Organization & Environment 11 (1998): 33–58.
7
Perlin, Susan A., Ken Sexton, and David W.S. Wong. “An Examination of Race and Poverty for Populations Living Near Industrial Sources of Air Pollution,” Journal of Exposure Analysis and Environmental Epidemiology 9 (1999): 29–48.
8
Mohai, Paul, and Robin Saha. “Racial Inequality in the Distribution of Hazardous Waste: A National-Level Reassessment,” Social Problems 54 (2007): 343–370.
9
Wing, Steve, Dana Cole, and Gary Grant. “Environmental Injustice in North Carolina's Hog Industry,” Environmental Health Perspective 108 (2000): 225–231.
10
Morello-Frosch, Rachel, and Bill M. Jesdale. “Separate and Unequal: Residential Segregation and Estimated Cancer Risks Associated with Ambient Air Toxics in U.S. Metropolitan Areas,” Environmental Health Perspective 114 (2006): 386–393.
11
Apelberg, Benjamin J., Timothy J. Buckley, and Ronald H. White. “Socioeconomic and Racial Disparities in Cancer Risk from Air Toxics in Maryland,” Environmental Health Perspective 113 (2005): 693–699.
12
Linder, Stephen H., Dritana Marko, and Ken Sexton. “Cumulative Cancer Risk from Air Pollution in Houston: Disparities in Risk Burden and Social Disadvantage,” Environmental Science & Technology 42 (2008): 4312–4322.
13
Krieg, Eric J., and Daniel R. Faber. “Not so Black and White: Environmental Justice and Cumulative Impact Assessments,” Environmental Impact Assessment Review 24 (2004): 667–694.
14
Fox, Mary A., John D. Groopman, and Thomas A. Burke. “Evaluating Cumulative Risk Assessment for Environmental Justice: A Community Case Study,” Environmental Health Perspective 110 (2002): 203–209.
15
Barzyk, Timothy M., Kathryn C. Conlon, Teresa Chahine, Davyda D. Hammond, Valerie G. Zartarian, and Brad D. Schultz. “Tools Available to Communities for Conducting Cumulative Exposure and Risk Assessments,” Journal of Exposure Analysis and Environmental Epidemiology 9 (2009):1–14.
16
Callahan, Michael A., and Ken Sexton. “If Cumulative Risk Assessment Is the Answer, What Is the Question?” Environmental Health Perspective 115 (2007):799–806.
17
U.S. EPA. Concepts, Methods and Data Sources for Cumulative Health Risk Assessment of Multiple Chemicals, Exposures and Effects: A Resource Document <
18
National Environmental Justice Advisory Council (NEJAC), Ensuring Risk Reduction in Communities with Multiple Stressors: Environmental Justice and Cumulative Risks/Impacts <
19
U.S. EPA. 2008 Report on the Environment. <
20
Bouman, Mark J. “A Mirror Cracked: Ten Keys to the Landscape of Calumet Region,” Journal of Geography 100 (2001): 104–110.
21
Chicago Housing Authority. Altgeld Gardens and Phillip Murray Homes. <
22
NEJAC. Reducing Air Emissions Associated with Goods Movement: Working towards Environmental Justice. <
23
Rachel Morello-Frosch, “Environmental Justice Screening Method: Integrating Indicators of Cumulative Impact into Regulatory Decision-making,” (paper presented at Strengthening Environmental Justice Research and Decision Making: A Symposium on the Science of Disproportionate Environmental Health Impacts, Washington, DC; March 2010).
24
Andrew Schulman, “EJSEAT: A Screening Tool for EJ Concerns,” (paper presented at Strengthening Environmental Justice Research and Decision Making, Washington, DC; March 2010).
25
Pastor, Manual, James L. Sadd, and Rachel Morello-Frosch. “Reading, Writing, and Toxics: Children's Health, Academic Performance, and Environmental Justice in Los Angeles,” Environment and Planning C: Government and Policy 22 (2004): 271–290.
26
Daniels, Glynis, and Samantha Friedman. “Spatial Inequality and the Distribution of Industrial Toxic Releases: Evidence from the 1990 TRI,” Social Science Quarterly 80 (1999): 244–261.
27
Bullard, Robert D., Paul Mohai, Robin Saha, and Beverly Wright. ‘‘Toxic Waste and Race at Twenty 1987–2007: Grassroots Struggles to Dismantle Environmental Racism in the United States.’’ In A Report Prepared for the United Church of Christ Justice and Witness Ministries, edited by United Church of Christ, 1–84. Cleveland, Ohio: United Church of Christ, 2007.
28
Baden, Brett M., and Don L. Coursey. “The Locality of Waste Sites within the City of Chicago: A Demographic, Social, and Economic Analysis,” Resource and Energy Economics 24 (2002): 53–93.
29
Kearney, Greg, and Gebre-Egziabher Kiros. “A Spatial Evaluation of Socio Demographics Surrounding National Priorities List Sites in Florida Using a Distance-Based Approach,” International Journal of Health Geographics 8 (2009): 33.
30
Grineski, Sara E., Bon Bolin, Christopher Boone. “Criteria Air Pollution and Marginalized Populations: Environmental Inequity in Metropolitan Phoenix, Arizona,” Social Science Quarterly 88 (2007): 535–554.
31
Zartarian, Valerie G., and Brad D. Schultz. “The EPA's Human Exposure Research Program for Assessing Cumulative Risk in Communities,” Journal of Exposure Analysis and Environmental Epidemiology 20 (2010): 351–358.
32
Barzyk, Timothy M., Kathryn C. Conlon, Teresa Chahine, Davyda D. Hammond, Valerie G. Zartarian, and Brad D. Schultz. “Tools Available to Communities for Conducting Cumulative Exposure and Risk Assessments,” Journal of Exposure Analysis and Environmental Epidemiology 9 (2009):1–14.
33
Timothy M. Barzyk. “Tools to Assess Community-Based Cumulative Risk and Exposures,” In McGraw-Hill Yearbook of Science and Technology 2010, 387–390. New York, NY: McGraw-Hill, 2010.