
Abstract
Abstract
This article provides a review of the terms and practices associated with the democratization of cartography, and illustrates their potential to contribute to the environmental justice movement. The Internet has revolutionized how maps are made and communicated. Citizen mapping involves multiple individuals collaborating on the collection and synthesis of spatial data via Web-based software. Google Earth allows users to combine and communicate cartographic information without extensive geospatial training. These developments have freed geography from its stereotype of being a study of place names to a discipline that can engage the public in the collection, analysis, and most important, the comprehension of the power of maps to promote environmental and social justice. We illustrate this potential through a case study in Tallahassee, Florida, where a biomass facility was proposed for a low to moderate income, and minority neighborhood. A permit was granted for the facility without consideration of the input of residents and without critical examination of the disconnect between the regional and local scales on which pollutants are monitored and without considering the actual exposure and impacts to community residents mediated by sociodemographics, environmental, and health status, the hallmarks of environmental injustice. To communicate the fundamental issues in this debate, as well as to illustrate the democratizing turn in geospatial sciences, Google Earth was deployed to integrate global positioning systems (GPS) data, photographs, video, and sociodemographic data. Screenshots from this mapping activity are presented as a means to inform scholars of the potential for Web-based geospatial tools in environmental justice activism. We close with a discussion of how the use of maps requires critical thought and analysis to avoid their misuse.
Introduction
Academic literature on environmental justice borrows methodologies from a wide variety of disciplines, including econometrics, interview and survey techniques, experimental designs, and increasingly, GIS. 3 GIS comprise the computer hardware and software that allow for the storage, manipulation, and analysis of spatial data. 4 With the advent of global positioning systems (GPS) and increased satellite observation of the earth, much of the data collected on infrastructure, environmental health, and physical environment can be linked to spatial coordinates, thus providing location information. Analysis that uses GIS, then, incorporates the spatial component, along with other attribute data, to provide meaningful, local assessments. It comes as no surprise then that the academic and even legal and policy portions of the environmental justice community have adopted GIS in promoting awareness, defending communities, and proposing alternative solutions.
Because of the cartographic and analytic skills required to utilize GIS and to communicate effectively with geospatial technologies, experts largely control the use of GIS in environmental justice. 5 However, this is changing. The availability of Web-based GIS 6 and increased public data sharing 7 opens a window for interested citizens to use such tools for their own purposes. In no way has society reached a panacea of democratic Internet engagement, 8 but new technologies do present ways that may be used to examine community risk factors. 9 Environmental justice proponents may begin using these systems, with or without the expert.
In the following sections, we detail the trends in participatory mapping that have lead to volunteer GIS, and we aim to help clarify some of the technical vocabulary surrounding this movement (Table 1). We also survey the tools that experts or amateurs may adopt to identify environmental health and environmental justice concerns, to map and target areas of interest, and to analyze and assess areas of concern. Last, we present an empirical example of how expert and amateur community members can work together to address local concerns using Web-based GIS and a variety of free Internet tools.
Citizen Mapping
Geographic and GIS research increasingly recognizes that most projects benefit from a wide variety of public testing and participation. Robert Chambers attributed the participatory mapping “pandemic” to “the relative ease with which [mapping] can be facilitated, the fun, fulfillment and pride which people derive from it, and its multiple uses by so many stakeholders.” 10 Conversely, the failure to involve neighborhood collaboration in policy decisions that are based on GIS brings ethical concerns, as well as contestation. 11
In GIS studies that are as varied as resource conservation to disease monitoring, inviting participation from a wide variety of users improves the usefulness, transparency, and legitimacy of the work. Christine Dunn explained that “[t]he inclusion of social information has helped to expose the narrowness of conventional GIS and has opened up a platform for ‘alternative’ visualization of space, place, and reality.” 12 It has further been argued that progress and creativity in participatory mapping has accelerated faster than the geospatial technologies on which they build. 13 In fact, the scholarship that engages health and social justice concerns is seen as the fundamental humanitarian mission of geospatial research. 14 The ability of visual representation to nationally politicize localized events of environmental injustice is particularly important for this engagement. 15
One example of GIS as a tool to promote participation comes from Pune, India, where the NGO Shelter Associates brought computers and GPS devices to help map a large slum that was not recognized by the city's municipal corporation. 16 The slum had not been formally mapped or acknowledged in the Indian census data. Without information on the slum populations and locations, the city failed to provide services, such as running water and sanitation. To help resolve these deficiencies, Shelter Associates partnered with community members to map the slum. The community, in turn, used the legitimacy of the maps and self-conducted census to petition for services. In this case, the project was not well embraced by city officials, although it has led to modest improvements. Another participatory example comes from Southwest Bangladesh, where Hassan 17 interviewed men in the community to help identify suitable sites for locating deep tubewells, thereby presenting safer drinking water alternatives, in a region plagued by arsenic poisoning. Understanding community opinions on threshold walking distances to retrieve water, the appropriate number of wells based on household density, and the relevance of secular and religious schools were used in determining well sites. This work inverted the traditional top-down, expert GIS model, to create a grassroots, community-appropriate plan.
Participatory GIS have in some cases adopted what are called Spatial Decision Support Systems (SDSS), or multi-criteria decision analysis. 18 Decision support facilitates a comparison of several alternative solutions, in order to present multiple viewpoints and promote compromises. A useful example of GIS in decision support is in the case of Sterling Forest, along the New York-New Jersey border, where developers and conservationists were in dispute over territory near a potential development site. 19 Using GIS, a true compromise was made based on criteria that satisfied both groups, but also preserved the area around the Appalachian Trail corridor, minimized forest fragmentation, minimized the impact to the watershed, protected wildlife corridors, and placed new developments near existing developments. While the conservationists would have preferred no new development, and the developers would have preferred fewer restrictions on the development, GIS tools served as a mediating technology to reconcile the two groups. Similar strategies could also be developed in the environmental justice community. 20
Recently, the size of participatory projects has increased from a few interviewees to hundreds or thousands of correspondents. 21 Volunteer GIS projects typically focus on data collection. For example, volunteers have been used to map trails, identify bird species, monitor beehives, and identify flora and fauna for particular physical environments. Many volunteer GIS studies require an expert in GIS to assemble the volunteered information and communicate the final results. Projects such as Wikimapia and the OpenStreetMap project offer final products that are ultimately anonymous, or crowdsourced, yet quite useful. 22 Linking several multi-authored projects on a single platform, Google Earth completely transforms the way we understand the mapping process. Sarah Elwood argues, “[t]his transformation requires a reworking, … of [participatory GIS] accounts that script citizens and grassroots groups as petitioning government officials for data.” 23 Peer-reviewed public health literature already bears witness to this change: doctors and community members, with little outside assistance, ranked and documented community food choices and exercise facilities in the Bronx, communicating their findings with Google Earth. 24 Lefer et al. advocate for the use of Google Earth in community projects, such as theirs, as a means to promote awareness of sources of inequalities in healthy choices.
Nevertheless, an important argument in favor of continued expert-amateur alliances lies in verifying the legitimacy of data. Much of Web 2.0 is without formal metadata, or documentation about the data. Metadata should document the accuracy, authorship, and timestamp of the geospatial data. Google Earth, for example, does not provide metadata for the various layers of geographic data, which may be displayed. Michael Goodchild and others have documented errors in the registry of the satellite imagery. 25 Citizen scientists, or neogeographers, need consultation with expert geographers about potential concerns and misuses of data. 26
Geoweb Tools
Few cartographic endeavors have changed personal cognitive understandings of the earth as Google Earth has. Google Earth, available in free and commercial versions, presents a virtual globe that users can spin, tilt, pan, and zoom in and out. 27 Layered on top of this virtual globe are photos, links to videos, links to books and book reviews, traffic, clouds and weather, restaurants, hotels, and banks, to name a few add-ons, or layers, also described as mashups. Alternatives to Google Earth include NASA Worldwind, an open-source virtual globe with numerous educational extensions that display different satellite views, and Microsoft Virtual Earth, a commercial 2D and 3D mapping platform. The ability to access Google Earth, and similar software, in libraries, in schools, and at home, presents virtual globes as possible platforms for wider community involvement (Table 2).
However, the display map is only one piece of the puzzle. As many in the environmental literature have lamented, data are scarce. 28 Though not ideal, this too is changing. 29 Data are being “democratized,” as part of a larger movement to make public data more transparent and useful for a wider citizenry. For example, the Environmental Protection Agency (EPA) Superfund and Toxic Release Inventory (TRI) databases are public and available on the Internet, as are census data, and a good deal of health data. Additionally, a variety of hardware (GPS) and software (mashups) devices work in conjunction with Google Earth. 30 GPS, for example, may be used to collect data points and to display and share them on Google Earth. Photography may also be displayed, shared, and geo-referenced on Google Earth, using Web sites like Flickr or Picasa. Helpful tools, such as Batch Geocode, enable users to transform lists of addresses into spatially referenced points on Google Earth.
Not only are data being shared, but software and model designs as well. The open source GIS community promotes the public sharing of software design, allowing users to directly change the coding of the programs and to freely distribute new designs. Also, Web-based software design that facilitates mashups, such as Yahoo! Pipes, promotes a community of design-sharing; Boulos explains that “Pipes can also be ‘cloned,’ i.e., imported to one's account in Yahoo! Pipes, and then edited or remixed (as sub-pipes) … to create and publish modified or more complex Pipes and mashups.” 31 Gradually, we foresee analytical tools for GIS, such as cluster analysis and even regression (available in software such as STARS, Geoda, and R 32 ), more closely coupled with virtual globes.
Case Study: Proposed Biomass Plant Site Selection in Tallahassee, Florida
Biomass Gas & Electric LLC (BG&E) planned to construct a $100 million, 45-MW biomass plant in Tallahassee, Florida that would have begun operating in 2010. 33 The proposed plant is an example of renewable technology, but there were other important factors that made this “green” technology a questionable idea. Permitting was based on regional air quality emissions not on the local spatial and temporal scales that matter to the day-to-day residents, nor on the established environmental justice factors of sociodemographics, environment, and health status of the community. 34 Although estimated annual concentrations of contaminants were within the National Ambient Air Quality Standards (Table 3), this same regional standard could be exceeded over local spatial and temporal scales, and when other air pollution sources are considered. Within a 2.5-mile radius of the facility, there are high percentages of minorities, persons over 25 with less than a college degree, and lower levels of income. From 2003 to 2005, the reported cases of asthma hospitalizations 35 in the zip codes that would have been impacted by the proposed biomass plant were notably higher when compared to neighboring zip codes (Table 4). Nine elementary, middle, and high schools are within this local impact area, 36 and the residents of the neighborhoods were not adequately involved nor their input solicited prior to the siting and permitting of the facility.
Cases include inpatient data, or anyone admitted to the hospital with a primary or secondary International Classification of Diseases 9th Revision (ICD-9) (see note 35) code of 493 (asthma)
As part of an environmental justice workshop conducted during the 2009 annual meeting of the American Society for Environmental History, participants were trained in the use of GPS and shown the basics of how to apply Google Earth as a citizen-mapping tool. Taking GPS devices and digital cameras to the proposed biomass site, faculty and students from two universities, and other interested community members collected a variety of contextual data on the location of interest. GPS enabled participants to identify the latitudes and longitudes of the site, schools and neighborhoods near the site, and where photographs and videos were taken. With this information imported into Google Earth, a communicative map (Figure 1) illustrates the compiled multimedia information: maps, census data, videos, photographs, and links to recent news reports. The Google Earth layers exhibit dynamic data simultaneously linked to multiple (clickable) Web sites: the Census, Picasa, YouTube, and the Tallahassee Democrat (as demonstrated with Picasa in Figure 2). All of this geographic information can be saved and emailed via the data structure in Google Earth. To view this information, at any location in the world, all is needed is an Internet connection and the free version of Google Earth.
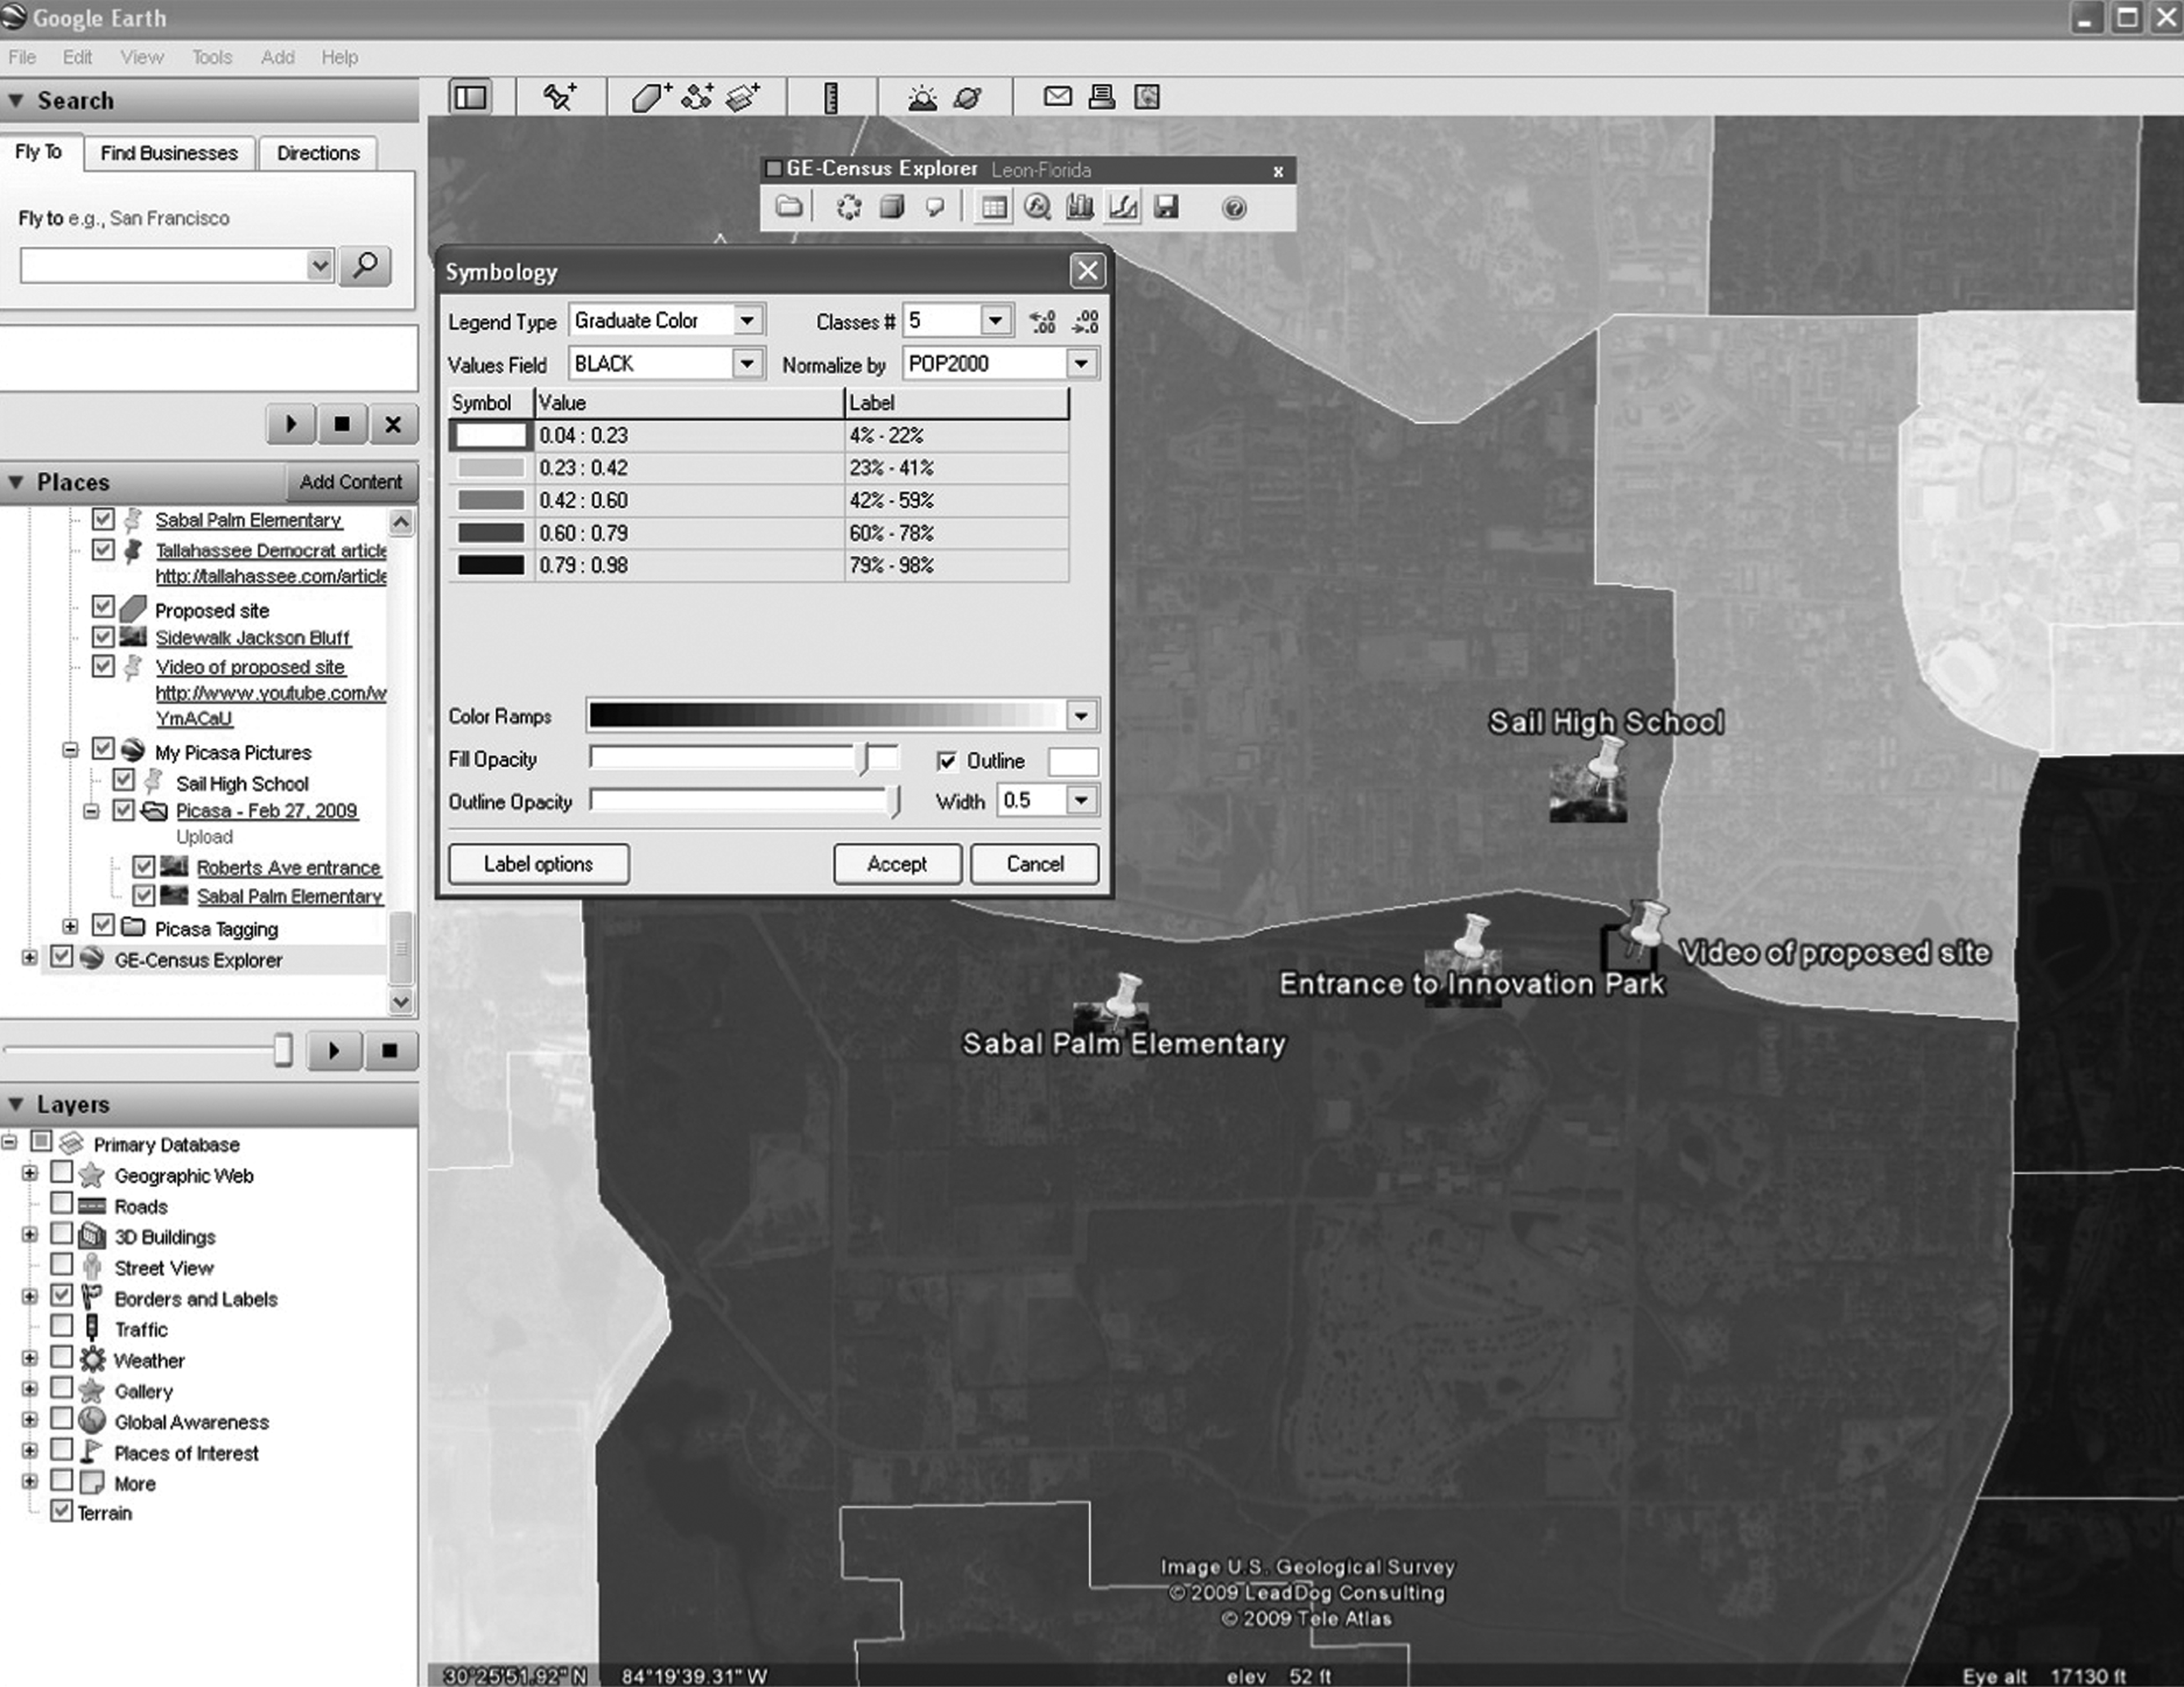
Google Earth placemarks identifying proposed biomass site, nearby schools, and majority African American census tracts, and relevant links and videos.
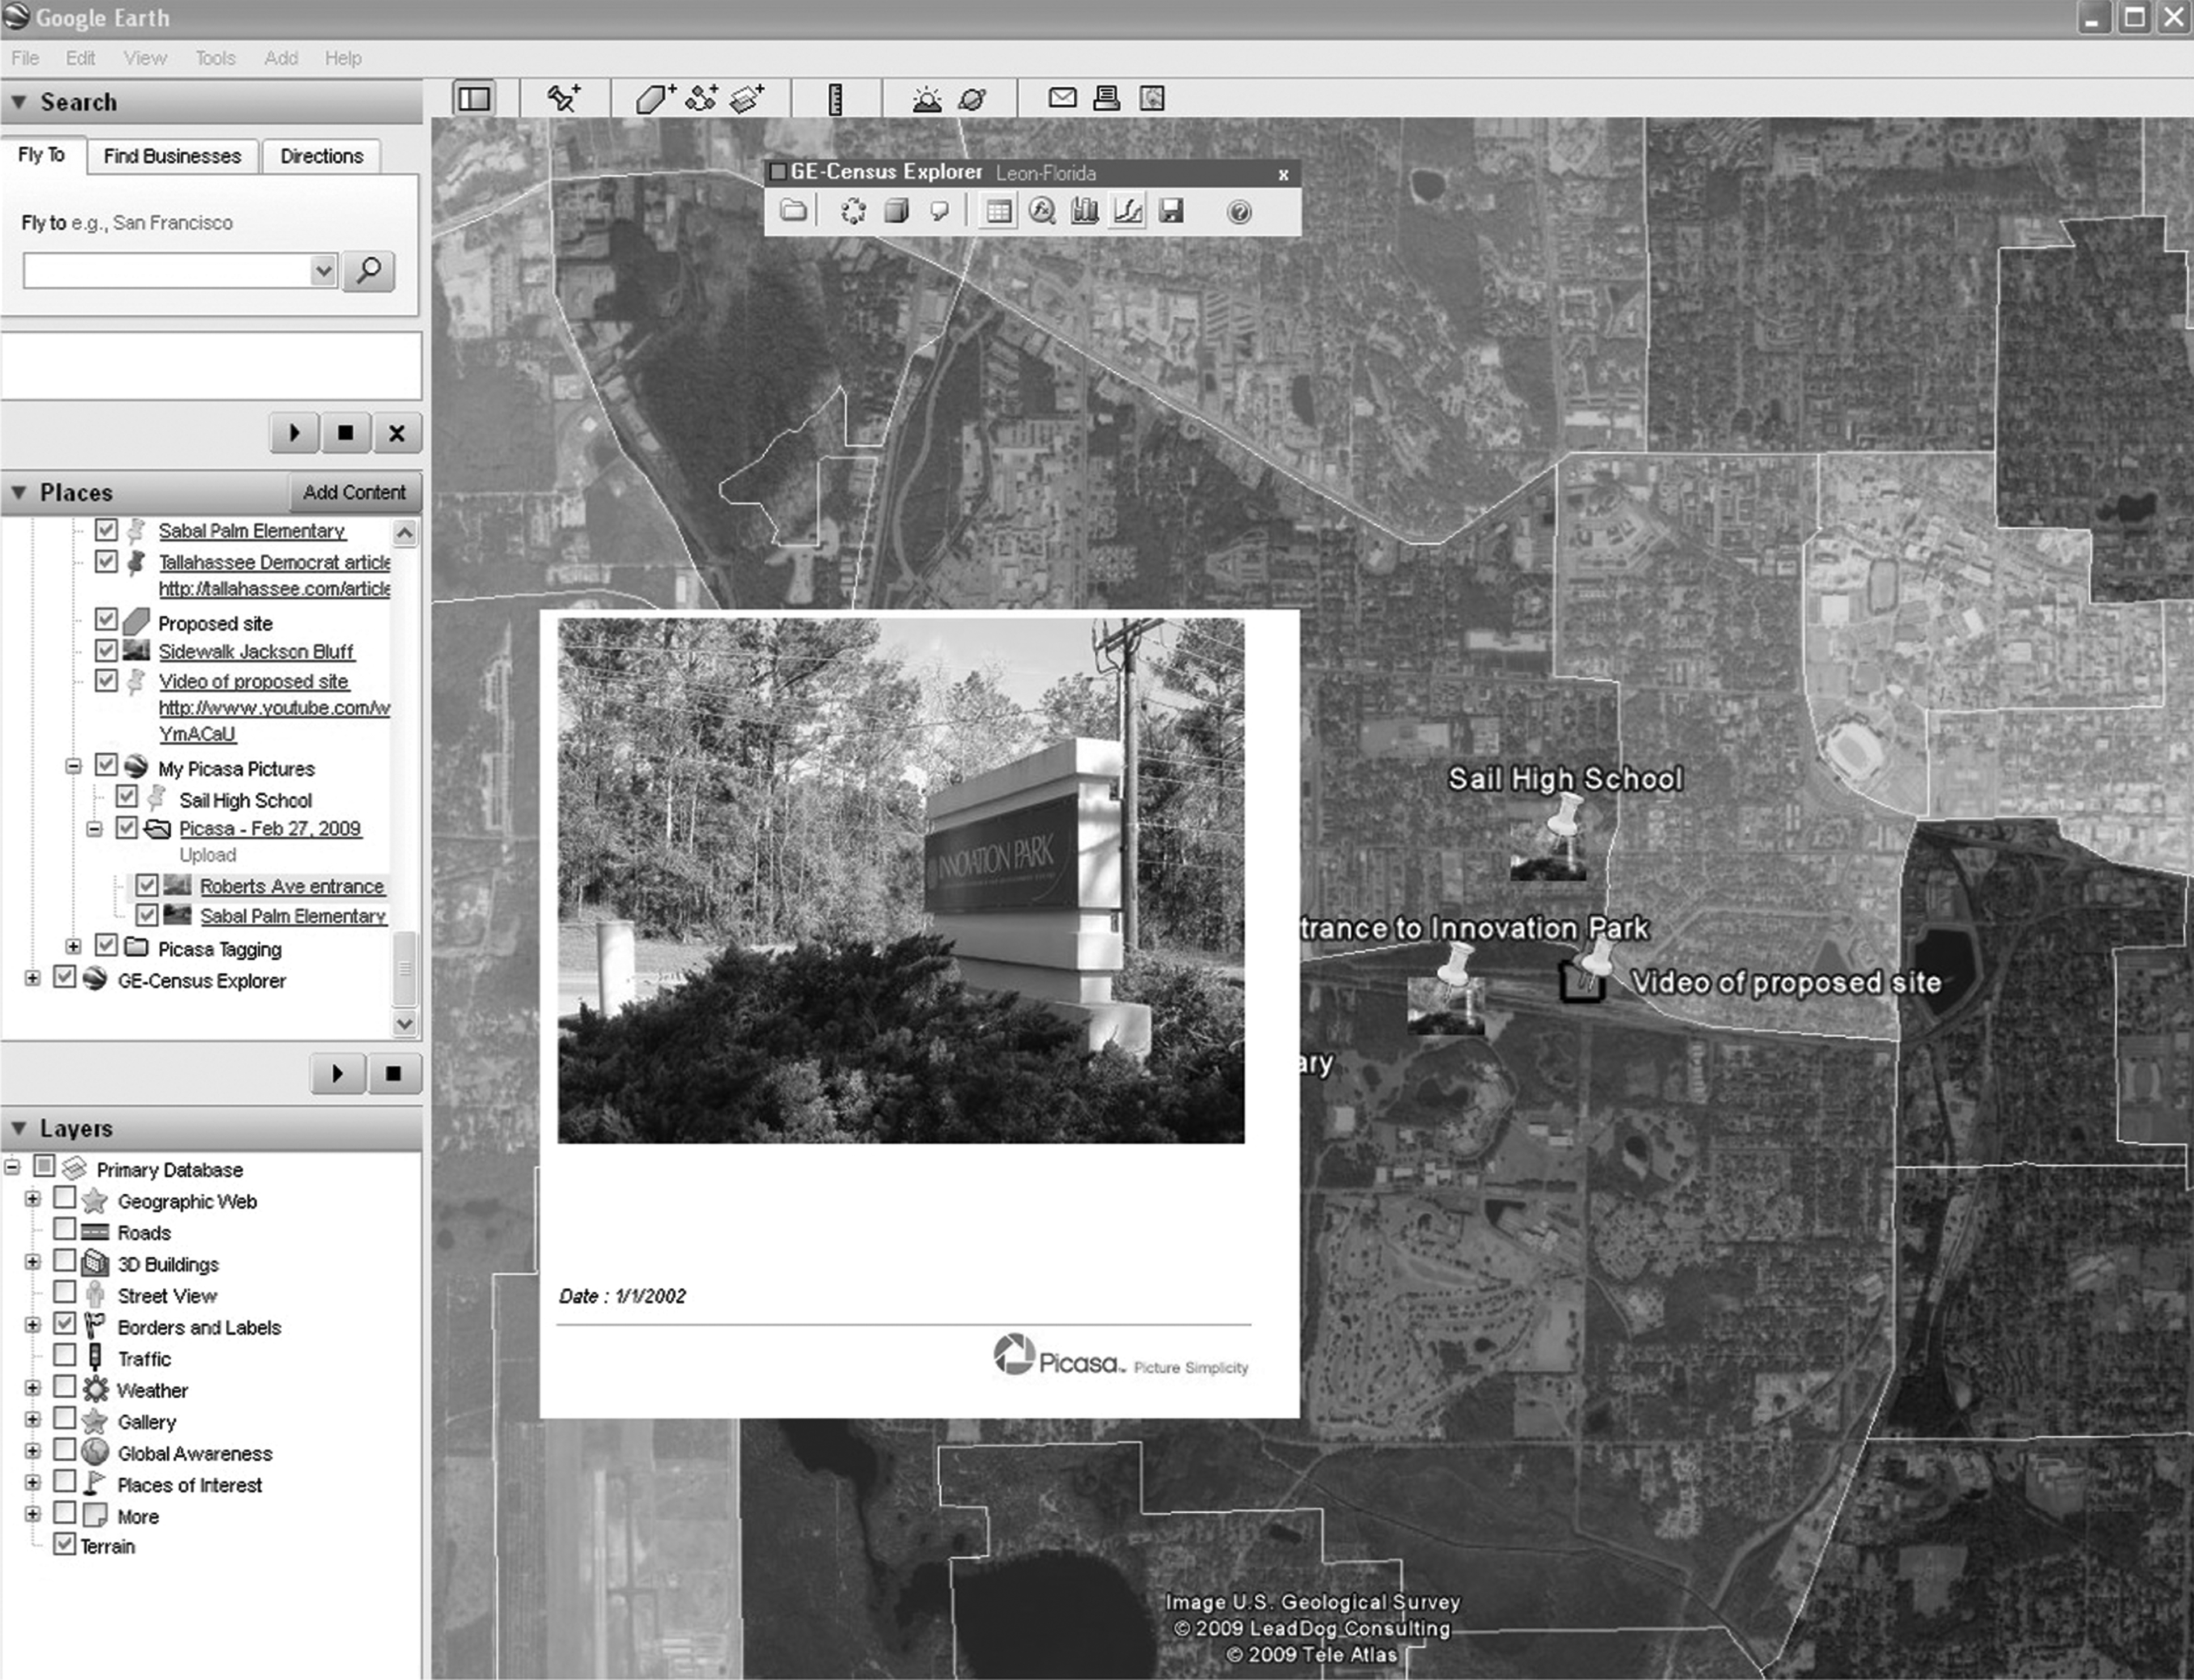
Illustration of photo mash-up with Picasa and Google Earth: the entrance to nearby Innovation Park is shown.
Summary
The upgrading of Geography from a discipline tied to drafting tables and ink pens has been replaced by a version that is mobile, paperless, and above all reflective and critical of the practices and outcomes of mapping. While the tools to make maps have become open and accessible to a wide audience via the Web, geographers still seek to monitor and critique this cartographic democratization. In the past the rulers of empire paid grand sums to their cartographers to chart the world and lay claim to it with maps, the work of geography today turns these dynamics around and constructs maps to challenge claims originating from positions of power. Yet simultaneously, geographers note the limits to mapping. Maps cannot capture all the nuances of exposure that comprise injustice. That the temporal and spatial scales of environmental exposures can be determined with reductionist accuracy through maps is untenable to most geographers. Although mapping in environmental injustice does not yield definitive findings about differential exposure levels or health outcomes for the population in proximity to the noxious facilities or land uses, it does provide the spatial and temporal co-association from which precautionary and preemptive decisions can and should be made. 34 As geographers innovate and develop the tools and new uses that define neo-geography and citizen mapping, less time and expertise will be required to learn spatial technologies, this will enable researchers and environmental justice activists to focus on more substantive questions.
Ultimately, BG&E decided to pursue an alternative site for the project after opposition by diverse constituents beyond the community where the plant was permitted made the first site untenable. These constituents included the Tallahassee-Leon County Council of Neighborhood Associations, and the Florida Center for Environmental Equity and Justice at Florida A&M University. The integration of community knowledge, participation, and innovative GIS mapping may have saved BG&E and the City of Tallahassee a lot of time, effort, and money. However this may be a lesson learned for all parties involved as to the need to always practice collaborative, community-based environmental decision making with special consideration given to existing and potential disparate health impacts when siting in minority and low-income communities.
Footnotes
Author Disclosure Statement
The authors have no conflicts of interest or financial ties to disclose.
1
Downey, Liam. “Using Geographic Information Systems to Reconceptualize Spatial Relationships and Ecological Context.” American Journal of Sociology 112 (2006): 567–612.
2
Maantay, Juliana. “Mapping Environmental Injustices: Pitfalls and Potential of Geographic Information Systems in Assessing Environmental Health and Equity.” Environmental Health Perspectives 2002 (110): 161–171.
3
Liu, Feng. Environmental Justice Analysis: Theories, Methods, and Practice. 2001. Boca Raton, FL: Lewis Publishers.
4
United Nations Department of Economic and Social Affairs, Statistics Division. Handbook on Geospatial Infrastructure in Support of Census Activities. 2009. New York: United Nations. Available at <
5
Sieber, Renée E. “Geographic Information Systems in the Environmental Movement.” In Craig, W.J., Harris, T.M., and Weiner, D., editors, Community Participation and Geographic Information Systems, London: Taylor and Francis (2008): 153–169.
6
Bush, I.G., Gillson, A., Hamilton, M., Perrin, M. “Public Participation—Drawing the Boundaries.” Water and Environment Journal 19 (2005): 181–188.
7
Petkova, Elena, Mauer, Crescencia, Henninger, Norbert, and Irwin, Francis. Closing the Gap: Information, Participation and Justice in Decision-Making for the Environment. 2002. World Resources Institute, Washington, DC. Available at <
8
Obermeyer, Nancy J. “The hidden GIS technocracy.” Cartography and GIS 22 (1995): 78–83. Available at <
9
Lefer, T.B., M.R. Anderson, A. Fornari, A. Lambert, J. Fletcher, J. Baquero, M. “ Using Google Earth as an innovative tool for community mapping.” Public Health Reports 123 (Jul–Aug 2008): 474–480.
10
Chambers, Robert. “Participatory Mapping and Geographic Information Systems: Whose Map? Who is Empowered and Who is Disempowered? Who Gains and Who Loses?” The Electronic Journal of Information Systems in Developing Countries [EJISDC] 25 (2006): 2.
11
Cidell, Julie. “Challenging the contours: critical cartography, local knowledge, and the public.” Environment and Planning A 40 (2008): 1202–1218.
12
Dunn, Christine E. “Participatory GIS: A People's GIS?” Progress in Human Geography 31 (2007): 619.
13
Chambers, Robert. “Participatory Mapping and Geographic Information Systems: Whose Map? Who is Empowered and Who is Disempowered? Who Gains and Who Loses?” The Electronic Journal of Information Systems in Developing Countries [EJISDC] 25 (2006): 1–11.
14
Klinkenberg, Brian. “Geospatial Technologies and the Geographies of Hope and Fear.” Annals of the Association of American Geographers 97 (2007): 350–360.
15
Aitken, Stuart C. “Public Participation, Technological Discourses and the Scales of GIS.” In Craig, W.J., Harris, T.M., and Weiner, D., editors, Community Participation and Geographic Information Systems, London: Taylor and Francis (2008): 357–364.
16
Sen, S., Hobson, J., Joshi, P. “The Pune Slum Census: Creating a Socio-economic and Spatial Information Base on a GIS for Integrated and Inclusive City Development.” Habitat International 27 (2003): 595–611.
17
Hasssan, M. Manzurul. “Arsenic poisoning in Bangladesh: Spatial Mitigation Planning with GIS and Public Participation.” Health Policy 74 (2005): 247–260.
18
Malczewski, Jacek. “GIS-based Multicriteria Decision Analysis: A Survey of the Literature.” International Journal of Geographic Information Science (August 2006) 20: 703–726.
19
Lanthrop, Richard G., John A. Bognar. “Applying GIS and Landscape Ecological Principles to Evaluate Land Conservation Alternatives.” Landscape and Urban Planning 41 (1998): 27–41.
20
Parisi, Domenico, Taquino, Michael, Grice, Stephen Michael, Gill, Duane A. “Promoting Environmental Democracy Using GIS as a Means to Integrate Community into the EPA-BASINS Approach.” Society & Natural Resources 16 (2003): 205–219.
21
Goodchild, Michael F. “Citizens as Sensors: The World of Volunteered Geography.” GeoJournal 69 (2007): 211–221.
22
Goodchild, Michael F. “NeoGeography and the Nature of Geographic Expertise.” Journal of Location Based Services 3 (2009): 82–96.
23
Elwood, Sarah. “Geographic Information Science: Emerging Research on the Societal Implications of the Geospatial Web.” Progress in Human Geography (2009): 3.
24
Lefer, T.B., M.R. Anderson, A. Fornari, A. Lambert, J. Fletcher, J. Baquero, M. “Using Google Earth as an innovative tool for community mapping” Public Health Reports 123 (Jul–Aug 2008): 474–480.
25
Schuurman, Nadine. “The new Brave New World: Geography, GIS, and the Emergence of Ubiquitous Mapping and Data.” Environment and Planning D: Society and Space 27 (2009): 571–580.
26
Joyce, Kerry. ‘“To Me It's Just Another Tool to Help Understand the Evidence’: Public Health Decision-Makers' Perceptions of the Value of Geographical Information Systems (GIS).” Health & Place (2009): 831–840.
27
Butler, Declan. “The Web-wide World.” Nature 439 (2006): 776–778.
28
Brito, Jerry. Hack, Mash & Peer: Crowdsourcing Government Transparency (October 21, 2009). Available at SSRN: <
29
Maclachlan, J. C., M. Jerrett, T. Abernathy, M. Sears, M. J. Bunch. “Mapping Health on the Internet: A New Tool for Environmental Justice and Public Health Research.” Health and Place 13 (Mar. 2007): 72–86.
30
Boulos, M.N.K., M. Scotch, K.H. Cheung, D. Burden. “Web GIS in Practice VI: A Demo Playlist of Geo-Mashups for Public Health Neogeographers.” International Journal of Health Geographics 7 (2008).
31
Boulos, M.N.K., M. Scotch, K.H. Cheung, D. Burden. “Web GIS in Practice VI: A Demo Playlist of Geo-Mashups for Public Health Neogeographers.” International Journal of Health Geographics 7 (2008): 7.
32
Leipzig, Jeremy, and Li, Xiao-Yi. Data Mashups in R. 2009. Sebastopal, CA: O'Reilly.
33
Carr, Housley. “PSC Approves Progress Energy Plans to Enter 20-Year PPA with 75-MW Biomass Plant.” Global Power Report (February 14, 2008): 15.
34
Committee on Environmental Justice. Toward Environmental Justice: Research, Education, and Health Policy Needs. 1999. Institute of Medicine, National Academy of Science National Academies Press.
35
The International Classification of Diseases, 9th Revision, Clinical Modification (ICD-9-CM), Sixth Edition. (2008) National Center Health Statistics and the Centers for Medicare and Medicaid Services.
36
Morrison, Blake, and Heath, Brad. Special Report: “The Smokestack Effect: Toxic Air and America's Schools.” USA Today (December 8, 9, 10, 22, 20, 2008; March 2, 31, 2009; and September 14, 30, 2009).
34
Maantay, Juliana. “Mapping Environmental Injustices: Pitfalls and Potential of Geographic Information Systems in Assessing Environmental Health and Equity.” Environmental Health Perspectives 2002 (110): 161–171.